UPLC-MS vs. NMR in Automated Workflows: A Strategic Guide to Validation, Integration, and Application
This article provides a comprehensive comparison of Ultra-Performance Liquid Chromatography-Mass Spectrometry (UPLC-MS) and Nuclear Magnetic Resonance (NMR) spectroscopy within the context of modern, automated laboratories.
UPLC-MS vs. NMR in Automated Workflows: A Strategic Guide to Validation, Integration, and Application
Abstract
This article provides a comprehensive comparison of Ultra-Performance Liquid Chromatography-Mass Spectrometry (UPLC-MS) and Nuclear Magnetic Resonance (NMR) spectroscopy within the context of modern, automated laboratories. Tailored for researchers, scientists, and drug development professionals, it explores the foundational principles of both techniques and their synergistic integration into high-throughput workflows. We delve into methodological applications across diverse fields, from pharmaceutical impurity testing to natural product discovery, and address key challenges in troubleshooting and optimization. A core focus is placed on rigorous validation frameworks and comparative analysis, offering a strategic guide for selecting and validating the appropriate analytical technique to ensure data integrity, accelerate R&D cycles, and uphold regulatory compliance.
Core Principles: Demystifying UPLC-MS and NMR for Modern Automation
In the pursuit of scientific discovery and rigorous quality control within pharmaceutical and biochemical research, the selection and validation of analytical techniques are paramount. Ultra-Performance Liquid Chromatography-Mass Spectrometry (UPLC-MS) and Nuclear Magnetic Resonance (NMR) spectroscopy represent two foundational pillars of modern analytical science. While often viewed as competing platforms, they offer complementary strengths that, when understood and applied appropriately, can significantly accelerate research and ensure reliability. This guide objectively compares the technological principles, performance characteristics, and practical applications of UPLC-MS and NMR, framing the discussion within the critical context of analytical method validation and the rising paradigm of automated, data-driven research [1] [2].
Core Technological Principles and Workflow
UPLC-MS and NMR operate on fundamentally different physical principles, which directly dictate their applications, strengths, and limitations.
UPLC-MS is a hyphenated technique that combines a high-resolution separation dimension with a highly sensitive detection method. First, the sample mixture is introduced into a UPLC system, where components are separated based on their differential partitioning between a high-pressure liquid mobile phase and a stationary phase within a column [3]. The separated analytes are then ionized (commonly via electrospray ionization) and introduced into a mass spectrometer. Here, ions are separated according to their mass-to-charge ratio (m/z) and detected, providing information on molecular weight and, through fragmentation patterns (MS/MS), structural clues [4]. The entire process is inherently destructive to the sample.
NMR Spectroscopy, in contrast, is a non-destructive technique that probes the magnetic properties of atomic nuclei (most commonly ^1H or ^13C) within a powerful, static magnetic field [5] [4]. When exposed to radiofrequency pulses, these nuclei absorb and re-emit energy at frequencies highly sensitive to their local chemical environment (the "chemical shift"). The resulting spectrum provides a detailed fingerprint that conveys rich structural information, including atomic connectivity, molecular conformation, and dynamics, without the need for prior chromatographic separation [6] [4].
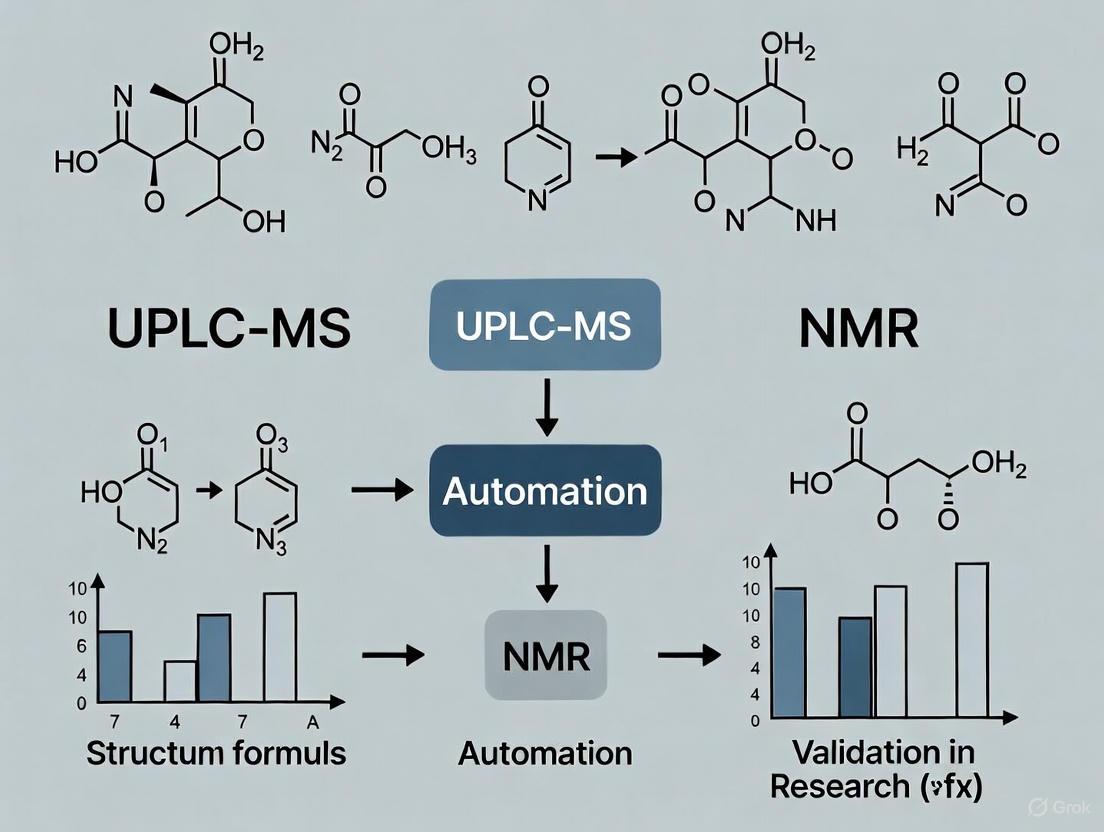
The following diagram illustrates the fundamental workflow and logical relationship between these two analytical approaches:
Diagram 1: Core Analytical Workflows of UPLC-MS and NMR.
Performance Comparison: Quantitative Data
The choice between UPLC-MS and NMR is often driven by specific performance requirements for a given application, such as metabolomics, natural product discovery, or pharmaceutical quality control. The table below synthesizes key comparative metrics from the literature [3] [4] [7].
Table 1: Comparative Performance Characteristics of UPLC-MS and NMR
| Performance Metric | UPLC-MS | NMR | Experimental Context & Citation |
|---|---|---|---|
| Sensitivity | Very High (femtomole to picomole range) [4]. Limits of Detection (LOD) can be 100-1000x lower than NMR. | Low to Moderate (nanomole to micromole range) [4] [7]. Requires significantly more analyte. | General comparison of instrumental capabilities for small molecule analysis [4] [7]. |
| Analytical Reproducibility | Average. Can be affected by matrix effects, ion suppression, and instrument tuning [4] [7]. | Very High. Spectra are highly reproducible across instruments and laboratories, and the technique is inherently quantitative [4] [7]. | Cited as a key advantage of NMR for metabolic phenotyping and quantitative analysis (qNMR) [3] [7]. |
| Metabolite/Chemical Coverage | High. Can detect 300-1000+ metabolites, especially when using multiple chromatography methods (RP, HILIC) [7]. | Lower. Typically profiles 30-100 metabolites in a standard ^1H NMR experiment [7]. | Comparison in the context of untargeted metabolomic profiling of biofluids [7]. |
| Throughput (Run Time) | Longer per sample due to chromatography (minutes). High-throughput via direct infusion (DI-MS) in ~seconds, but with less specificity [3]. | Fast. A simple ^1H NMR spectrum can be acquired in 4-5 minutes per sample with no separation needed [3]. | Comparison of UPLC-HRMS (5 days for 132 samples) vs. DI-HRMS (9 hours) and NMR speed [3]. |
| Structural Elucidation Power | Provides molecular formula (via high-resolution MS) and fragment clues. Often requires standards for definitive ID [4]. | Excellent. Provides unambiguous structural information, distinguishes isomers, and elucidates atomic connectivity via 2D experiments [5] [4]. | Critical for unknown identification in natural products and metabolomics [6] [4]. |
| Quantitative Correlation (vs. Reference) | For 10 specific urinary metabolites, DI-nESI-HRMS showed strong correlation (Pearson’s r > 0.9) with UPLC-HRMS [3]. | qNMR results for marker alkaloids showed good agreement with validated UPLC-PDA quantification [6]. Used to validate MS-based quantification [3]. | Direct comparison of quantitative results from MS and NMR platforms on the same sample sets [3] [6]. |
| Sample Preparation | More complex. Often requires extraction, derivatization (for GC-MS), or careful dilution to manage matrix effects [7]. | Minimal. Often requires only buffering in Dâ‚‚O for biofluids, or simple extraction for tissues [6] [7]. Can analyze intact tissues [7]. | Key practical difference affecting workflow simplicity and potential for automation. |
Integration in Automated and Autonomous Research
The modern trend toward high-throughput experimentation (HTE) and autonomous laboratories underscores the need for robust, automatable analytical techniques [1] [2] [8]. Both UPLC-MS and NMR are being integrated into these advanced workflows, but their roles differ.
UPLC-MS is a central workhorse in automated platforms due to its sensitivity, compatibility with liquid handling robots, and fast data acquisition for screening. It is routinely used for reaction monitoring, compound purity assessment, and high-throughput metabolomics [1] [8]. Recent advancements feature AI-powered LC systems that autonomously optimize method parameters [1].
NMR, while historically less automated, is increasingly incorporated into closed-loop systems for definitive structural verification. Benchtop NMR spectrometers are key components in modular autonomous platforms, where mobile robots transport samples from synthesizers to UPLC-MS and NMR for orthogonal analysis [2]. The heuristic decision-making in such systems uses both MS and NMR data to assign reaction success, mimicking expert judgment [2].
The convergence of these techniques within an automated validation framework is powerful: UPLC-MS provides rapid, sensitive screening and quantification, while NMR offers definitive, reproducible structural confirmation and validation of quantitative results, as seen in method validation for GMP release testing [9].
Diagram 2: Integrated UPLC-MS/NMR in an Autonomous Lab Workflow.
Detailed Experimental Protocols
To illustrate practical implementation, below are summarized methodologies from key comparative studies.
Protocol 1: Comparative Metabolic Profiling of Human Urine (UPLC-HRMS vs. DI-nESI-HRMS) [3]
- Sample: 132 human urine aliquots from an epidemiological cohort.
- Sample Prep (DI-nESI-HRMS): 10 µL urine diluted 50-fold with water. An aliquot mixed with labeled internal standards in methanol (final water:methanol, 1:2).
- Sample Prep (UPLC-HRMS): Used low- and high-speed centrifugation details (truncated in source).
- Instrumentation:
- UPLC-HRMS: Reversed-phase UPLC coupled to a high-resolution Q-TOF mass spectrometer.
- DI-nESI-HRMS: TriVersa NanoMate system for direct infusion nanoelectrospray coupled to a Synapt G2-S HRMS.
- Data Acquisition: Full-scan HRMS data in both positive and negative ion modes.
- Quantification: Calibration curves using the method of standard additions in a pooled urine sample for both platforms. Quantitative data for 35 metabolites compared.
- Analysis: Multivariate analysis (e.g., PCA) on full-scan data for sex-based classification. Correlation (Pearson’s, Passing-Bablok) and agreement (Bland-Altman) assessed between methods.
Protocol 2: Chemotypic Variation Study Using ^1H-NMR and UPLC-MS [6]
- Sample: 145 methanol extracts of Sceletium tortuosum plants.
- ^1H-NMR Protocol:
- Preparation: Plant material extracted with methanol. Extract dissolved in deuterated methanol with a reference standard.
- Acquisition: Spectra acquired on a standard NMR spectrometer (e.g., 600 MHz). Standard 1D ^1H pulse sequence with water suppression.
- Analysis: Multivariate analysis (PCA) on processed spectral data. Quantitative NMR (qNMR) used for marker compounds (e.g., pinitol, alkaloids).
- UPLC-MS Protocol:
- Preparation: Acid/base extracts of 289 samples.
- Acquisition: Separation on a UPLC system with a C18 column, coupled to a mass spectrometer.
- Analysis: Hierarchical cluster analysis (HCA) and orthogonal projections to latent structures-discriminant analysis (OPLS-DA) on MS data. Quantification of mesembrine alkaloids via a validated UPLC-PDA method.
The Scientist's Toolkit: Essential Research Reagent Solutions
Table 2: Key Reagents and Materials for UPLC-MS and NMR Experiments
| Item | Primary Function | Typical Use Context |
|---|---|---|
| Deuterated Solvents (e.g., D₂O, CD₃OD) | Provides an NMR-inert solvent to avoid overwhelming analyte signals with solvent proton peaks. Essential for locking and shimming the NMR signal [5] [4]. | Sample preparation for ^1H-NMR spectroscopy of biofluids, tissue extracts, or synthetic compounds [3] [6]. |
| Labeled Internal Standards (Isotope-Labeled, e.g., ¹³C, ²H) | Corrects for variability in sample preparation and ionization efficiency in MS. Used for absolute quantification via calibration curves [3]. | Added to all samples in quantitative MS-based metabolomics (e.g., urinary metabolite panel) [3]. |
| NMR Reference Standard (e.g., TMS, DSS) | Provides a precise chemical shift reference point (δ 0 ppm) for calibrating NMR spectra, ensuring reproducibility and accurate quantification in qNMR [6]. | Added in a known concentration to sample solutions for ^1H-NMR analysis [6]. |
| LC-MS Grade Solvents (Acetonitrile, Methanol, Water) | Minimizes background chemical noise and ion suppression in the mass spectrometer. Essential for achieving high sensitivity and reproducible chromatography [3]. | Used as mobile phase components in UPLC-MS and for sample dilution/preparation [3]. |
| SPE (Solid-Phase Extraction) Cartridges | Purifies and concentrates analytes from complex biological matrices (e.g., urine, plasma), removing salts and proteins that can interfere with both MS and NMR analysis [4]. | Offline sample clean-up prior to LC-MS-NMR analysis, or in LC-MS-SPE-NMR workflows for trapping LC peaks for concentrated NMR analysis [4]. |
| Buffering Agents (e.g., Phosphate Buffer) | Controls pH in NMR samples, ensuring consistent chemical shifts for exchangeable protons (e.g., -NH, -OH) and improving spectral reproducibility [3] [6]. | Used in preparation of urine and other biofluid samples for NMR-based metabolomics [3]. |
| 15-Methylheptadecanoyl-CoA | 15-Methylheptadecanoyl-CoA, MF:C39H70N7O17P3S, MW:1034.0 g/mol | Chemical Reagent |
| AMP-PNP lithium hydrate | AMP-PNP lithium hydrate, MF:C10H17N6O12P3, MW:506.20 g/mol | Chemical Reagent |
In the field of modern analytical science, Ultra-Performance Liquid Chromatography-Mass Spectrometry (UPLC-MS) and Nuclear Magnetic Resonance (NMR) spectroscopy represent two foundational techniques for compound identification, quantification, and structural elucidation. The selection between these platforms involves critical trade-offs between sensitivity, throughput, structural insight, and quantitative accuracy. This guide provides an objective comparison of their performance characteristics, supported by experimental data and methodologies relevant to automated research environments, to inform scientists in research and drug development.
Fundamental Technical Comparison
UPLC-MS and NMR operate on fundamentally different physical principles, which directly define their inherent strengths and limitations for analytical applications. The core characteristics are systematically compared in the table below.
Table 1: Fundamental Comparison of UPLC-MS and NMR Technologies
| Characteristic | UPLC-MS | NMR |
|---|---|---|
| Detection Principle | Measurement of mass-to-charge ratio (m/z) of ionized molecules [4] | Excitation of magnetically-active nuclei (e.g., 1H, 13C) in a magnetic field [4] |
| Typical Limits of Detection | Femtomolar (10â»Â¹âµ) to attomolar (10â»Â¹â¸) range [10] | Micromolar (≥1 μM) range [10] |
| Quantitative Capability | Challenging; requires internal standards and is affected by ion suppression [10] [11] | Excellent; inherently quantitative with a wide dynamic range using a single internal standard [4] [11] |
| Throughput | High (minutes per sample with chromatography) [3] | Moderate to High (minutes for simple 1D experiments) [4] |
| Structural Information | Molecular mass, formula from exact mass, fragmentation patterns [4] | Direct information on atomic connectivity, functional groups, and stereochemistry [4] [10] |
| Key Strength | Extremely high sensitivity and specificity [10] | Non-destructive, provides definitive structural elucidation and is inherently quantitative [4] [10] |
| Key Limitation | Ion suppression from co-eluting compounds; cannot distinguish isomers without standards [4] [10] | Relatively low sensitivity compared to MS [4] |
Experimental Data and Performance Benchmarks
Quantitative Performance in Metabolomics
A direct comparison of quantitative performance was demonstrated in a study of human blood serum, where an NMR-guided MS quantitation method was developed. Using a single serum specimen quantified by NMR as a reference, researchers achieved absolute quantitation of 30 metabolites via MS. The results showed excellent correlation (R² > 0.99) for most metabolites, with a median coefficient of variation (CV) of 3.2%, validating that MS can achieve quantitative accuracy comparable to NMR when properly referenced [11].
Throughput and Classification Ability in Urinary Metabolite Profiling
A comparative study of UPLC-HRMS and Direct Infusion-nanoESI-HRMS for profiling 132 human urine samples provides critical throughput data. The study found that while UPLC-HRMS provided more specific metabolite identification, the total run time for the sample set in both polarities was 5 days for UPLC-HRMS versus only 9 hours for DI-nESI-HRMS. Despite the faster analysis, the DI-nESI method showed comparable classification ability for sex-related metabolic differences, with the significant discriminatory features being mostly the same in both platforms [3].
For quantitative analysis of a panel of 35 metabolites, 10 metabolites showed a strong correlation (Pearson’s r > 0.9) between the two MS platforms, while a further twenty showed acceptable correlation. Only five metabolites showed weak correlation (Pearson’s r < 0.4), overestimated by the DI-nESI method, highlighting that the suitability of faster, chromatography-free methods is analyte-dependent [3].
Structural Elucidation of Unknowns
The superior power of combining these techniques is exemplified in phytochemical research. An untargeted study of Crescentia cujete fruit combined UPLC-MS/MS-based molecular networking with conventional isolation and NMR. This integrated approach successfully identified 66 metabolites. Crucially, NMR was required for the definitive structural determination (Level 1 confirmation) of 18 compounds, including three previously undescribed iridoid glucosides. This demonstrates that while MS is powerful for profiling and tentative identification, NMR is often indispensable for confirming novel structures, especially for distinguishing isomers and establishing atomic connectivity [12].
Experimental Protocols for Comparison
Protocol for NMR-Guided MS Quantitation
This protocol enables absolute quantitation of metabolites in biological fluids using MS, with NMR as a reference [11]:
- Sample Preparation: Add methanol to serum samples in a 1:2 (v/v) ratio to precipitate proteins. Vortex, incubate at -20°C for 20 minutes, and centrifuge to pellet proteins.
- Sample Splitting: Filter the supernatant and split it into two parts.
- NMR Analysis: Reconstitute one part in a deuterated phosphate buffer containing the internal standard TSP (3-(trimethylsilyl)propionic acid-d4 sodium salt). Acquire 1H NMR spectra on a high-field spectrometer (e.g., 800 MHz) using a quantitative pulse sequence (e.g., CPMG with a long recycle delay). Use software to fit spectral lines and determine absolute metabolite concentrations with reference to TSP.
- MS Analysis: Dilute the other part for LC-MS/MS analysis. Use the NMR-derived concentrations from one specimen as a primary reference to generate a calibration for subsequent MS-based quantitation of other samples.
Protocol for Comparative UPLC-MS vs. Direct Infusion MS
This methodology directly compares chromatographic and infusion-based MS approaches [3]:
- Sample Preparation: Dilute urine samples (e.g., 10 μL diluted 50-fold with water). Add a multianalyte mixture of isotopically labeled internal standards.
- Platform Analysis:
- UPLC-HRMS: Inject samples onto a reversed-phase UPLC column coupled to a high-resolution mass spectrometer.
- DI-nESI-HRMS: Infuse samples directly into a nanoelectrospray source (e.g., TriVersa NanoMate) coupled to an HRMS instrument.
- Data Processing: For both platforms, perform exploratory analysis on full-scan HRMS data using multivariate statistics. For targeted quantification, use calibration curves prepared in a pooled urine matrix.
Integrated Workflows and Automation in Research
The complementary nature of UPLC-MS and NMR makes them ideal for integration in automated workflows. A key application is in process research, where automated systems like the FLEX AUTOPLANT combine benchtop NMR with other analytical techniques [13]. The workflow can be visualized as follows:
Diagram 1: Integrated Automated Analysis Workflow
Software solutions further enable this integration. For instance, scripts can automatically process and report data from both LC-MS and NMR analyses within a single document, performing tasks like peak picking for NMR and molecule matching for MS, thereby consolidating quality control [14].
Essential Research Reagents and Materials
Successful implementation of these analytical techniques relies on specific reagents and materials. The following table details key items used in the experiments cited in this guide.
Table 2: Key Research Reagents and Materials for UPLC-MS and NMR Analyses
| Reagent / Material | Function / Application | Experimental Context |
|---|---|---|
| Deuterated Solvents (e.g., Dâ‚‚O) | NMR solvent; provides a lock signal and minimizes strong solvent proton signals that would overwhelm analyte signals [4] [11]. | Used in serum metabolomics for sample preparation in deuterated phosphate buffer [11]. |
| Isotopically Labeled Internal Standards | MS internal standards; correct for variability in sample preparation and ionization efficiency for accurate quantification [3] [11]. | Used in both UPLC-MS and DI-nESI-MS analysis of urine and serum for targeted quantification of metabolites [3] [11]. |
| TSP (TMS-equivalent) | NMR internal standard; provides a reference peak at 0 ppm and enables absolute quantitation [11]. | Used as the concentration reference in quantitative NMR analysis of blood serum metabolites [11]. |
| Methanol (HPLC/MS Grade) | Protein precipitation; removes proteins from biofluibles prior to analysis to protect instrumentation and reduce matrix effects [3] [11]. | Used in a 1:2 serum-to-methanol ratio for protein removal in serum metabolomics [11]. |
| Ammonium Acetate / Acetic Acid | Mobile phase additives; promote ionization in LC-MS, particularly in positive and negative electrospray ionization modes [11]. | Used in the mobile phase for targeted LC-MS analysis of serum metabolites [11]. |
| Reverse-Phase UPLC Columns | Chromatographic separation; separates complex mixtures of analytes prior to MS detection to reduce ion suppression [3]. | Used in the UPLC-HRMS platform for profiling human urine samples [3]. |
UPLC-MS and NMR are not competing but profoundly complementary technologies. UPLC-MS offers superior sensitivity and is ideal for high-throughput profiling and targeted quantification of low-abundance metabolites, especially when leveraging fast, direct infusion methods. NMR provides unmatched capabilities in definitive structural elucidation and inherent quantitation, making it the gold standard for identifying novel compounds and validating quantitative methods. The future of analytical validation in automated research lies not in choosing one technique over the other, but in developing integrated workflows and data analysis platforms that seamlessly leverage the combined strengths of both UPLC-MS and NMR.
The landscape of drug discovery and metabolomics is undergoing a revolutionary transformation through the integration of Ultra-Performance Liquid Chromatography-Mass Spectrometry (UPLC-MS) and Nuclear Magnetic Resonance (NMR) spectroscopy into fully automated, high-throughput workflows. This convergence represents a paradigm shift from isolated analytical operations to connected ecosystems that accelerate research and development cycles. The combination of these complementary technologies provides researchers with a more comprehensive analytical toolkit: UPLC-MS brings exceptional sensitivity and selectivity for compound separation and identification, while NMR offers definitive structural elucidation and inherently quantitative data without the need for identical standards [4]. This guide objectively compares the performance of these integrated platforms against traditional standalone approaches, providing experimental data and methodologies that demonstrate their transformative potential in modern analytical laboratories.
The driving force behind this integration is the growing need to characterize complex mixtures of organic compounds synthesized at decreased scales in medicinal chemistry [15]. As the pharmaceutical industry shifts toward miniaturized parallel synthesis, the demand for purification and characterization platforms capable of handling thousands of compounds annually has intensified. The automated coupling of UPLC-MS and NMR addresses this challenge by providing complementary data critical for structural verification while significantly reducing manual intervention and accelerating the Design-Make-Test-Analyze (DMTA) cycles fundamental to drug discovery [16].
Technical Comparison: UPLC-MS and NMR as Complementary Analytical Pillars
UPLC-MS and NMR spectroscopy provide fundamentally different but highly complementary analytical information. Understanding their respective capabilities and limitations is essential for effective integration into automated workflows.
UPLC-MS operates on the principle of chromatographic separation followed by mass-based detection. It offers exceptional sensitivity with limits of detection in the femtomole range for analytes with high ionization efficiency, enabling the identification of compounds at very low concentrations [4]. The technique provides molecular weight information and, through exact mass measurements, enables the deduction of elemental composition. Tandem mass spectrometry (MS/MS) further yields structural information based on characteristic fragmentation patterns [4]. A key limitation, however, is that UPLC-MS typically requires authentic standards for definitive structural identification and can struggle to distinguish isobaric compounds and positional isomers.
NMR spectroscopy, in contrast, exploits the magnetic properties of certain atomic nuclei to provide definitive structural characterization. It identifies compounds through chemical shifts (influenced by electron shielding), splitting patterns (revealing neighboring nuclei), and multi-dimensional experiments (showing atomic connectivity) [4]. Unlike MS, NMR is not affected by matrix effects, is inherently quantitative, and provides non-destructive analysis with sample recovery potential [4]. However, NMR suffers from relatively low sensitivity, requiring microgram quantities of material and longer acquisition times ranging from minutes for simple 1H spectra to hours or days for more complex 2D experiments [4].
Table 1: Fundamental Characteristics of UPLC-MS and NMR Spectroscopy
| Parameter | UPLC-MS | NMR |
|---|---|---|
| Detection Limit | Femtomole range (10â»Â¹Â³ mol) [4] | Microgram range (10â»â¹ mol) [4] |
| Structural Information | Molecular weight, elemental composition, fragmentation patterns [4] | Atomic connectivity, functional groups, stereochemistry [4] |
| Quantitation | Requires standards; subject to matrix effects [4] | Inherently quantitative; no standards needed [4] |
| Sample Throughput | Seconds to minutes per sample [4] | Minutes to hours per sample [4] |
| Isomer Differentiation | Limited capability [4] | Excellent capability [4] |
| Sample Recovery | Destructive analysis [4] | Non-destructive; sample can be recovered [4] |
Integrated Workflow Architecture: From Sample to Analysis
The complete integration of UPLC-MS and NMR into automated platforms requires sophisticated engineering and software solutions that streamline the entire analytical process from sample preparation to data interpretation. This architectural framework enables seamless transition between analytical modalities while maintaining sample integrity and tracking.
Diagram 1: Automated UPLC-MS-NMR workflow
The integrated workflow begins with automated sample preparation using robotic systems like Chemspeed platforms, which handle weighing, dissolution, and dilution with precision and reproducibility [17]. These prepared samples then undergo UPLC-MS analysis where compounds are separated and initially characterized. Critical to the automation is the use of software platforms like SAPIO LIMS that track samples through the entire process and integrate with data processing tools such as Analytical Studio to interpret chromatographic and mass spectrometric data [16]. Based on this analysis, target compounds are directed to peak collection systems that concentrate analytes for NMR analysis. The automated NMR component then acquires spectral data, with recent innovations enabling sample generation with as little as 10 μg of material by utilizing dead volume in liquid handling systems [15]. Finally, data integration combines results from both techniques to provide comprehensive structural verification before compounds are delivered as DMSO solutions ready for biological assays [16].
Experimental Data and Performance Metrics
Metabolomics Studies Comparing Serum and Plasma Profiles
A comprehensive study comparing human serum and plasma metabolites using both untargeted ¹H NMR spectroscopy and UPLC-MS demonstrated the complementary nature of these techniques. After correcting for inter-individual variation, researchers identified distinct metabolic profiles between sample types [18].
Table 2: Metabolite Differences Between Serum and Plasma Identified by Combined NMR and UPLC-MS
| Analytical Technique | Higher in Serum | Lower in Serum |
|---|---|---|
| ¹H NMR | Lipoproteins, lipids in VLDL/LDL, lactate, glutamine, glucose [18] | - |
| UPLC-MS | Lysophosphatidylethanolamine (lysoPE)(18:0), Lysophosphatidic acid(20:0) [18] | Phosphatidylcholines (PC)(16:1/18:2, 20:3/18:0, O-20:0/22:4), lysoPC(16:0), PE(O-18:2/20:4), sphingomyelin(18:0/22:0), linoleic acid [18] |
The experimental protocol for this comparison involved collecting serum, platelet-rich plasma (PRP), platelet-poor plasma (PPP), and platelet-free plasma (PFP) from 8 non-fasting apparently healthy women. Samples were analyzed using untargeted standard 1D and CPMG ¹H NMR alongside reverse phase and hydrophilic (HILIC) UPLC-MS. Data analysis employed validated principal component and orthogonal partial least squares discriminant analysis, with special attention to correcting for inter-individual variation, which initially obscured sample-type differences [18].
Diagnostic Biomarker Discovery in Pregnancy Disorders
In a study screening serum potential biomarkers for intrahepatic cholestasis of pregnancy (ICP), researchers combined ¹H-NMR and UPLC-MS/MS to achieve comprehensive metabolic profiling. The experimental protocol first employed ¹H-NMR metabolomics on serum samples from 20 ICP patients and 20 matched healthy controls, revealing significant perturbations in amino acid metabolism and choline-related pathways [19]. UPLC-MS/MS was subsequently used to quantify eight choline pathway metabolites across expanded cohorts, including 40 ICP patients, 17 ursodeoxycholic acid (UDCA)-treated ICP patients, and 40 healthy pregnant women [19].
The integrated approach revealed marked elevations in serum choline (+92.0%), betaine (+22.0%), methionine (+37.7%), dimethylglycine (+163.1%), and cystathionine (+13.6%) in ICP patients compared to controls. UDCA intervention significantly reduced choline (-21.0%) and dimethylglycine (-32.5%) levels versus untreated ICP. Most importantly, the combination of choline and dimethylglycine demonstrated exceptional diagnostic performance with an area under the receiver operating characteristic curve (AUROC) of 0.88 when combined using a logistic regression model [19].
Natural Product Analysis Using Combined Platforms
Research on Panax ginseng berries from seven cultivars employed both UPLC-QTOF/MS and HR-MAS NMR-based metabolic profiling to characterize primary and secondary metabolites. The UPLC-QTOF/MS analysis focused on profiling 26 ginsenosides (secondary metabolites), while HR-MAS NMR was used to profile primary metabolites [20]. This combined approach enabled the classification of cultivars based on their metabolic characteristics. For example, the Kumpoong and Sunwon cultivars were classified based on ginsenoside profiles, while the Kumpoong and Gopoong cultivars were distinguished by their primary metabolites [20].
The experimental methodology revealed that the Gopoong cultivar contained higher levels of most amino acids (arginine, phenylalanine, isoleucine, threonine, and valine), the highest level of choline, and the lowest level of myo-inositol. The Kumpoong cultivar showed significantly lower levels of protopanaxatriol (PPT)-type ginsenosides Re and Rg2 compared to other cultivars, while other PPT-type ginsenosides were present in much higher amounts [20].
Automation Protocols and Implementation Frameworks
High-Throughput Purification and Characterization Workflow
Janssen R&D has implemented a comprehensive High-Throughput Purification (HTP) workflow that integrates RP-HPLC-MS and/or SFC-MS systems with NMR spectroscopy. This automated platform processes compounds at scales ranging from regular to microscale (∼3.0-75.0 μmol) and handles 36,000 compounds yearly [15] [16].
The experimental protocol begins with crude sample analysis via RP-LC-MS or SFC-MS systems. Method development employs selectivity as the primary parameter affecting resolution, achieved by using different stationary phases with varied surface chemistries and retentivities. For reversed-phase chromatography, different organic solvents and pH mobile-phase buffers modulate selectivity, while SFC incorporates additives into the organic content for the same purpose [16]. Following analysis, automated purification is performed, after which all purified compounds undergo High-Throughput Nuclear Magnetic Resonance (HT-NMR) analysis aided by in-house-built Python scripts to reduce cycle time [16]. The final output is registered compounds delivered as DMSO solutions ready for replication and distribution to biological assays.
Integrated Platform for Reaction Monitoring and Optimization
Bruker BioSpin and Chemspeed have developed integrated platforms that combine automated synthesis with real-time analysis. These systems feature Chemspeed's modular automation solutions coupled with Bruker's Fourier 80 benchtop NMR or high-field NMR instruments, creating closed-loop systems for reaction optimization [17].
The experimental setup involves Chemspeed systems carrying out reactions and feeding the resulting products directly into benchtop NMRs for real-time monitoring. Data transfer is facilitated by integrating Chemspeed's control software with Bruker's reaction monitoring software. When paired with advanced processing tools, data can be immediately interpreted and used to inform next steps. This creates a closed-loop system where AI or machine learning algorithms can direct the next round of experiments based on previous results, enabling fully autonomous, self-optimizing workflows [17].
Essential Research Reagents and Materials
Successful implementation of integrated UPLC-MS and NMR workflows requires specific reagents and materials optimized for compatibility across both analytical techniques.
Table 3: Essential Research Reagents for Integrated UPLC-MS-NMR Workflows
| Reagent/Material | Function/Purpose | Technical Considerations |
|---|---|---|
| Deuterated Solvents (e.g., Dâ‚‚O, deuterated acetonitrile) | NMR compatibility by reducing solvent proton interference [4] | Cost consideration; deuterium isotope effect may slightly shift retention times in LC [4] |
| LC-MS Grade Acetonitrile and Methanol | Mobile phase components for UPLC separation [21] [16] | High purity minimizes background noise and ion suppression in MS [16] |
| Ammonium Acetate/Formate | Mobile phase buffers for improved chromatographic separation [21] | Volatile salts compatible with MS detection; concentration typically 5-10 mM [21] |
| Formic Acid | Mobile phase additive to improve ionization in positive MS mode [21] [16] | Typical concentration 0.1%; can affect pH-dependent separation [21] |
| Ammonium Hydroxide | Mobile phase additive for basic pH conditions in MS [16] | Alternative to formic acid for negative ionization mode or basic compounds [16] |
| DMSO-d₆ | Deuterated solvent for NMR sample preparation [16] | Preferred for final compound dissolution for biological testing [16] |
Technique Comparison and Orthogonal Verification
The complementary strengths of UPLC-MS and NMR create a powerful orthogonal verification system that surpasses either technique alone. This is particularly valuable in applications requiring high confidence in structural identification, such as pharmaceutical development and natural product discovery.
UPLC-MS excels at detecting and quantifying compounds at low concentrations within complex mixtures, while NMR provides definitive structural confirmation, especially for isomers and novel compounds. This orthogonal relationship was demonstrated in a metabolomics study of second-trimester amniotic fluid and maternal urine, where UPLC-MS and NMR were used in tandem to identify pregnancy disorder biomarkers [22]. The combination reinforced a metabolic picture of fetal hypoxia, enhanced gluconeogenesis, TCA activity, and hindered kidney development affecting fetal malformation pregnancies, while also newly revealing changes in carnitine, pyroglutamate, and polyols [22].
In pharmaceutical settings, this orthogonal verification is crucial for quality control. A study on Menispermi Rhizoma established a UPLC-DAD-MS method for characterizing and quantifying alkaloids, successfully identifying a counterfeit sample that was further verified by appearance and microscopic identification [21]. The integrated method overcame limitations of previous quality control approaches, including scant chemical markers, long analytical times, consumption of large amounts of organic solvents, and limitations to single dosage forms [21].
Diagram 2: Orthogonal verification relationship between UPLC-MS and NMR
The integration of UPLC-MS and NMR into automated high-throughput workflows represents a significant advancement in analytical science, particularly for drug discovery and metabolomics. The experimental data and protocols presented demonstrate that these combined platforms offer synergistic capabilities that surpass what either technique can achieve independently. The continued evolution of these integrated systems—featuring enhanced automation, reduced material requirements, and sophisticated data processing—is poised to further accelerate research cycles while improving analytical confidence.
As labs continue their digital transformation, the seamless connection between synthesis, purification, and analytical verification will become increasingly standard. With ongoing innovations in miniaturization, sensitivity enhancement, and artificial intelligence-driven data interpretation, the fully automated lab integrating UPLC-MS and NMR technologies will become the benchmark for industrial and academic research, enabling faster discovery timelines and more reliable characterization of chemical entities.
Defining the Analytical Target Profile (ATP) for Technique Selection
In the realm of automated analytical research, selecting the right technology is a critical decision that directly impacts the quality, efficiency, and success of drug development projects. The Analytical Target Profile (ATP) serves as a foundational tool in this process, providing a prospective summary of the performance characteristics an analytical procedure must possess to be fit-for-purpose [23] [24]. This guide objectively compares two powerful techniques—UPLC-MS and NMR—within the context of ATP-driven selection, providing experimental data and protocols to inform scientists and development professionals.
Understanding the Analytical Target Profile (ATP)
The ATP is a formalized concept within regulatory guidelines such as ICH Q14 and USP <1220>. It defines the requirements for the reportable value produced by an analytical procedure, ensuring the method is suitable for its intended use throughout its lifecycle [23] [24].
- Key Definition: The ATP is a "prospective summary of the performance characteristics describing the intended purpose and the anticipated performance criteria of an analytical measurement" [23].
- Role in Technology Selection: The ATP drives the choice of analytical technology. It is defined based on the required quality of the measurement, independent of a specific technique, though the operating environment is a key consideration [23] [24]. A well-defined ATP enables scientists to screen and select the most appropriate technology from available fit-for-purpose options [25].
- Core Components: As illustrated in the example below, an ATP details the intended purpose, links to Critical Quality Attributes (CQAs), and defines performance characteristics and their acceptance criteria, such as accuracy, precision, and reportable range [24].
Table 1: Example Analytical Target Profile Structure
| Component | Description |
|---|---|
| Intended Purpose | Description of what the analytical procedure measures (e.g., quantitation of an active ingredient, impurity level) [24]. |
| Technology Selection & Rationale | The selected technology (e.g., HPLC, NMR) and justification based on the ATP requirements [24]. |
| Link to CQAs | Summary of how the procedure provides reliable results for the assessed quality attribute [24]. |
| Performance Characteristics | Criteria such as Accuracy, Precision, Specificity, and Reportable Range with defined acceptance limits [24]. |
Technique Comparison: UPLC-MS vs. NMR
Ultra-Performance Liquid Chromatography-Mass Spectrometry (UPLC-MS) and Nuclear Magnetic Resonance (NMR) spectroscopy offer complementary capabilities. The choice between them is guided by how well their inherent strengths align with the ATP's demands for a given application.
Table 2: Core Characteristics of UPLC-MS and NMR
| Characteristic | UPLC-MS | NMR |
|---|---|---|
| Sensitivity | Very High (femtomole range) [4] | Moderate (microgram range) [4] |
| Selectivity/Specificity | High (chromatographic separation + mass detection) [3] | High (resolves isobaric compounds and positional isomers) [4] |
| Structural Information | Molecular weight, fragmentation patterns; requires standards for definitive ID [4] | Direct atomic connectivity and functional group information [4] [26] |
| Quantification | Excellent with calibration; susceptible to matrix effects [4] | Inherently quantitative; no calibration curves needed [4] |
| Sample Throughput | High (minutes per sample) [3] | Low (minutes to hours per sample) [4] |
| Automation Friendliness | Highly amenable to automation [27] | Compatible with automated flow probes and liquid handling [28] [27] |
Experimental Data and Protocol Comparison
A direct comparison of UPLC-MS and Direct Infusion-nanoESI-MS (DI-nESI-MS) for human urinary metabolic profiling provides robust, quantitative data on performance. In this study, both methods were applied to the same set of 132 urine samples [3].
Key Experimental Outcomes:
- Throughput: DI-nESI-MS analysis was significantly faster, completing the sample set in 9 hours compared to 5 days for UPLC-MS in both polarities [3].
- Correlation of Quantitative Data: For a panel of 35 metabolites, 10 showed a strong correlation (Pearson’s r > 0.9) between the two MS methods, indicating these can be reliably measured by the faster, infusion-based technique. However, five metabolites showed weak correlation (r < 0.4) due to overestimation by DI-nESI-MS, highlighting a limitation where chromatographic separation is critical [3].
- Classification Ability: Despite the lack of separation, exploratory analysis of the full-scan HRMS data from DI-nESI showed comparable ability to UPLC-MS in classifying samples based on sex-related metabolic differences [3].
Detailed Experimental Protocol
The methodology below, adapted from the referenced study, outlines the key steps for a comparative metabolomics analysis [3].
1. Sample Preparation
- Material: Human urine samples (e.g., from an epidemiological cohort).
- Procedure:
- Thaw urine aliquots.
- Dilute sample (e.g., 10 µL urine) 50-fold with ultrapure water.
- Transfer an aliquot of the diluted sample to a well plate.
- Add a multianalyte mixture of isotopically labeled internal standards in methanol.
- Adjust to a final solvent proportion (e.g., water–methanol 1:2) [3].
2. Instrumental Analysis
- UPLC-HRMS Conditions:
- Column: Reversed-phase UPLC column (e.g., C18).
- Mass Spectrometer: High-Resolution Mass Spectrometer (e.g., Q-TOF).
- Gradient: Optimized binary solvent gradient for metabolite separation.
- Data Acquisition: Full-scan high-resolution mass spectrometry in both positive and negative ionization modes [3].
- DI-nESI-HRMS Conditions:
- Infusion System: Automated nanoelectrospray source (e.g., TriVersa NanoMate).
- Mass Spectrometer: High-Resolution Mass Spectrometer (e.g., Q-TOF).
- Data Acquisition: Direct infusion of the prepared sample with full-scan high-resolution mass spectrometry [3].
3. Data Processing and Analysis
- Metabolite Identification & Quantification: Use the ratio of analyte intensity to its corresponding internal standard. Generate calibration curves in a pooled sample matrix for quantification [3].
- Statistical Analysis: Perform multivariate analysis (e.g., PCA, PLS-DA) on the full-scan HRMS data for exploratory analysis. Use correlation analysis (e.g., Pearson’s) and regression models (e.g., Passing-Bablok) to compare quantitative results between platforms [3].
Integrated and Automated Workflows
Modern automation research increasingly focuses on integrating UPLC-MS and NMR into streamlined workflows to leverage their complementary strengths.
- The Case for Integration: MS excels at sensitive detection and quantification, while NMR provides definitive structural elucidation for unknowns and isomers [4] [26]. Integrating them provides a more comprehensive analytical picture.
- Automated Structure Verification: Systems like Sanofi's automated lab tool combine LC/MS and ¹H NMR data to efficiently verify chemical structures proposed by chemists, significantly speeding up the process [29].
- Workflow for Purification and Analysis: An automated purification-NMR workflow demonstrates high-throughput integration. This system purifies compounds via UPLC-MS and uses the "dead volume" from liquid handling to automatically prepare NMR samples in 1.7 mm tubes, enabling structural verification from as little as 10 µg of material without impacting biological assay samples [27].
Essential Research Reagent Solutions
Table 3: Key Reagents and Materials for UPLC-MS and NMR Experiments
| Reagent/Material | Function | Application Notes |
|---|---|---|
| Isotopically Labeled Internal Standards | Enables precise quantification by correcting for matrix effects and instrument variability [3]. | Critical for both UPLC-MS and DI-nESI-MS quantitative assays. |
| Deuterated Solvents (e.g., D₂O, CD₃OD) | Provides a locking signal for the NMR spectrometer and minimizes solvent interference in the ¹H spectrum [4]. | Cost can be a consideration; D₂O is relatively inexpensive. |
| LC-MS Grade Solvents | High-purity solvents to minimize background noise and ion suppression in MS [3]. | Essential for achieving high sensitivity in UPLC-MS. |
| Boric Acid | Acts as a preservative for urine samples to maintain metabolite integrity during storage [3]. | Used in specific biofluid collection protocols. |
| Methanol & Water | Used for sample dilution, reconstitution, and as mobile phase components [3]. | Standard solvents for sample preparation in both techniques. |
UPLC-MS and NMR are not mutually exclusive technologies but are powerful partners in the automated analytical laboratory. The choice between them, or the decision to integrate them, must be driven by a clearly defined Analytical Target Profile. UPLC-MS is the champion for high-sensitivity, high-throughput quantification, whereas NMR is unparalleled for definitive structural elucidation and inherent quantification. By leveraging the ATP framework and adopting integrated, automated workflows, researchers can ensure their analytical strategies are rigorously designed, efficiently executed, and fully fit-for-purpose.
From Theory to Practice: Implementing Automated UPLC-MS and NMR Workflows
Automated Reaction Monitoring and Optimization with Online NMR
The integration of online Nuclear Magnetic Resonance (NMR) spectroscopy into automated reaction monitoring and optimization represents a significant advancement in process analytical technology. This approach provides real-time, non-destructive structural elucidation capabilities that are complementary to established techniques like Ultra-Performance Liquid Chromatography-Mass Spectrometry (UPLC-MS). As the pharmaceutical and chemical industries increasingly adopt high-throughput and parallel synthesis methodologies, the demand for robust, automated analytical techniques for structural verification and reaction optimization has intensified [27]. Online NMR fulfills this need by providing definitive structural information, including the ability to distinguish between isomers—a common limitation of MS-based techniques [4]. This article objectively compares the performance of automated online NMR against other analytical alternatives, particularly UPLC-MS, within the context of modern automation research, providing researchers and drug development professionals with experimental data and protocols to inform their analytical strategies.
Comparative Analysis of UPLC-MS and NMR in Automated Workflows
Fundamental Technical Comparison
Table 1: Fundamental Characteristics of UPLC-MS and NMR for Automated Analysis
| Characteristic | UPLC-MS | Online NMR |
|---|---|---|
| Primary Information | Molecular mass, elemental composition, fragmentation patterns [4] | Detailed structural information, atomic connectivity, isomer distinction [4] |
| Limit of Detection | Femtomole range (for high ionization efficiency) [4] | High nanogram to microgram range (∼10 μg for 1.7 mm tubes) [27] [4] |
| Quantitation | Semi-quantitative; susceptible to ion suppression/matrix effects [4] | Inherently quantitative; independent of matrix effects [4] |
| Isomer Differentiation | Limited capability [4] | Excellent for epimers, regioisomers, atropisomers [27] |
| Analysis Speed | Seconds per sample [4] | Minutes to hours per sample [4] |
| Sample Throughput | Very high (thousands/day possible) | Moderate to high (e.g., 36,000/year in one workflow) [27] |
| Automation Integration | Well-established in LC-MS workflows [27] | Emerging in high-throughput workflows [27] |
| Destructive Nature | Destructive | Non-destructive; sample recovery possible [4] |
Performance in Automated Reaction Monitoring and Optimization
Table 2: Performance Comparison in Automated Reaction Monitoring Applications
| Parameter | UPLC-MS | Online NMR |
|---|---|---|
| Structural Verification | Requires authentic standards for definitive identification [4] | Direct structure confirmation without standards [27] |
| Reaction Kinetics Monitoring | Excellent for fast kinetics due to rapid analysis [4] | Suitable for slower kinetics; real-time monitoring with flow systems [30] [31] |
| Isotope Detection | Can detect but may require specialized methods | Highly sensitive to isotopic variants, even without enrichment [32] |
| Reaction Optimization | Provides concentration data for key species | Enables direct structural insight for pathway optimization [30] |
| Solvent Requirements | Compatible with standard LC solvents | Prefers deuterated solvents to avoid signal interference [4] |
| Probe Technology | Standard ESI, APCI, etc. sources | Cryoprobes, microcoils, flow cells for enhanced sensitivity [4] |
Experimental Protocols and Implementation
High-Throughput Purification and NMR Workflow (Pfizer)
Pfizer developed an automated workflow that couples purification with NMR sample generation, handling 36,000 compounds annually. The process rescues the "dead volume" typically discarded during liquid handling to prepare NMR samples without consuming material prioritized for biological assays [27].
Protocol Details:
- Sample Submission: Compounds are submitted through a Laboratory Information Management System (LIMS) as singletons or libraries across three scales: Traditional (tPMC: 10–100 mg), Analytical (aPMC: >1–10 mg), and Micro (μPMC: 0.03–1 mg) [27].
- Purification: Uses Waters UPLC systems with 3.0 min gradients for μPMC/aPMC and 8.5 min for tPMC. Isolation is triggered by mass (ESI+) or UV. Both achiral (LC-MS) and chiral (SFC-MS) purifications are employed [27].
- NMR Sample Generation: Dynamic scripts control a Tecan liquid handler to add DMSO to vials containing the rescued dead volume (∼25 μL for traditional, ∼10 μL for analytical/micro scales). This creates samples suitable for 1.7 mm NMR tubes, obtaining quality spectra from as little as 10 μg of material [27].
- Analysis: Acquired NMR data undergoes automated structure verification, integrating synthesis, purification, and characterization into a single high-throughput workflow [27].
Self-Optimizing Flow Reactor with Online NMR
A system integrating a Magritek Spinsolve Ultra benchtop NMR with a flow reactor demonstrated fully automated reaction optimization using a Knoevenagel condensation model reaction [30].
Protocol Details:
- Reaction: Condensation of salicylic aldehyde and ethyl acetoacetate to form 3-acetyl coumarin, catalyzed by piperidine in ethyl acetate [30].
- Setup: An Ehrfeld microreactor system (MMRS) mixes reactant streams. The outflow is diluted with acetone/DCM and directed through the NMR flow cell [30].
- NMR Monitoring: The Spinsolve Ultra (80 MHz) operates in external control mode. A quantitative 1D EXTENDED+ protocol is used (4 scans, 6.55 s acquisition, 15 s repetition delay, 90° pulse). Measurements are triggered automatically until a steady state is reached (three consecutive stable readings) [30].
- Optimization Algorithm: A Bayesian algorithm in HiTec Zang's LabVision software adjusts the flow rates of the two reactant feeds (affecting both ratio and residence time) based on the NMR-measured yield. The system performed 30 iterations autonomously, achieving a maximum yield of 59.9% by balancing exploration of new conditions and exploitation of promising regions [30].
Calculation of Conversion and Yield:
- The aromatic proton integral (6.6-8.10 ppm, 4H) served as a constant reference (R).
- Aldehyde proton from salicylaldehyde (S1: 9.90-10.20 ppm).
- Olefinic proton from 3-acetyl coumarin (S2: 8.46-8.71 ppm).
- Conversion = (1 - S1/R) × 100%
- Yield = (S2/R) × 100% [30]
Automated Reaction Monitoring with Molecular Rotational Resonance (MRR)
As a comparative technique, an automated MRR spectroscopy system was developed for reaction monitoring, highlighting an alternative to NMR and MS [32].
Protocol Details:
- Interface: Uses a six-port valve with a 5 μL sample loop. A peristaltic pump circulates reaction mixture. Upon valve switching, the loop contents are dispensed into a heated inlet (up to 130°C) volatilized in neon carrier gas [32].
- Reactions Monitored:
- Imine formation between aniline and 4-fluorobenzaldehyde.
- Deuterium exchange in ethyl acetoacetate via keto-enol tautomerization in methanol-d4 [32].
- Analysis: The targeted IsoMRR spectrometer measures specific rotational transitions. The system provided kinetic data and determined reaction completion, demonstrating particular sensitivity for isotopic variants [32].
Workflow and System Diagrams
Automated MRR Reaction Monitoring Workflow
Self-Optimizing Flow Reactor with Online NMR
Essential Research Reagent Solutions
Table 3: Key Reagents and Materials for Automated NMR Workflows
| Reagent/Material | Function/Application | Example from Research |
|---|---|---|
| Deuterated Solvents (e.g., D₂O, CD₃CN) | Reduces solvent proton interference in NMR spectra; used in mobile phase or for sample dilution [4]. | Used in LC-MS-NMR to minimize strong solvent signals that overwhelm analyte signals [4]. |
| 1.7 mm NMR Tubes | Enables analysis with limited material by reducing sample volume requirements. | Used in Pfizer's high-throughput workflow to obtain spectra from ~10 μg of material [27]. |
| NMR Flow Cells | Allows continuous real-time monitoring of reactions in flow chemistry systems. | Integrated with the Spinsolve Ultra and X-Pulse benchtop NMR systems for online reaction monitoring [30] [31]. |
| Automated Liquid Handlers (e.g., Tecan) | Precisely reformats samples, adds solvents, and rescues "dead volume" for NMR analysis. | Tecan systems used to prepare NMR samples from purification dead volume and reformat compounds into DMSO [27]. |
| Cryoprobes & Microcoils | Enhance NMR sensitivity, reducing the amount of compound required for analysis. | Microcoil probes with active volumes as low as 1.5 μL increase concentration and signal [4]. |
| Bayesian Optimization Software | Algorithmically determines the next set of reaction conditions to test based on analytical feedback. | HiTec Zang's LabVision software used to maximize yield in the Knoevenagel condensation [30]. |
Automated online NMR has established itself as a powerful technique for reaction monitoring and optimization, offering unique strengths in structural elucidation and isomer differentiation that complement the high sensitivity and speed of UPLC-MS. The experimental data and protocols presented demonstrate that the choice between these techniques is not a matter of superiority but of strategic application. UPLC-MS excels in high-speed, high-sensitivity quantitative analysis, while online NMR provides definitive structural verification and insight into reaction pathways, even distinguishing between isotopic labels and isomers. The integration of both techniques within automated workflows, as exemplified by Pfizer's high-throughput platform and the self-optimizing flow reactor, represents the future of analytical-driven research and development in pharmaceuticals and chemical synthesis. As benchtop NMR technology advances and automation solutions become more sophisticated, online NMR is poised to become as integral to high-throughput analysis as LC-MS is today [27].
High-Throughput Targeted Metabolomics using UPLC-TQ-MS/MS
Targeted metabolomics has emerged as a powerful quantitative approach for comprehensive assessment of metabolic phenotypes in biological systems, providing critical insights into physiological and pathological mechanisms [33]. Unlike untargeted methods that aim to broadly profile metabolites, targeted metabolomics focuses on precise quantification of specific metabolites with enhanced accuracy, reproducibility, and robustness—attributes essential for clinical research and drug development [33]. The integration of ultra-performance liquid chromatography (UPLC) with tandem quadrupole mass spectrometry (TQ-MS/MS) represents a technological advancement that enables high-throughput, sensitive, and selective analysis of hundreds of metabolites in complex biological matrices [34].
Within the framework of analytical technique validation, comparing orthogonal technologies is crucial for establishing comprehensive quality assurance protocols. While UPLC-TQ-MS/MS provides exceptional sensitivity and throughput for quantitative analysis, nuclear magnetic resonance (NMR) spectroscopy offers definitive structural characterization capabilities without destruction of the sample [4]. This comparison is particularly relevant in automated research environments where the complementarity of these techniques can be leveraged to enhance analytical rigor while maintaining efficiency.
Fundamentals of UPLC-TQ-MS/MS Technology
System Components and Principles
UPLC-TQ-MS/MS combines three complementary technologies that together enable high-performance metabolite analysis:
UPLC (Ultra-Performance Liquid Chromatography): Utilizes sub-2μm particles and high-pressure systems (typically >15,000 psi) to achieve superior chromatographic resolution, increased sensitivity, and reduced analysis times compared to conventional HPLC. The enhanced separation efficiency minimizes ion suppression in MS detection by reducing co-elution of analytes [33].
Tandem Quadrupole Mass Spectrometry: Employs two quadrupole mass analyzers separated by a collision cell. The first quadrupole (Q1) selects precursor ions of specific mass-to-charge (m/z) ratios, which are then fragmented in the collision cell. The second quadrupole (Q3) transmits specific product ions for detection. This configuration provides exceptional selectivity and sensitivity for targeted analysis [34].
Multiple Reaction Monitoring (MRM): The primary acquisition mode for targeted metabolomics, MRM monitors specific precursor-product ion transitions for each metabolite. This dual filtering approach significantly reduces background noise, enhances signal-to-noise ratios, and enables confident compound identification and quantification even in complex matrices [34] [33].
Experimental Design Considerations
Effective targeted metabolomics studies require careful experimental design to account for the dynamic nature of metabolomes, which are influenced by genetic, environmental, and physiological factors [33]. Key considerations include:
- Sample Population Selection: Appropriate control groups and minimization of confounding factors (medications, comorbidities)
- Study Design: Cross-sectional designs for diagnostic biomarker discovery versus longitudinal designs for therapeutic monitoring
- Sample Size: Adequate statistical power for detecting metabolomic differences
- Quality Control: Implementation of standardized protocols throughout the workflow [33]
Experimental Protocols for UPLC-TQ-MS/MS
Sample Preparation and Metabolite Extraction
Proper sample preparation is critical for reliable metabolomic data. The following protocol has been optimized for plant and mammalian tissue samples [34] [35]:
Table 1: Sample Preparation Steps for Targeted Metabolomics
| Step | Procedure | Key Considerations |
|---|---|---|
| Quenching | Flash-freezing in liquid N₂ or chilled methanol (-20°C to -80°C) | Performed immediately after collection to halt metabolic activity |
| Homogenization | Mechanical disruption in appropriate extraction solvent | Maintains temperature control to prevent metabolite degradation |
| Metabolite Extraction | Biphasic system: methanol/chloroform/water (typical ratios: 1:1:1 or 2:1:1) | Polar metabolites partition to methanol phase, lipids to chloroform phase |
| Protein Precipitation | Centrifugation at 14,000×g for 15 minutes at 4°C | Removes interfering proteins and particulates |
| Internal Standard Addition | Stable isotope-labeled analogs added prior to extraction | Corrects for variability in extraction and matrix effects |
For comprehensive metabolite coverage, the biphasic extraction system using methanol-chloroform-water is widely employed. Methanol effectively extracts polar metabolites while chloroform recovers non-polar compounds (lipids) [35]. The addition of internal standards before extraction is essential for accurate quantification, as it compensates for variations in extraction efficiency and matrix effects [35].
UPLC-TQ-MS/MS Analysis Parameters
The established analytical conditions for widely-targeted metabolomics are summarized below [34]:
Table 2: Typical UPLC-TQ-MS/MS Instrument Parameters
| Parameter | Configuration | Purpose |
|---|---|---|
| UPLC Column | C18 reversed-phase (1.7-1.8 μm particles) | High-resolution separation of metabolites |
| Mobile Phase | A: 0.1% formic acid in water; B: 0.1% formic acid in acetonitrile | Optimal ionization and chromatographic separation |
| Gradient | 3-20 minute linear or step gradients | Balance between throughput and resolution |
| Flow Rate | 0.3-0.4 mL/min | Compatible with MS interface requirements |
| Ionization Mode | ESI positive/negative switching | Broad metabolite coverage |
| MRM Transitions | Optimized for 500+ metabolites | Selective and sensitive quantification |
The MRM conditions must be experimentally optimized for each metabolite by flow injection analysis of authentic standards. This process determines the optimal precursor ion, product ion, and collision energy for maximum sensitivity and selectivity [34]. In a comprehensive method development study, researchers successfully optimized MRM conditions for 497 compounds from a library of 860 authentic standards, generating 61,920 spectra in the process [34].
Comparative Analytical Performance: UPLC-MS vs. NMR
Technical Capabilities and Limitations
UPLC-TQ-MS/MS and NMR provide complementary analytical capabilities with distinct strengths and limitations:
Table 3: Analytical Technique Comparison: UPLC-MS vs. NMR
| Parameter | UPLC-TQ-MS/MS | NMR |
|---|---|---|
| Sensitivity | Femtomole to picomole range [4] | Micromole range (typically 10-100 μg) [4] |
| Throughput | High (minutes per sample) [34] | Low (minutes to hours per 1D spectrum) [4] |
| Structural Information | Limited (molecular mass, fragmentation patterns) [4] | Comprehensive (atomic connectivity, stereochemistry) [4] |
| Quantitation | Relative and absolute with standards [33] | inherently quantitative without standards [4] |
| Sample Destruction | Destructive | Non-destructive [4] |
| Isomer Differentiation | Limited capability [4] | Excellent for positional isomers, stereoisomers [4] |
| Matrix Effects | Susceptible to ion suppression [4] | Minimal matrix interference [4] |
Method Validation Parameters
Comprehensive validation of UPLC-TQ-MS/MS methods should assess multiple performance characteristics:
Table 4: Validation Parameters for Targeted Metabolomics
| Validation Parameter | Acceptance Criteria | Experimental Approach |
|---|---|---|
| Linearity | R² ≥ 0.99 [21] | Calibration curves across expected concentration range |
| Precision | RSD ≤ 15% (intra-day and inter-day) [21] | Repeated analysis of QC samples |
| Accuracy | 85-115% recovery [21] | Spike-recovery experiments with authentic standards |
| Limit of Detection | Signal-to-noise ≥ 3:1 | Serial dilution of standards |
| Limit of Quantification | Signal-to-noise ≥ 10:1 with precision ≤20% RSD | Serial dilution of standards |
| Specificity | No interference from matrix components | Analysis of blank matrix samples |
Applications and Case Studies
Plant Metabolomics and Chemotyping
In a landmark study applying UPLC-TQ-MS/MS for comparative metabolomics, researchers analyzed 14 plant accessions from Brassicaceae, Gramineae, and Fabaceae families [34]. The methodology enabled quantification of approximately 100 metabolites in each sample, with hierarchical cluster analysis clearly distinguishing plant families based on metabolite accumulation patterns. Family-specific metabolites were identified using batch-learning self-organizing map analysis, demonstrating the utility of UPLC-TQ-MS/MS for chemotaxonomic classification and biomarker discovery [34].
Similarly, in cultivar discrimination of Artemisia argyi (Qiai), UPLC-MS-based metabolomics identified 12 chemical markers that distinguished four different cultivars [36]. Five of these markers were subsequently quantified using UPLC-TQ-MS/MS for more accurate content determination, highlighting the complementary nature of untargeted screening and targeted quantification approaches [36].
Clinical Biomarker Discovery
Targeted metabolomics has demonstrated significant utility in clinical research for identifying diagnostic and prognostic biomarkers. In a large-scale study analyzing serum from 1,448 individuals across six centers, researchers identified phenylalanyl-tryptophan and glycocholate as promising biomarkers for early detection of hepatocellular carcinoma [33]. Similarly, targeted analysis of 186 metabolites in plasma samples collected up to 14 years before diagnosis revealed 28 metabolites associated with liver cancer risk, implicating pathways in primary bile acid biosynthesis and phenylalanine, tyrosine, and tryptophan biosynthesis [33].
Integrated Workflows: Combining UPLC-MS and NMR
Automated Structure Verification
The pharmaceutical industry has developed integrated approaches that leverage the complementary strengths of UPLC-MS and NMR for automated structure verification. Sanofi partnered with ACD/Labs to develop an automated tool combining LC/MS and ¹H NMR to efficiently verify structures proposed by organic chemists [29]. This system collects, compiles, and evaluates analytical data automatically, sending results directly to the chemist, thereby streamlining the characterization process.
Similarly, Pfizer implemented an automated purification workflow coupled with MS and NMR that processes 36,000 compounds yearly [27]. This innovative approach generates 1.7 mm NMR samples from "dead volume" that is typically inaccessible during conventional liquid handling, obtaining quality NMR spectra from as little as 10 μg of material without consuming material prioritized for biological assays [27].
Hybrid Analytical Approaches
Several technological approaches have been developed to integrate LC-MS and NMR:
- Online LC-MS-NMR: Direct hyphenation for analysis of highly concentrated analytes (LODs ~10 μg) [4]
- Stop-flow LC-MS-NMR: Compromise approach where chromatographic flow is stopped to acquire NMR data [4]
- LC-MS-SPE-NMR: Solid-phase extraction for concentration and solvent exchange before NMR analysis [4]
- Loop collection: Intermediate storage of LC peaks for subsequent NMR analysis [4]
- Offline NMR: Complete separation of MS and NMR analyses with manual sample transfer [4]
The integration of these techniques is challenging due to differing solvent requirements, with NMR benefiting from deuterated solvents that are cost-prohibitive for routine LC mobile phases [4].
Essential Research Reagents and Materials
Table 5: Key Research Reagent Solutions for UPLC-TQ-MS/MS
| Reagent/Material | Function | Application Notes |
|---|---|---|
| Authentic Standards | Method development, quantification | Library of 500+ compounds recommended [34] |
| Stable Isotope-Labeled Internal Standards | Quantification normalization | Correct for matrix effects and recovery variations [35] |
| LC-MS Grade Solvents | Mobile phase preparation | Minimize background contamination and ion suppression |
| Methanol/Chloroform Extraction System | Metabolite extraction | Biphasic system for comprehensive metabolite recovery [35] |
| Formic Acid/Ammonium Acetate | Mobile phase additives | Enhance ionization and chromatographic separation [21] |
| Quality Control Pools | System monitoring | Quality assurance throughout analytical batches [33] |
Workflow Visualization
Targeted Metabolomics Workflow with NMR Validation
UPLC-TQ-MS/MS has established itself as a cornerstone technology for high-throughput targeted metabolomics, providing unparalleled sensitivity, selectivity, and quantitative capability for profiling hundreds of metabolites in complex biological samples. The technique enables robust comparative metabolomics studies with applications spanning plant chemotyping, clinical biomarker discovery, and drug development.
When positioned within the broader context of analytical technique validation, UPLC-TQ-MS/MS and NMR spectroscopy emerge as fundamentally complementary rather than competitive technologies. While UPLC-TQ-MS/MS excels at sensitive quantification of known metabolites in high-throughput workflows, NMR provides definitive structural characterization capabilities that are essential for identifying unknown compounds and validating structural assignments.
The ongoing development of integrated and automated workflows that combine these orthogonal techniques represents the future of comprehensive metabolomic analysis, particularly in regulated environments such as pharmaceutical development where both throughput and analytical rigor are paramount. As both technologies continue to advance—with improvements in MS sensitivity and NMR throughput—their synergistic application will further enhance our ability to comprehensively characterize complex metabolomes in biological and clinical research.
Combined LC/MS and NMR for Automated Structure Verification
The unambiguous verification of chemical structures is a critical step in drug discovery and development. Incorrectly characterized compounds can derail structure-activity relationship studies, waste resources, and jeopardize intellectual property [37]. While Ultra-Performance Liquid Chromatography-Mass Spectrometry (UPLC-MS) and Nuclear Magnetic Resonance (NMR) spectroscopy are foundational analytical techniques, each has intrinsic limitations when used in isolation. This guide compares their performance within the context of automated structure verification (ASV), arguing that a combined LC/MS and NMR approach is superior for ensuring analytical rigor and accelerating research workflows [4] [10].
Performance Comparison: UPLC-MS vs. NMR
The table below summarizes the complementary strengths and limitations of UPLC-MS and NMR spectroscopy, which form the basis for their synergistic integration in automated platforms.
Table 1: Comparative Analysis of UPLC-MS and NMR for Structure Verification
| Aspect | UPLC-MS | NMR | Implication for Combined ASV |
|---|---|---|---|
| Primary Strength | Exceptional sensitivity (femtomole range) [4]; High throughput. | Provides definitive structural and stereochemical information; Distinguishes isomers [4] [27]. | MS quickly identifies target peaks; NMR confirms identity and isomeric purity. |
| Key Limitation | Cannot reliably distinguish isobaric compounds or positional isomers [4] [27]. | Inherently low sensitivity (microgram level required) [4]; Longer acquisition times. | Automation focuses NMR on MS-identified peaks, optimizing use of instrument time and sample. |
| Quantitation | Can be challenged by ion suppression and matrix effects [4] [10]. | Inherently quantitative and immune to matrix effects [4]. | NMR provides a reliable quantitative check on MS-based purity assessments. |
| Sample Throughput in Automation | Very high (analysis in seconds) [4]. | Lower, but accelerated by automation (e.g., flow probes, automated sampling) [27]. | Workflow automation queues NMR analysis based on MS results, maximizing overall efficiency. |
| Data for Structure Verification | Molecular weight, formula (via exact mass), fragmentation patterns [4]. | Atomic connectivity, functional group environment, stereochemistry [4]. | Combined dataset provides a multi-parameter verification that is more robust than either technique alone. |
| Role in Automated Workflows | Ideal for initial screening, purity assessment, and triggering downstream NMR analysis [27]. | Essential for final confirmation of structure, especially for novel compounds or isomers [27] [38]. | Automated systems compile data from both techniques for a unified verification report [29]. |
Experimental Protocols for Automated Verification
The implementation of combined LC/MS-NMR ASV relies on standardized, high-throughput protocols. Below are detailed methodologies from key research.
Protocol 1: Integrated Purification and Microscale NMR Sample Generation
This protocol, developed for parallel medicinal chemistry, demonstrates a fully automated workflow from synthesis to structure verification [27].
- Compound Submission: Samples are submitted via a Laboratory Information Management System (LIMS) and categorized by scale: Traditional (10–100 mg), Analytical (>1–10 mg), or Micro (0.03–1 mg).
- UPLC-MS Purification & Analysis: An automated UPLC-MS system purifies compounds using mass- or UV-triggered fraction collection. Purity is assessed inline, and the concentration of the primary DMSO stock for biological assays is determined.
- NMR Sample Recovery from Dead Volume: Instead of discarding the inaccessible liquid handler dead volume (~10-25 µL), a Tecan liquid handler automatically dilutes it with deuterated solvent.
- Microcoil NMR Acquisition: The diluted sample is transferred to a 1.7 mm microcoil NMR tube. This probe's small active volume (1.5 µL) increases effective concentration, enabling quality ¹H NMR spectra from as little as 10 µg of compound [4] [27].
- Automated Data Processing & Verification: Spectra are automatically processed, analyzed, and compared to the predicted spectrum of the expected structure. Results are compiled and reported via the LIMS.
Protocol 2: Automated LC/MS and ¹H NMR Data Evaluation
This protocol outlines the software-driven verification process piloted by Sanofi and ACD/Labs [29] [38].
- Data Collection and Compilation: Upon synthesis, proposed structures and raw analytical data (LC/MS and ¹H NMR) are uploaded to a centralized system.
- Automated Processing and Prediction: Software automatically processes the spectra. For the proposed structure, it predicts the corresponding ¹H NMR spectrum and isotopic MS pattern.
- Consistency Evaluation: The system calculates match factors (e.g., NMR match factor, MS match factor) by comparing experimental data with predictions [38].
- Result Flagging and Reporting: Results are automatically evaluated. Compounds with consistent data are approved. Those with missing data or poor match factors are flagged for chemist review, with all relevant data compiled in a single report.
Workflow and Relationship Diagrams
Diagram 1: Automated Combined LC/MS-NMR Verification Workflow
Title: Automated workflow integrating purification, MS, NMR, and software verification.
Diagram 2: Complementary Role of MS and NMR in Verification
Title: Complementary data from MS and NMR converge for definitive verification.
The Scientist's Toolkit: Key Reagents & Solutions
Table 2: Essential Research Reagents and Materials for Combined ASV Workflows
| Item | Function in Workflow | Key Detail / Rationale |
|---|---|---|
| Deuterated Solvents (e.g., DMSO‑d₆, CD₃OD, D₂O) | Solvent for NMR acquisition; used in sample preparation for compatibility. | Reduces overwhelming solvent proton signals in NMR. D₂O is cost-effective for aqueous phases [4]. |
| Deuterated NMR Buffers | Provides pH control for biofluid metabolomics samples analyzed by both NMR and MS. | Recent protocols show specific buffers do not cause unwanted deuterium incorporation and are MS-compatible [39]. |
| Microcoil NMR Probes (e.g., 1.7 mm) | Enables NMR data acquisition on limited material. | Small active volume (~1.5 µL) concentrates analyte, significantly improving sensitivity for sub-milligram samples [4] [27]. |
| Cryogenically Cooled NMR Probes (Cryoprobes) | Increases sensitivity for standard tube sizes (e.g., 5 mm). | Reduces electronic noise, offering a 2- to 4-fold signal-to-noise improvement, enabling faster analysis or use of less material [4]. |
| Automated Liquid Handlers (e.g., Tecan) | Prepares NMR samples from purification dead volume or reformats samples. | Critical for high-throughput, reproducible recovery of trace samples without manual intervention [27]. |
| ASV Software Suites (e.g., ACD/Labs) | Automates data processing, spectral prediction, and consistency evaluation. | Compiles multi-technique data, calculates match factors, flags discrepancies, and suggests alternative structures [29] [38]. |
| Laboratory Information Management System (LIMS) | Tracks samples, manages workflow logic, and compiles final reports. | The digital backbone that integrates disparate automated instruments and data streams into a coherent process [27]. |
| Molecular Weight Cut-off (MWCO) Filters | Removes proteins from biofluid samples prior to LC-MS analysis in metabolomics. | Essential for MS compatibility; protocols are optimized to allow the same filtrate to be used for subsequent NMR analysis [39]. |
| 24-Methylpentacosanoyl-CoA | 24-Methylpentacosanoyl-CoA, MF:C47H82N7O17P3S-4, MW:1142.2 g/mol | Chemical Reagent |
| Acetyl-D-carnitine chloride | Acetyl-D-carnitine chloride, MF:C9H16ClNO3, MW:221.68 g/mol | Chemical Reagent |
The validation of analytical techniques in automated research environments underscores that neither UPLC-MS nor NMR is sufficient alone for high-confidence structure verification. UPLC-MS excels as a rapid, sensitive filter for identity and purity, while NMR delivers the definitive structural proof [4] [10]. The experimental data and protocols presented demonstrate that automation is the critical link that combines these techniques practically, overcoming NMR's throughput and sensitivity barriers [27]. By implementing integrated workflows—leveraging microsampling, intelligent software, and streamlined sample handling—research teams can achieve a superior standard of analytical verification. This robust, combined approach de-risks the drug discovery pipeline and enhances the integrity of scientific data [37] [38].
Dereplication and Bioactivity Screening in Natural Products
Dereplication is a critical early stage in the natural product (NP) discovery pipeline, defined as "a process of quickly identifying known chemotypes" to prioritize novel compounds for isolation [40]. This process has evolved into distinct workflows tailored to different objectives, ranging from the rapid identification of major compounds in a single sample to targeted identification of predetermined metabolite classes or untargeted chemical profiling of extensive extract collections [40]. In modern drug discovery pipelines, dereplication serves as an essential quality control gate, preventing redundant investment of resources in the rediscovery of known compounds, such as common antibiotics or ubiquitous metabolites. The acceleration of dereplication processes has become increasingly vital in bioactivity-guided fractionation procedures, where rapid chemical identification determines the pace of downstream isolation efforts [40].
The fundamental challenge in dereplication stems from the immense chemical diversity present in natural sources. With over 400,000 non-redundant natural compounds cataloged in open collections alone, the ability to efficiently navigate this chemical space dictates the success rate of novel bioactive compound discovery [41] [42]. Contemporary dereplication strategies must therefore balance comprehensiveness with speed, leveraging advanced analytical technologies to maximize the probability of identifying truly novel chemotypes with desirable bioactivities. Within this context, the selection of appropriate analytical platforms—primarily Ultra-Performance Liquid Chromatography-Mass Spectrometry (UPLC-MS) and Nuclear Magnetic Resonance (NMR) spectroscopy—represents a critical strategic decision that directly influences the efficiency and reliability of the dereplication process.
Fundamental Principles of UPLC-MS and NMR
Technical Foundations and Operational Mechanisms
UPLC-MS combines the superior chromatographic separation power of ultra-performance liquid chromatography with the detection and identification capabilities of mass spectrometry. The UPLC component utilizes columns packed with smaller particles (typically below 2μm) and higher pressure systems compared to conventional HPLC, resulting in improved resolution, sensitivity, and speed [43]. This separation is coupled to mass spectrometry, where electrospray ionization (ESI) converts analytes into gas-phase ions, which are then separated based on their mass-to-charge ratio (m/z) [4]. Tandem mass spectrometry (MS/MS) provides additional structural information through controlled fragmentation patterns, enabling partial structural characterization [4]. The limits of detection for UPLC-MS are exceptionally low, comfortably in the femtomole range for compounds with high ionization efficiency, making it ideal for detecting minor metabolites in complex biological mixtures [4].
NMR spectroscopy operates on fundamentally different principles, exploiting the magnetic properties of certain atomic nuclei (primarily ¹H, ¹³C, ¹â¹F, and ³¹P) when placed in a strong magnetic field [4]. The resonant frequency of these nuclei—their chemical shift—provides detailed information about their local electronic environment, while coupling constants reveal connectivity through bonds. Multi-dimensional NMR experiments (such as COSY, HSQC, and HMBC) establish atomic connectivity through space and bonds, enabling complete structural elucidation, including relative configuration [4]. Unlike MS, NMR is inherently quantitative and non-destructive, allowing sample recovery for further analysis [4] [26]. However, NMR suffers from relatively low sensitivity, requiring microgram quantities of material and longer acquisition times, particularly for 2D experiments that are essential for full structural characterization [4].
Comparative Performance Characteristics
Table 1: Fundamental Comparison of UPLC-MS and NMR Technologies
| Parameter | UPLC-MS | NMR |
|---|---|---|
| Detection Limit | Femtomole range (10â»Â¹Â³ mol) [4] | Microgram range (10â»â¹ mol) [4] |
| Throughput | High (minutes per sample) [4] | Low (minutes to hours per sample) [4] |
| Quantitation | Semi-quantitative (subject to ionization suppression) [4] | inherently quantitative [4] |
| Structural Elucidation | Partial (molecular formula, fragmentation patterns) [4] | Complete (atomic connectivity, stereochemistry) [4] |
| Sample Preservation | Destructive [26] | Non-destructive [4] [26] |
| Isomer Differentiation | Limited [4] | Excellent [4] |
| Metabolite Coverage | 300-1000+ metabolites [7] | 30-100 metabolites [7] |
The complementary nature of these techniques is evident from their contrasting capabilities. While UPLC-MS provides exceptional sensitivity for detecting a wide range of metabolites, NMR offers definitive structural information that is largely independent of reference standards [4]. This fundamental complementarity has driven the development of integrated approaches that leverage the strengths of both platforms for comprehensive metabolomic analysis and dereplication [26].
Experimental Design for Technique Comparison
Standardized Sample Preparation Protocols
Methodologically rigorous comparison of UPLC-MS and NMR performance in dereplication requires standardized sample preparation to ensure analytical consistency. For microbial natural product extracts, a validated protocol involves cultivation in appropriate media (e.g., ISP-2 for actinomycetes), followed by extraction with equal volumes of organic solvents such as ethyl acetate or methanol [43]. The organic phase is then concentrated under reduced vacuum and residues are re-dissolved in methanol to a standardized concentration (typically 10 mg/mL) for analysis [43]. For plant material, lyophilization followed by powdered extraction with methanol (1:10 w/v) using ultrasonication for 30 minutes ensures comprehensive metabolite extraction [40]. All samples should include quality control (QC) pools created by combining equal aliquots of each test sample to monitor instrument performance throughout the analytical sequence [44].
Sample preparation specifically tailored for integrated UPLC-MS/NMR analysis requires additional considerations, particularly regarding solvent compatibility. For reversed-phase UPLC separation, the mobile phase typically consists of acetonitrile or methanol as the organic modifier, with water as the aqueous component [4]. When coupling directly to NMR, deuterated solvents are preferable to reduce interference from strong solvent signals that can overwhelm analyte resonances [4]. While fully deuterated mobile phases can be cost-prohibitive, using deuterated water (Dâ‚‚O) for the aqueous phase significantly improves NMR data quality without excessive expense [4]. The slight retention time shifts caused by deuterium isotope effects must be accounted for when correlating MS and NMR data.
Data Acquisition Parameters
UPLC-MS analysis should be performed using a system equipped with a C18 reversed-phase column (1.7μm particle size, 2.1 × 100 mm) maintained at 40°C [44]. The mobile phase typically consists of water (A) and acetonitrile (B), both containing 0.1% formic acid, with a gradient elution from 5% to 100% B over 15-20 minutes at a flow rate of 0.4 mL/min [44]. Mass spectrometry detection should include both positive and negative ionization modes with a mass range of m/z 50-1500, with data-dependent MS/MS fragmentation triggered on the most intense ions [43].
NMR spectroscopy requires a high-field spectrometer (≥600 MHz) for optimal resolution in complex mixture analysis [44]. Sample analysis is typically performed using 1D ¹H NMR experiments with water signal suppression, such as the standard 1D NOESY-presat pulse sequence [44]. Key parameters include: 32 scans, 10 ms mixing time, 96k data points, and a relaxation delay of 4 seconds, with the probe temperature maintained at 310K [44]. For additional structural information, 2D experiments such as ¹H-¹³C HSQC and ¹H-¹H COSY can be employed, though these require significantly longer acquisition times (minutes to hours) [4].
Data Processing and Analysis Workflows
UPLC-MS data processing typically involves peak picking, alignment, and deisotoping using specialized software such as XCMS or MZmine, resulting in a feature table containing m/z, retention time, and intensity for each detected ion [43]. Dereplication then proceeds by searching these features against natural product databases, with MS/MS spectral matching providing additional confidence in annotation [40].
NMR data processing includes Fourier transformation, phase correction, and baseline correction, followed by spectral binning (typically 0.01-0.04 ppm buckets) to compensate for small shifts in peak position [44]. Probabilistic quotient normalization is often applied to account for concentration variations [44]. For dereplication, ¹H NMR spectra are compared against reference libraries, with chemical shift, multiplicity, and integration pattern serving as identification criteria [40].
Table 2: Experimental Protocols for Comparative Analysis
| Experimental Step | UPLC-MS Parameters | NMR Parameters |
|---|---|---|
| Sample Volume | 1-10 μL (extract dependent) | 300-600 μL [44] |
| Separation/Detection | C18 column (1.7μm, 2.1×100mm); A: H₂O + 0.1% FA, B: ACN + 0.1% FA; 0.4 mL/min [44] | 600 MHz spectrometer; 5 mm PATXI probe [44] |
| Key Acquisition Settings | ESI ± mode; m/z 50-1500; data-dependent MS/MS [43] | 1D NOESY-presat; 32 scans; 10 ms mixing time; 4 s relaxation delay [44] |
| Analysis Time | ~20 minutes per sample [44] | ~10 minutes per sample (1D ¹H) [44] |
| Data Output | m/z, retention time, MS/MS fragmentation patterns [4] | Chemical shift, multiplicity, J-coupling, integration [4] |
Performance Benchmarking in Dereplication
Critical Performance Metrics for Dereplication
The effectiveness of analytical techniques in dereplication can be evaluated through several key performance indicators. Sensitivity determines the ability to detect minor metabolites that may represent novel chemotypes present in low abundance. Analytical Speed directly impacts throughput and determines how quickly large extract libraries can be processed. Annotation Confidence reflects the reliability of compound identifications, reducing false positives and negatives. Chemical Coverage defines the range of metabolite classes that can be detected, which varies significantly between techniques due to differences in detection principles [7].
Benchmarking studies consistently demonstrate that UPLC-MS detects a significantly larger number of molecular features (typically 300-1000+ metabolites per run) compared to NMR (typically 30-100 metabolites) [7]. However, this numerical advantage in feature detection does not necessarily translate to superior dereplication performance, as many MS-detected features may represent isotopes, adducts, or fragmentation products of the same metabolites, and confident identification requires comparison with authentic standards [4]. NMR, while detecting fewer compounds overall, provides substantially higher confidence in identifications through direct structural information that can distinguish isobaric compounds and positional isomers without reference standards [4].
Experimental Data from Comparative Studies
In a comprehensive study comparing serum and plasma metabolites using both techniques, NMR analyses successfully discriminated sample types based on lipoproteins, lipids in VLDL/LDL, lactate, glutamine, and glucose [44]. Simultaneously, UPLC-MS analyses identified more specific lipid biomarkers, including lysophosphatidylethanolamine (lysoPE)(18:0) and lysophosphatidic acid(20:0) that were higher in serum, while various phosphatidylcholines and linoleic acid were lower [44]. This study highlighted that UPLC-MS provided higher sensitivity for specific lipid classes, while NMR gave a more robust overview of central carbon metabolism and lipoprotein profiles.
Another investigation focusing on microbial natural products demonstrated that UPLC-MS enabled rapid profiling of fermentation broths, with microfractionation directly linking bioactivity to specific chromatographic peaks [43]. However, complete structural identification of novel compounds still required NMR for unambiguous determination of planar structure and relative stereochemistry [43]. The integration of both techniques created a synergistic workflow where UPLC-MS rapidly prioritized samples containing potentially novel metabolites, which were then fully characterized by NMR.
Table 3: Performance Comparison in Dereplication Applications
| Performance Metric | UPLC-MS | NMR |
|---|---|---|
| Metabolites Detected per Run | 300-1000+ [7] | 30-100 [7] |
| Confidence in Identification | Moderate (requires standards for confirmation) [4] | High (structural elucidation without standards) [4] |
| Isomer Differentiation | Limited [4] | Excellent [4] |
| Reproducibility | Moderate (subject to ionization efficiency variations) [7] | High (excellent quantitative reproducibility) [7] |
| Speed for Initial Profiling | Fast (~20 minutes per sample) [44] | Moderate (~10 minutes for 1D ¹H) [44] |
| Ability to Detect Novel Scaffolds | Limited without prior knowledge | High (structure elucidation of unknowns) [4] |
Integrated Approaches and Data Fusion Strategies
Methodologies for Data Integration
The complementary strengths of UPLC-MS and NMR have driven the development of integrated approaches that leverage both datasets for enhanced metabolomic analysis and dereplication. Data fusion strategies can be classified into three distinct levels based on the stage at which integration occurs [26]. Low-level data fusion involves the direct concatenation of raw or pre-processed data matrices from multiple analytical platforms before statistical analysis [26]. This approach requires extensive data preprocessing to equalize the contributions from each technique, including mean centering or unit variance scaling to prevent dominance by the platform with greater variance [26].
Mid-level data fusion employs dimensionality reduction techniques (such as Principal Component Analysis) separately on each data block before concatenating the extracted features [26]. This strategy effectively addresses the challenge of high dimensionality in UPLC-MS data while preserving the complementary information from both techniques. High-level data fusion combines the results or decisions from models built on individual platforms, such as merging classification results from separate UPLC-MS and NMR models [26]. This approach maintains the integrity of each technique's analytical strengths while providing consolidated biological interpretation.
Implementation in Natural Product Discovery
Practical implementation of these integrated approaches has demonstrated significant value in natural product discovery. In studies of marine organisms and plant extracts, the combination of UPLC-MS and NMR has enabled comprehensive metabolite profiling that exceeds the capabilities of either technique alone [45] [26]. For example, UPLC-MS provides sensitive detection of minor secondary metabolites, while NMR confirms structural features and quantifies major components [26]. This synergistic relationship is particularly valuable in bioactivity-guided fractionation, where rapid UPLC-MS profiling guides fraction selection, while NMR provides structural insights on bioactive constituents.
The technical implementation of integrated approaches often involves either sequential or parallel analysis designs. In sequential designs, UPLC-MS performs initial high-throughput screening to prioritize samples for more detailed NMR characterization [40]. In parallel designs, both analyses are conducted simultaneously, with data fusion enhancing the overall comprehensiveness of metabolite coverage [26]. Recent advances in instrumental coupling, particularly LC-MS-SPE-NMR, where solid-phase extraction traps HPLC peaks for subsequent NMR analysis, have further streamlined integrated workflows for natural product dereplication [4].
Essential Research Reagents and Materials
Table 4: Essential Research Reagents and Resources
| Resource Category | Specific Examples | Function in Dereplication |
|---|---|---|
| Chromatography Columns | C18 reversed-phase (1.7μm, 2.1×100mm) [44] | UPLC separation of complex natural extracts |
| Mass Spectrometry Standards | Leucine enkephalin for mass calibration [43] | Ensuring mass accuracy in UPLC-MS analyses |
| NMR Solvents | Deuterated methanol (CD₃OD), deuterated water (D₂O) [4] | NMR sample preparation with minimal interference |
| NMR Reference Standards | Tetramethylsilane (TMS) or DSS [4] | Chemical shift referencing for reproducible NMR |
| Natural Product Databases | COCONUT, MarinLit, AntiBase, DNP [41] [42] | Reference data for compound identification |
| Quality Control Materials | Pooled sample QC [44] | Monitoring instrument performance throughout runs |
The selection of appropriate reference databases represents a critical resource decision in dereplication workflows. Open-access resources such as COCONUT (COlleCtion of Open NatUral prodUcTs) provide extensive coverage of over 400,000 non-redundant natural compounds, while commercial databases like MarinLit and AntiBase offer highly curated, specialized collections with rich metadata [41] [42]. The Dictionary of Natural Products (DNP) is widely considered the most comprehensive and best-curated resource, though its commercial nature limits accessibility [42]. Strategic selection of database resources should align with the specific focus of the research program—whether broad biodiversity exploration or targeted investigation of specific taxonomic groups.
Implementation in Research Settings
In practical research environments, successful dereplication programs maintain accessible collections of reference standards for both UPLC-MS and NMR validation. For UPLC-MS, this includes both internal standards (added directly to samples) and external standards (analyzed separately) for retention time alignment and mass accuracy calibration [43]. For NMR, chemical shift reference compounds are essential for reproducible data acquisition across multiple analytical sessions [4]. Additionally, quality control materials—typically pooled samples representing the diversity of extracts under investigation—should be analyzed at regular intervals throughout analytical sequences to monitor instrument stability and data quality [44].
The integration of specialized software tools has become increasingly important for efficient dereplication. Molecular networking platforms, which visualize the chemical relationships between compounds based on MS/MS fragmentation patterns, have emerged as powerful tools for grouping related metabolites and prioritizing novel chemical families for isolation [45]. Similarly, automated structure elucidation software assists in interpreting complex NMR datasets, reducing the time required for structural determination of unknown compounds [45]. These computational resources complement the analytical techniques, accelerating the transition from raw data to confident compound identification.
The comparative analysis of UPLC-MS and NMR for dereplication and bioactivity screening reveals a fundamentally complementary relationship between these analytical techniques rather than a competitive one. UPLC-MS excels in rapid profiling of complex mixtures with high sensitivity, enabling high-throughput screening of large natural product libraries [7]. Its strengths lie in detecting minor metabolites, providing molecular formula information through exact mass measurement, and generating fragmentation patterns that facilitate compound classification [4]. Conversely, NMR provides definitive structural information, including stereochemistry and isomer differentiation, with minimal requirement for reference standards [4]. Its quantitative nature and reproducibility make it invaluable for comprehensive metabolomic characterization, despite limitations in sensitivity [7].
Strategic selection between these techniques should be guided by the specific objectives and stage of the natural product discovery pipeline. For primary screening of large extract libraries, UPLC-MS provides unmatched speed and sensitivity [7]. When pursuing bioactivity-guided fractionation, integrated approaches that leverage both techniques offer the optimal balance of efficiency and confidence in compound identification [40]. For complete structural elucidation of novel compounds, particularly those with complex stereochemistry, NMR remains indispensable [4]. Future advances in instrumental sensitivity, particularly in NMR spectroscopy through cryoprobes and microcoil technologies, promise to further enhance the complementary relationship between these techniques [4]. Similarly, developments in data fusion methodologies and computational approaches for automated data interpretation will continue to streamline dereplication workflows, accelerating the discovery of novel bioactive natural products for drug development [45] [26].
Detection of Adulterants and Impurities in Complex Matrices
The detection of adulterants and impurities is a critical challenge in pharmaceutical development and quality control. This guide provides an objective comparison of two leading analytical techniques—Ultra-Performance Liquid Chromatography-Mass Spectrometry (UPLC-MS) and Nuclear Magnetic Resonance (NMR) spectroscopy—within the framework of analytical method validation and automation research. We examine their respective capabilities in identifying and quantifying unknown compounds in complex biological and pharmaceutical matrices, supported by experimental data on sensitivity, structural elucidation power, and validation parameters. The integration of these complementary techniques through data fusion strategies is also explored, offering researchers a comprehensive toolkit for addressing the complex challenges of impurity detection.
In pharmaceutical sciences and metabolomics, the reliable detection of adulterants and impurities within complex matrices such as biofluids, plant extracts, and synthetic mixtures is paramount for ensuring product safety and efficacy [4] [46]. This process demands analytical techniques that provide not only high sensitivity but also unambiguous structural information. Ultra-Performance Liquid Chromatography-Mass Spectrometry (UPLC-MS) and Nuclear Magnetic Resonance (NMR) spectroscopy have emerged as two of the most powerful techniques for this purpose [3] [47]. UPLC-MS offers exceptional sensitivity and the ability to resolve complex mixtures, while NMR provides unparalleled structural elucidation and quantitative capabilities without destruction of the sample [4] [26].
The application of these techniques in a regulated environment requires rigorous analytical method validation to ensure reliability, reproducibility, and compliance with international guidelines such as ICH Q2(R1) [48] [49]. This involves assessing key parameters including accuracy, precision, specificity, and limits of detection and quantification [48]. Furthermore, the trend towards automation in modern laboratories highlights the need for robust, reproducible methods that can be seamlessly integrated into high-throughput workflows [47]. This guide objectively compares the performance of UPLC-MS and NMR in the context of detecting impurities and adulterants, providing validated experimental protocols, comparative data, and insights into their complementary roles in advanced analytical research.
Fundamental Technique Comparison: UPLC-MS vs. NMR
UPLC-MS and NMR operate on fundamentally different physical principles, which directly translates to their distinct strengths and limitations in analytical science. The table below provides a high-level comparison of these two platforms.
Table 1: Fundamental Comparison of UPLC-MS and NMR
| Parameter | UPLC-MS | NMR |
|---|---|---|
| Principle | Separation by chromatography followed by mass-based detection | Measurement of nuclear spin transitions in a magnetic field |
| Sensitivity | High (nanomolar to picomolar) [47] | Low (micromolar) [4] [47] |
| Structural Information | Molecular mass, fragmentation patterns (via MS/MS) | Atomic connectivity, functional groups, isomer distinction [4] |
| Quantitation | Possible, but can be affected by ionization efficiency [47] | Inherently quantitative; signal proportional to nucleus count [4] [47] |
| Sample Throughput | High (minutes per sample) [3] | Moderate to Low (minutes to hours per sample) [4] |
| Sample Recovery | Destructive analysis [47] | Non-destructive; sample can be recovered [4] [47] |
| Reproducibility | Can suffer from matrix effects and ionization suppression [4] | Exceptionally high and reproducible across instruments [47] |
| Key Strength | Sensitivity and ability to handle complex mixtures | Definitive structural elucidation and quantitation |
Key Strengths and Limitations in Practice
- UPLC-MS excels in detecting low-abundance impurities due to its high sensitivity. Its coupling with chromatography effectively reduces sample complexity before detection, minimizing ion suppression [4]. However, a significant limitation is its difficulty in distinguishing isobaric compounds and positional isomers without authentic standards for comparison [4].
- NMR is generally the method of choice when definitive structural characterization is needed. It can easily differentiate between isomers and provides direct information on functional groups and atomic connectivity through chemical shifts and coupling constants [4] [47]. Its primary challenge is inherently low sensitivity, stemming from the small energy difference between nuclear spin states, which requires relatively large amounts of material and longer acquisition times, especially for 2D experiments [4].
Analytical Validation Parameters for UPLC-MS and NMR
For any analytical method to be deployed in a GMP environment or for critical decision-making, it must undergo a rigorous validation process. The International Council for Harmonisation (ICH) guideline Q2(R1) outlines the core parameters for this validation [48] [49]. The application and performance of these parameters differ between UPLC-MS and NMR.
Table 2: Validation Parameters and Performance for UPLC-MS and NMR
| Validation Parameter | Definition | UPLC-MS Performance | NMR Performance |
|---|---|---|---|
| Specificity | Ability to assess analyte unequivocally in the presence of components that may be expected to be present [48] | High with MS/MS; may struggle with isomers [4] | Excellent; directly distinguishes isomers and isobaric compounds [4] |
| Accuracy | Closeness of agreement between the accepted reference value and the value found [48] | High, but can be affected by matrix effects [4] | High; inherently quantitative and less prone to matrix effects [4] [47] |
| Precision | Closeness of agreement between a series of measurements [48] | Good, but requires careful control of ionization conditions | Exceptional inter-instrument and inter-laboratory reproducibility [47] |
| Linearity | Ability to obtain results proportional to analyte concentration [48] | Good over a defined range; response can be non-linear at extremes | Excellent; signal intensity is directly proportional to the number of nuclei [47] |
| LOD/LOQ | Lowest concentration that can be detected/quantified with acceptable accuracy and precision [50] | Very low (nanomolar range) [47] | Higher (micromolar range); improved with cryoprobes and microcoils [4] |
| Robustness | Capacity to remain unaffected by small, deliberate variations in method parameters [48] | Can be sensitive to mobile phase composition, source contamination | Highly robust; results are constant across different instruments and vendors [47] |
Experimental Protocols and Comparative Data
Protocol: UPLC-HRMS for Metabolite Profiling in Urine
A study comparing UPLC-HRMS and direct infusion-MS for metabolic profiling of human urine provides a robust protocol [3].
- Sample Preparation: Thawed urine samples were pipetted in randomized order and diluted 50-fold with ultrapure water. A multianalyte mixture of isotopically labeled internal standards was added to account for matrix effects. A pooled urine sample was used to prepare calibration standards and quality control samples [3].
- Chromatography: Reversed-phase UPLC separation was performed, though the specific column and gradient details are not provided in the excerpt.
- Mass Spectrometry: Analysis was conducted using a high-resolution mass spectrometer (e.g., Synapt G2-S). The method was optimized for simultaneous global metabolic profiling in full-scan mode and quantitative analysis of targeted analytes [3].
- Validation & Results: The method demonstrated strong quantitative capabilities. For a panel of 35 metabolites, 10 showed a strong correlation (Pearson’s r > 0.9) between UPLC-HRMS and a direct infusion method, with good agreement in Bland-Altman plots. The total runtime for the UPLC-HRMS sample set in both positive and negative ionization modes was reported to be 5 days [3].
Protocol: Parallel NMR and LC-MS/MS Analysis of Saliva
A study on saliva metabolomics employed a targeted parallel analysis using both NMR and LC-MS/MS, showcasing a complementary workflow [46].
- Sample Preparation: Saliva samples were collected via unstimulated drooling, paraffin chewing-stimulated spitting, or parotid gland suction. For NMR, samples were ultrafiltered (3 kDa cutoff) to remove proteins. For LC-MS/MS, both filtered and unfiltered samples were analyzed [46].
- NMR Analysis: Filtered saliva samples were analyzed using NMR spectroscopy. The protocol allowed for the identification and quantification of up to 45 metabolites, including differences in metabolite composition between the types of saliva collection methods [46].
- LC-MS/MS Analysis: The targeted LC-MS/MS method was designed to quantify bioactive lipids. The analysis successfully quantified two endocannabinoids and 22 oxylipins, which was noted as the most comprehensive targeted panel for these compounds in human saliva at the time [46].
- Key Finding: The study concluded that the combined use of NMR and LC-MS/MS is viable for clinical studies, with NMR providing robust quantification of soluble metabolites and LC-MS/MS enabling sensitive targeted analysis of low-abundance lipids [46].
Experimental Comparison: Sensitivity and Metabolite Coverage
The inherent difference in sensitivity between the two techniques directly impacts the number of metabolites typically detected in a biological sample.
Table 3: Experimental Comparison of Metabolite Coverage
| Experimental Context | UPLC-MS Performance | NMR Performance |
|---|---|---|
| Typical Metabolomics Study | Can detect 1000+ identified metabolites with concentrations >10-100 nM [47] | Typically identifies 50-200 metabolites with concentrations >1 μM [47] |
| Saliva Analysis | LC-MS/MS quantified 24 bioactive lipids (endocannabinoids & oxylipins) [46] | NMR quantified 45 metabolites in unfiltered saliva [46] |
| Limits of Detection (LOD) | Femtomole range for analytes with high ionization efficiency [4] | Requires minutes to hours at the microgram level for a simple 1D spectrum [4] |
Integrated Workflows and Data Fusion
Given their complementary strengths, UPLC-MS and NMR are increasingly used together in an integrated workflow. A common approach involves using UPLC-MS for initial high-throughput screening and biomarker discovery, followed by NMR for definitive structural identification of key impurities or unknown compounds [4] [26].
To formally combine the data from these platforms, data fusion (DF) strategies are employed in metabolomics. These can be categorized into three levels [26]:
- Low-Level DF: The raw or pre-processed data matrices from NMR and MS are directly concatenated into a single large matrix for multivariate analysis.
- Mid-Level DF: Features are first extracted from each dataset independently (e.g., via PCA). The resulting scores or selected features are then fused into a single matrix for modeling.
- High-Level DF: Separate models are built for each data block (NMR and MS), and their predictions or results are combined at the decision level.
The following diagram illustrates a generalized workflow for the analysis of complex matrices, integrating both UPLC-MS and NMR, and culminating in data fusion.
The Scientist's Toolkit: Essential Research Reagents and Materials
The following table details key reagents, materials, and instruments essential for conducting experiments with UPLC-MS and NMR, as derived from the cited protocols.
Table 4: Essential Research Reagents and Solutions
| Item | Function/Application | Example from Protocol |
|---|---|---|
| Isotopically Labeled Internal Standards | Correct for matrix effects and enable precise quantification in MS. | Used in UPLC-HRMS urinary metabolomics for quantification of 35 metabolites [3]. |
| Deuterated Solvents (e.g., D₂O, CD₃OD) | Provide a signal for the NMR spectrometer lock and minimize solvent interference in ¹H-NMR spectra. | D₂O used in NMR analysis of saliva ultrafiltrate [46]. |
| Ultrafiltration Devices (e.g., 3 kDa cutoff) | Remove proteins and other macromolecules from biofluids for cleaner NMR spectra and to protect LC columns. | Amicon Ultra-0.5 centrifugal filters used for saliva sample preparation prior to NMR [46]. |
| UPLC Columns (C18 phase) | Provide high-resolution chromatographic separation of complex mixtures prior to MS detection. | Phenomenex ODS C18 column used in a QbD-based RP-HPLC method development [51]. |
| Buffers (e.g., Phosphate Buffer) | Control pH in mobile phases (LC) or in NMR samples to ensure consistent chemical shifts. | Phosphate buffer used in the 1H NMR analysis of urine specimens [3]. |
| Cryoprobes/Microcoil Probes | Enhance sensitivity in NMR spectroscopy by reducing electronic noise or increasing sample concentration in the active volume. | Noted as a key strategy to overcome NMR's inherent low sensitivity [4]. |
| 8-Methyltetradecanoyl-CoA | 8-Methyltetradecanoyl-CoA, MF:C36H64N7O17P3S, MW:991.9 g/mol | Chemical Reagent |
| 3,4,5-trihydroxypentanoyl-CoA | 3,4,5-trihydroxypentanoyl-CoA, MF:C26H44N7O20P3S, MW:899.7 g/mol | Chemical Reagent |
UPLC-MS and NMR are powerful yet fundamentally different analytical techniques for the detection of adulterants and impurities. UPLC-MS is the undisputed leader in sensitivity and throughput, making it ideal for initial screening and targeted quantification of low-abundance species. In contrast, NMR provides definitive structural elucidation, excellent quantitative accuracy, and high reproducibility, making it indispensable for identifying unknown compounds, distinguishing isomers, and validating findings.
The choice between them is not a matter of superiority but of context. For comprehensive analysis, an integrated approach that leverages the strengths of both platforms is highly effective. The emergence of sophisticated data fusion strategies further enhances the value of this combination, providing a more holistic and robust analytical solution. When validated according to ICH guidelines, both UPLC-MS and NMR form a formidable alliance in the scientist's toolkit, ensuring the integrity and safety of complex pharmaceutical and biological products.
Navigating Challenges: Optimization and Troubleshooting for Robust Performance
Optimizing Sample Preparation for Cross-Platform Compatibility
The integration of multiple analytical platforms, notably ultra-performance liquid chromatography-mass spectrometry (UPLC-MS) and nuclear magnetic resonance (NMR) spectroscopy, is increasingly recognized as essential for comprehensive metabolomic coverage and robust biomarker discovery. However, the divergent physicochemical requirements of these techniques pose a significant challenge for sample preparation. This comparison guide objectively evaluates optimized protocols that enable sequential or parallel multi-platform analysis from a single biological specimen. Framed within the broader thesis of analytical technique validation in automated research environments, we present experimental data, standardized workflows, and reagent solutions to achieve cross-platform compatibility, thereby enhancing data integration, reproducibility, and biological insight in translational and drug development research.
Modern metabolomics aims to provide a holistic view of biochemical states, a goal that is unattainable by any single analytical technique due to inherent biases in metabolite detection [52]. While UPLC-MS offers high sensitivity and broad coverage for ionizable metabolites, NMR provides unambiguous structural elucidation, absolute quantification, and excellent reproducibility without being destructive [53] [54]. The erroneous belief that one platform is universally superior can limit metabolome coverage and compromise research quality [52]. Consequently, there is a growing imperative to develop sample preparation strategies that are compatible with both UPLC-MS and NMR, allowing researchers to leverage their complementary strengths from a single, often limited, sample [55] [56]. This guide compares and details optimized methodologies that facilitate this cross-platform approach, which is critical for validation in automated, high-throughput research settings.
Methodological Comparison and Experimental Protocols
Optimized sample preparation is the cornerstone of reliable cross-platform analysis. The primary challenge is reconciling the need for deuterated solvents for NMR with the ionization compatibility requirements for MS, all while maximizing metabolite extraction efficiency and coverage from minimal sample volumes.
Standardized Multi-Fluid Extraction Protocol
A robust, standardized operating procedure (SOP) for multiple biofluids (urine, blood, saliva, feces) enables analysis on a combined NMR and UPLC-MS platform. This protocol was evaluated for robustness and its ability to generate a representative metabolic map [55].
Detailed Protocol:
- Sample Handling: Collect and immediately freeze biofluids at -80°C. For plasma/serum, use appropriate anticoagulants.
- Universal Pre-processing: Thaw samples on ice. For serum/plasma, employ ultrafiltration (e.g., 3-kDa cutoff filters) to remove proteins. For NMR, the filtrate is directly mixed with a deuterated phosphate buffer (pH 7.4) containing a reference standard like DSS (4,4-dimethyl-4-silapentane-1-sulfonic acid) or TSP (trimethylsilylpropanoic acid). An aliquot of this same filtrate is stabilized for MS analysis, often by diluting with a water/organic solvent mix compatible with subsequent UPLC-MS injection [53] [55].
- Evaluation: The method's robustness is measured by the technical precision (median coefficient of variation <10-15%) and the number of metabolites consistently annotated across multiple sample batches.
Sequential Extraction from a Single Sample
For tissue or limited-volume biofluid samples, a sequential extraction protocol is paramount. A study demonstrated a method allowing sequential NMR and multi-LC-MS analysis from a single piece of liver tissue or a single plasma aliquot [56].
Detailed Protocol for Liver Tissue:
- Step 1 - Lipid Extraction: Homogenize tissue in a chloroform/methanol (2:1 v/v) mixture. Centrifuge to separate phases. Collect the organic (lower) phase containing lipids for UHPLC-MS-based lipidomics.
- Step 2 - Polar Metabolite Extraction: The remaining tissue pellet/methanol/water interface is then extracted with a methanol/water mixture. This polar extract is split.
- Step 3a - NMR Analysis: A portion of the polar extract is dried and reconstituted in deuterated phosphate buffer for ¹H-NMR spectroscopy.
- Step 3b - MS Analysis: The remaining polar extract is prepared for untargeted metabolic profiling by UHPLC-Q-Orbitrap MS. Detailed Protocol for Plasma: A biphasic chloroform/methanol/water extraction is suitable, where the aqueous phase (polar metabolites) is used for NMR first, and can subsequently be prepared for MS, while the organic phase is dedicated to lipidomics [56].
The performance of optimized cross-platform strategies can be evaluated based on metabolite coverage, technical precision, and concordance between platforms.
Table 1: Comparison of Sample Preparation Methods for Cross-Platform Analysis
| Method & Source | Biological Specimen | Key Advantage | Metabolites Detected (Frequently) | Median Technical Precision (CV) | Platform Compatibility |
|---|---|---|---|---|---|
| Standardized SOP [55] | Urine, Blood, Saliva, Feces | Unified protocol for 4 biofluids | Not specified (Method evaluated for robustness) | Evaluated for robustness | ¹H-NMR, RP-/HILIC-UHPLC-MS |
| Sequential Extraction [56] | Plasma, Liver Tissue | Maximizes data from single sample | Comprehensive polar & lipid coverage | Data reproducible; CVs not specified | ¹H-NMR, UHPLC-Q-Orbitrap & -QqQ MS |
| Serum Filtrate Protocol [53] | Human Serum | Enables direct comparison | 60 (MSI-CE-MS), 30 (NMR), 20 overlapping | Median CV < 10% | MSI-CE-MS, ¹H-NMR |
Table 2: Analytical Platform Characteristics & Cross-Platform Concordance
| Feature / Parameter | NMR Spectroscopy | UPLC-MS | Evidence & Cross-Platform Correlation |
|---|---|---|---|
| Primary Strength | Structural elucidation, absolute quantification, non-destructive, excellent reproducibility [54] [52] | High sensitivity, broad metabolome coverage, high resolution [53] [52] | Complementary; combined use improves detection and annotation [52]. |
| Quantitative Agreement | Directly quantitative via internal standard. | Requires calibration curves/internal standards. | For 20 serum metabolites, concentrations agreed over a 500-fold range with mean bias of 9.5% [53]. For 18 amino acids in D. magna, 17 agreed between ¹H NMR and LC-MS/MS [57]. |
| Coverage Overlap | Typically dozens of abundant polar metabolites in serum [53]. | Hundreds to thousands of features, including lipids. | In a study on C. reinhardtii, 102 metabolites were detected: 82 by GC-MS only, 20 by NMR only, 22 by both [52]. |
| Role in Validation | Gold standard for structure confirmation; validates MS identifications [54]. | Discovers candidate biomarkers; monitors low-abundance species. | Independent replication by both platforms reduces false discoveries (e.g., serum choline/histidine in liver fibrosis) [53]. |
The Scientist's Toolkit: Essential Research Reagent Solutions
Table 3: Key Reagents for Cross-Platform Sample Preparation
| Reagent / Material | Function in Protocol | Critical for Platform | Notes |
|---|---|---|---|
| Deuterated Solvents (D₂O, CD₃OD) | NMR lock signal and solvent suppression. Provides a non-protonated matrix. | NMR | Incompatible with MS ionization if carried over. Sequential protocols isolate the NMR aliquot first [56]. |
| Deuterated Internal Standard (DSS-d₆ or TSP-d₄) | Chemical shift reference and quantitative internal standard for ¹H-NMR. | NMR | Must be non-interfering and stable. DSS is preferred for its inertness and sharp singlet [57]. |
| Deuterated Buffer Salts (e.g., NaOD, DCl) | To adjust pD in NMR samples without introducing protonated signals. | NMR | pD = pH reading + 0.4. |
| Protein Precipitation / Ultrafiltration Filters (3 kDa MWCO) | Removes proteins that interfere with NMR spectra and foul LC columns/MS sources. | NMR & MS | Essential for serum/plasma. Filtrate can be split for both platforms [53]. |
| Stable Isotope-Labeled Internal Standards (¹³C, ¹âµN) | For absolute quantification and correcting for matrix effects in MS. | MS (Targeted) | Should be added early in extraction to account for losses. |
| Biphasic Extraction Solvents (CHCl₃/MeOH/H₂O) | Simultaneously extracts polar (aqueous) and non-polar (organic) metabolites from a single sample. | NMR & MS (Lipidomics) | Enables comprehensive profiling from limited material [56]. |
| 6-hydroxyheptanoyl-CoA | 6-hydroxyheptanoyl-CoA, MF:C28H48N7O18P3S, MW:895.7 g/mol | Chemical Reagent | Bench Chemicals |
Visualization of Workflows and Data Strategy
Cross-Platform Metabolomics Workflow from Sample to Insight
Data Fusion Strategies for Integrating NMR and MS Datasets
Optimizing sample preparation for cross-platform compatibility is not merely a technical exercise but a fundamental requirement for rigorous analytical validation and comprehensive systems biology. As demonstrated, standardized and sequential protocols can successfully feed both UPLC-MS and NMR platforms from a single sample, yielding complementary data with strong quantitative agreement for overlapping metabolites [53] [57] [56]. This synergy is crucial for biomarker discovery, where independent replication across orthogonal techniques reduces false positives [53], and for structural biology, where MS-based identification is confirmed by NMR [54]. The future of automated research labs, highlighted by trends towards "dark labs" and integrated robotic systems linking synthesis to centralized LC-MS and NMR platforms [1], will heavily rely on such robust, cross-compatible sample preparation workflows. By adopting these optimized methodologies, researchers and drug development professionals can ensure maximal information extraction from precious samples, leading to more reliable, validated, and insightful metabolomic research.
Mitigating Spatial Bias and Ensuring Reproducibility in High-Throughput Screening
High-throughput screening (HTS) technologies are indispensable in modern drug discovery, enabling the rapid testing of millions of chemical, genetic, or pharmacological experiments. However, the reliability of HTS data is critically threatened by spatial bias—systematic errors that produce over or under-estimation of true signals in specific locations within assay plates. These biases originate from various sources including reagent evaporation, cell decay, liquid handling errors, pipette malfunction, incubation time variation, and reader effects [58]. Spatial bias typically manifests as row or column effects, particularly on plate edges, and significantly increases false positive and false negative rates during hit identification [58]. The presence of these biases can prolong the drug discovery process and substantially increase its costs.
The reproducibility crisis in preclinical research further underscores the necessity of robust bias mitigation strategies. Ensuring reproducibility requires both computational methods to evaluate reproducible quality and analytical techniques that generate reliable, consistent data [59]. This challenge is particularly acute when comparing different analytical platforms, as each introduces unique technical variations and sensitivity limitations that can compound existing spatial biases if not properly controlled.
Analytical Platform Comparison: UPLC-MS versus NMR
The selection of appropriate analytical techniques is fundamental to obtaining quality HTS data. Ultra-performance liquid chromatography-mass spectrometry (UPLC-MS) and nuclear magnetic resonance (NMR) spectroscopy represent two powerful but fundamentally different approaches, each with distinct advantages and limitations for automated screening environments.
Table 1: Technical Comparison of UPLC-MS and NMR for High-Throughput Screening
| Parameter | UPLC-MS | NMR |
|---|---|---|
| Sensitivity | High (femtomole range) [4] | Low (micromolar-millimolar) [7] [4] |
| Reproducibility | Average [7] | Very High [7] |
| Metabolite Coverage | 300-1000+ metabolites [7] | 30-100 metabolites [7] |
| Sample Preparation | Complex, requires tissue extraction [7] | Minimal, tissues can be analysed directly [7] |
| Analysis Time | Longer, requires chromatography [7] | Fast, entire sample analysed in one measurement [7] |
| Quantitation | Relative, suffers from matrix effects [4] | Absolute, inherently quantitative [4] |
| Structural Information | Molecular weight, fragmentation patterns [4] | Detailed molecular structure, dynamics [4] |
| Destructive | Destructive to sample | Non-destructive, sample recovery possible [4] |
| Instrument Cost | Cheaper, occupies less space [7] | More expensive, occupies more space [7] |
UPLC-MS excels in sensitivity and metabolite coverage, capable of detecting hundreds to thousands of metabolites depending on the chromatography method used [7]. This technique combines the separation power of liquid chromatography with the detection capabilities of mass spectrometry, providing molecular weight information and, through tandem MS, fragmentation patterns for structural elucidation [4]. However, UPLC-MS quantification can be affected by ion suppression from matrix effects, where co-eluting compounds interfere with ionization efficiency [4]. This matrix dependence represents a significant source of potential variability in HTS applications.
NMR spectroscopy, while less sensitive than MS techniques, offers exceptional reproducibility and inherent quantitation capabilities [7] [4]. Its non-destructive nature allows sample recovery for additional analyses, and it provides direct structural information through chemical shifts, coupling constants, and multidimensional experiments [4]. Unlike MS data, which can vary based on instrumentation and ionization conditions, NMR data are highly consistent across different instruments and vendors [4]. This reproducibility makes NMR particularly valuable for validating findings from MS-based screens and for applications where quantitative accuracy is paramount.
Experimental Protocols for Bias Identification and Correction
Spatial Bias Detection and Correction Methodology
Robust statistical methods are essential for identifying and correcting spatial biases in HTS data. The following protocol, adapted from studies of ChemBank small molecule assays, provides a systematic approach:
Assay-Specific Bias Assessment: Calculate robust Z-scores across all plates within an assay to identify well locations consistently affected by spatial bias. Assay-specific bias occurs when a particular bias pattern appears across all plates of a given assay [58].
Plate-Specific Bias Detection: Apply the Partial Mean Polish (PMP) algorithm with Mann-Whitney U and Kolmogorov-Smirnov two-sample tests (significance threshold α=0.01-0.05) to identify plates affected by spatial bias. Determine whether the bias follows an additive or multiplicative model [58] [60].
Bias Correction Implementation:
- For additive bias: Apply the model: Yijp = μp + Rip + Cjp + εijp, where Yijp is the measured value, μp is the plate mean, Rip is the row effect, Cjp is the column effect, and εijp is random noise [58].
- For multiplicative bias: Apply the model: Yijp = μp × Rip × Cjp + εijp [58].
- Novel additive and multiplicative models accounting for different types of bias interactions should be considered for measurements at the intersection of biased rows and columns [60].
Hit Selection: After correction, identify hits using the μp - 3σp threshold, where μp and σp are the mean and standard deviation of corrected measurements in plate p [58].
This methodology has demonstrated superior performance in simulation studies, yielding higher true positive rates and lower false positive/negative counts compared to traditional methods like B-score and Well Correction [58].
Integrated LC-MS and NMR Analysis Protocol
To leverage the complementary strengths of both platforms, the following integrated protocol can be implemented for metabolomic studies:
Sample Preparation:
- For NMR analysis: Minimal preparation required. Saliva and other biofluids can be analyzed with minimal processing; ultrafiltration (3 kDa cutoff) may be used to remove proteins [46].
- For UPLC-MS analysis: More extensive preparation needed, including protein precipitation, extraction, and often derivatization. For urine analysis, dilute 10 μL urine 50-fold with ultrapure water, add labeled internal standards in methanol (final proportion water-methanol 1:2) [3].
Data Acquisition:
- NMR: Acquire 1D 1H NMR spectra on filtered samples using a NOESY-presat pulse sequence for water suppression. Typical acquisition time: 5 minutes per sample [46].
- UPLC-MS: Employ reversed-phase chromatography with acetonitrile/water gradients containing 0.1% formic acid. Use high-resolution mass spectrometry in both positive and negative ionization modes [46].
Data Integration: Combine NMR-quantified soluble metabolites (typically 45+ metabolites) with UPLC-MS quantified bioactive lipids (e.g., 24+ compounds) to extend metabolome coverage [46].
This integrated approach was successfully applied to analyze different types of human saliva, revealing significant differences in metabolite composition between unstimulated, stimulated, and pure parotid saliva that must be considered in experimental design [46].
Experimental Workflow for Bias-Resistant HTS
The diagram below illustrates the comprehensive experimental workflow for conducting high-throughput screening with integrated spatial bias mitigation and multi-platform validation.
Essential Research Reagent Solutions
Successful implementation of bias-resistant HTS requires specific research reagents and materials. The following table details key solutions for ensuring reproducibility and data quality.
Table 2: Essential Research Reagent Solutions for HTS Quality Assurance
| Reagent/Material | Function | Application Notes |
|---|---|---|
| Deuterated Solvents (D2O, CD3OD) | NMR mobile phase to reduce solvent signal interference | D2O relatively inexpensive; deuterated organic solvents recommended for critical runs despite higher cost [4] |
| Labeled Internal Standards (13C, 15N, 2H) | MS quantification normalization; NMR chemical reference | Essential for accounting for matrix effects in UPLC-MS; enables precise quantification [3] |
| Formic Acid/Ammonium Acetate | LC-MS mobile phase additives | Improve ionization efficiency (formic acid) and buffer capacity; 0.1% formic acid with 5mM ammonium acetate common [21] |
| Ultrafiltration Devices (3 kDa cutoff) | Sample cleanup for NMR | Remove proteins from biofluids; maintain small molecular weight metabolites for analysis [46] |
| Quality Control Reference Materials | System suitability testing | Pooled biological samples for inter-batch normalization; instrument performance verification [3] |
| Cryogenic NMR Probes | Sensitivity enhancement | 2-4x signal-to-noise improvement versus conventional probes; essential for low-concentration analytes [4] |
Effective mitigation of spatial bias and ensuring reproducibility in high-throughput screening requires a multifaceted approach combining rigorous statistical correction methods with complementary analytical technologies. UPLC-MS provides superior sensitivity and metabolite coverage, making it ideal for discovery-phase screening, while NMR offers exceptional reproducibility and absolute quantification capabilities valuable for validation studies. The integration of these platforms, coupled with robust experimental design and standardized reagent systems, creates a foundation for generating reliable, reproducible HTS data that can accelerate drug discovery while minimizing false leads from technical artifacts. As high-throughput technologies continue to evolve, maintaining emphasis on methodological rigor and cross-platform validation will remain essential for scientific progress in biomedical research.
Managing Matrix Effects and LC-MS Performance Drift
In modern drug development and automated research environments, Ultra-Performance Liquid Chromatography-Mass Spectrometry (UPLC-MS) and Nuclear Magnetic Resonance (NMR) represent two complementary pillars for compound identification and quantification. The validation of these analytical techniques is paramount for ensuring data reliability, especially as laboratories increasingly adopt automated, high-throughput workflows. This guide objectively compares the performance of UPLC-MS and NMR, focusing on two fundamental challenges: managing matrix effects and correcting for instrumental performance drift. Matrix effects—where co-eluting sample components interfere with analyte detection—can compromise quantitative accuracy in UPLC-MS [61] [62]. Simultaneously, signal intensity drift during long analytical sequences is a well-recognized issue in quantitative LC-MS analysis, particularly when internal standards are unavailable [63]. This guide synthesizes current research to compare mitigation strategies, provide detailed experimental protocols, and outline essential resources for researchers and scientists engaged in analytical method development and validation.
Comparative Analysis: UPLC-MS vs. NMR
The following table summarizes the core characteristics, strengths, and limitations of UPLC-MS and NMR spectroscopy in the context of automated analysis.
Table 1: Performance Comparison of UPLC-MS and NMR for Automated Analysis
| Feature | UPLC-MS | NMR |
|---|---|---|
| Fundamental Principle | Separation followed by mass-based detection | Absorption of radiofrequency radiation by atomic nuclei |
| Key Strength | Exceptional sensitivity (femtomole level) [4] | Definitive structural elucidation, distinguishes isomers [4] |
| Primary Limitation | Susceptible to matrix effects (ion suppression/enhancement) [62] [4] | Inherently low sensitivity (microgram level) [4] |
| Matrix Effects | Significant; co-eluting compounds affect ionization [64] [61] | Minimal to none; intrinsically quantitative and not susceptible to ionization effects [4] |
| Quantitative Performance | High precision, but requires strategies to correct for signal drift and matrix effects [63] [65] | Directly quantitative; signal is proportional to nucleus count without calibration [4] |
| Typical Analysis Time | Seconds to minutes per sample | Minutes to hours for a 1D spectrum [4] |
| Data Reproducibility | Instrument and ionization method-dependent [4] | Highly reproducible across different instruments/vendors [4] |
| Best Application in Automation | High-throughput targeted quantification and non-targeted screening | Absolute structure verification and quantification of major components |
Managing Matrix Effects in UPLC-MS
Matrix effects occur when components in the sample other than the analyte alter the detector's response, primarily through ion suppression or enhancement in the mass spectrometer's ion source [61] [62]. These effects can break fundamental LC behavior rules, even altering the retention time and shape of analyte peaks [64].
Detection and Assessment Strategies
The first step toward a solution is identifying the problem. Commonly used approaches include:
- Post-extraction Addition: The signal response of an analyte spiked into a neat solution is compared to its response when spiked into a pre-processed sample matrix. The difference indicates the extent of the matrix effect [62].
- Post-column Infusion: A solution of the analyte is infused into the LC eluent while a blank matrix extract is injected. A stable signal indicates no matrix effects, while a dip or rise in the signal reveals regions of ionization suppression or enhancement in the chromatogram [61].
Comparison of Mitigation and Correction Techniques
Several strategies exist to mitigate or correct for matrix effects, each with distinct advantages and drawbacks.
Table 2: Strategies for Mitigating and Correcting Matrix Effects in LC-MS
| Strategy | Mechanism | Advantages | Limitations/Disadvantages |
|---|---|---|---|
| Sample Dilution | Reduces concentration of interfering matrix components [62]. | Simple, cost-effective [66]. | Feasible only for high-sensitivity assays; may compromise LODs [62]. |
| Improved Sample Cleanup | Physically removes matrix components before analysis [62]. | Can significantly reduce matrix interference. | May not remove structurally similar interferents; adds time and complexity [62]. |
| Chromatographic Optimization | Alters separation to prevent co-elution of analyte and matrix [62]. | Addresses the root cause of the effect. | Can be time-consuming; some mobile phase additives can suppress signal [62]. |
| Stable Isotope-Labeled Internal Standard (SIL-IS) | Co-eluting IS with nearly identical chemical properties corrects for ionization efficiency [62]. | Considered the "gold standard" for correction [62]. | Expensive; not always commercially available [62]. |
| Standard Addition Method | Calibrates by spiking known amounts of analyte into the sample itself [62]. | Does not require a blank matrix; ideal for endogenous compounds. | Labor-intensive for large sample sets; not practical for multivariate calibration [62] [67]. |
| Matrix Matching | Selects calibration standards with a matrix composition similar to the unknown sample [67]. | Proactively minimizes matrix variability. | Requires many blank matrices; impossible to match all samples exactly [62] [67]. |
| Individual Sample-Matched IS (IS-MIS) | Uses multiple internal standards and matches them to analytes based on behavior in each specific sample [66]. | High accuracy in highly variable samples (e.g., urban runoff). | Requires additional analysis time and data processing [66]. |
Correcting LC-MS Performance Drift
Instrumental signal drift over long analytical sequences is a critical challenge for ensuring process reliability and product stability, especially in automated environments [63] [65].
Drift Correction Strategies
Key strategies for drift correction mirror some approaches for matrix effects but are designed to track and correct changes over time.
Table 3: Strategies for Correcting LC-MS Signal Drift
| Strategy | Mechanism | Reported Performance |
|---|---|---|
| Quality Control (QC)-Based Correction | Regularly interspersed pooled QC samples are used to model and correct the drift of all detected compounds over time [63] [65]. | Significantly reduces drift effects; Random Forest algorithm found most stable for long-term GC-MS data [65]. |
| Internal Standard (IS) Correction | A known amount of IS added to every sample corrects for fluctuations. Stable isotope-labeled (SIL) IS is most effective [63] [62]. | Significantly reduces drift effects; considered a potent mitigation tool [63]. |
| Quantification Bracketing | Uses high-concentration calibration standards analyzed at the beginning and end of the batch to model drift [63]. | Improves quantification accuracy but shows variable performance across different compounds [63]. |
| Advanced Algorithmic Correction | Machine learning models (e.g., Support Vector Regression, Random Forest) use QC data to predict and correct drift based on batch and injection order [65]. | Random Forest provided the most stable and reliable correction for highly variable long-term data, outperforming spline interpolation and SVR [65]. |
Experimental Protocol: QC-Based Drift Correction with Machine Learning
The following workflow, based on a 155-day GC-MS study, details a robust protocol for long-term signal drift correction that is equally applicable to LC-MS [65].
Drift Correction with Machine Learning
Step-by-Step Methodology:
- Pooled QC Sample Preparation: Create a quality control sample by pooling aliquots from all samples in the study to ensure it contains a representative mixture of all analytes [65].
- Data Collection: Analyze the pooled QC sample repeatedly at regular intervals throughout the entire analytical sequence (e.g., 20 times over 155 days). Record the batch number (tracking instrument power cycles) and injection order number for each run [65].
- Peak Processing: For each component (k) in the QC sample, extract the peak area (X_i,k) from each of the n runs.
- Reference Value Calculation: Determine the median peak area (X_T,k) for each component k across all n QC runs. This median serves as the best estimate of the "true" value [65].
- Correction Factor Calculation: For each component k in each QC run i, calculate a correction factor: yi,k = Xi,k / X_T,k [65].
- Model Training: Use machine learning (e.g., Random Forest) to train a correction function fk(p, t) for each component. The model uses batch number (p) and injection order (t) as inputs to predict the correction factor (yi,k) [65].
- Application and Validation: For an actual sample, input its batch and injection order into the trained model to get the predicted correction factor (y). Correct the raw peak area (xS,k) using x'S,k = x_S,k / y. Validate the correction using principal component analysis (PCA) and analysis of standard deviations to confirm reduced variability [65].
Integrated Workflows: LC-MS-NMR for Unambiguous Identification
For complete structural elucidation of unknown compounds, integrating LC-MS and NMR is a powerful approach. MS provides molecular weight and fragment information, while NMR distinguishes isomers and provides definitive atomic connectivity [29] [4]. The integrated workflow for analyzing low-concentration analytes often involves an offline approach to overcome NMR's sensitivity limitations.
Offline LC-MS-NMR Workflow
Experimental Protocol:
- Initial LC-MS Analysis: The sample is first analyzed by UPLC-MS/MS to identify components of interest and assess complexity [4].
- Peak Collection: When an unknown analyte requires identification, the HPLC flow is diverted at the corresponding retention time to collect the fraction. Solid-phase extraction (SPE) can be used for more efficient trapping and desalting [4].
- Sample Preparation for NMR: The collected fraction is concentrated, often by solvent evaporation, to achieve the required analyte concentration for NMR (microgram level). The sample is then reconstituted in a deuterated solvent (e.g., CD3OD or D2O) [4].
- NMR Spectroscopy: The purified sample is transferred to an NMR tube for analysis. Cryoprobes or microcoil probes are typically used to enhance sensitivity. 1H NMR is standard, with 13C and 2D experiments (e.g., COSY, HSQC) performed for full structural elucidation [4].
- Data Integration: The molecular formula and fragmentation pattern from MS are combined with the structural information from NMR (chemical shift, coupling constants, connectivity) to unambiguously verify the chemical structure [29] [4].
The Scientist's Toolkit: Essential Research Reagents and Materials
Table 4: Key Reagents and Materials for Managing Matrix Effects and Drift
| Item | Function/Purpose |
|---|---|
| Stable Isotope-Labeled Internal Standards (SIL-IS) | Corrects for both matrix effects and instrumental drift by behaving identically to the analyte during sample preparation and ionization [62]. |
| Deuterated Solvents (e.g., D2O, CD3OD) | Used in NMR and LC-NMR to avoid overwhelming solvent signals; necessary for locking and shimming the NMR magnet [4]. |
| Pooled Quality Control (QC) Sample | A representative mixture of all study samples used to monitor and correct for instrumental signal drift over long sequences [63] [65]. |
| Solid-Phase Extraction (SPE) Sorbents (e.g., Oasis HLB, ENVI-Carb) | Used for sample clean-up to remove matrix interferents and for pre-concentrating analytes prior to LC-MS or NMR analysis [4] [66]. |
| Formic Acid | A common mobile phase additive in LC-MS that promotes protonation of analytes in positive electrospray ionization mode [66]. |
| Cryoprobes / Microcoil NMR Probes | Specialized NMR probes that significantly increase sensitivity, enabling the analysis of low-concentration analytes eluting from an LC system [4]. |
In the modern analytical laboratory, Ultra-Performance Liquid Chromatography-Mass Spectrometry (UPLC-MS) and Nuclear Magnetic Resonance (NMR) spectroscopy represent two pillar technologies for compound identification and validation. The drive toward automation in research has positioned these techniques as complementary tools in high-throughput workflows, particularly in fields such as drug development and metabolomics. UPLC-MS brings exceptional sensitivity and speed to separation science, enabling the rapid analysis of complex mixtures with detection limits in the femtomole range [4]. Meanwhile, NMR provides unparalleled structural elucidation capabilities, distinguishing between isomers and providing atomic-level insight into molecular structure, despite its inherently lower sensitivity [68]. The integration of these techniques into automated platforms represents a significant advancement in analytical science, allowing researchers to leverage the respective strengths of each method while minimizing their individual limitations through sophisticated data processing and workflow design.
The validation of analytical techniques requires a comprehensive understanding of both methodological capabilities and practical implementation. UPLC-MS systems have seen widespread adoption in quantitative bioanalysis due to their rapid analysis times and compatibility with automated sample handling. Conversely, NMR offers intrinsically quantitative data without requiring compound-specific calibration and is non-destructive, allowing for sample recovery and further analysis [68]. When framed within automation research, both techniques present unique considerations for data processing pipeline development, integration with laboratory information management systems (LIMS), and the implementation of algorithms for real-time data interpretation and quality control. This comparison guide objectively examines the performance characteristics of UPLC-MS and NMR spectroscopy within this context, providing experimental data to inform platform selection for specific research applications.
Technical Comparison: UPLC-MS versus NMR
Fundamental Principles and Analytical Strengths
UPLC-MS combines the high-resolution separation power of ultra-performance liquid chromatography with the detection capabilities of mass spectrometry. The chromatographic component separates complex mixtures using pressurized mobile phases and specialized stationary phases, while the mass spectrometer detects eluted compounds based on their mass-to-charge ratio ((m/z)). This hyphenated technique provides both retention time and mass spectral data for compound identification and quantification [3]. The exceptional sensitivity of UPLC-MS, with limits of detection comfortably in the femtomole range for analytes with high ionization efficiency, makes it ideal for detecting low-abundance compounds in complex matrices [4]. Modern UPLC-MS systems can complete a thorough analysis, including fragmentation data, in under a second per sample when configured for high-throughput applications [4].
NMR spectroscopy exploits the magnetic properties of certain atomic nuclei ((^1)H, (^{13})C, (^{19})F, (^{31})P) when placed in a strong magnetic field. The precise resonance frequency of these nuclei (chemical shift) provides detailed information about their chemical environment, while coupling constants and multi-dimensional experiments reveal atomic connectivity and spatial relationships [68]. Unlike MS-based techniques, NMR is non-destructive, preserves sample integrity, and provides inherently quantitative data through direct signal intensity proportionality to nucleus concentration [68]. A significant advantage of NMR in automated workflows is its exceptional reproducibility across different instruments and laboratories, regardless of vendor or field strength [4].
Performance Metrics and Capabilities
Table 1: Direct Comparison of UPLC-MS and NMR Performance Characteristics
| Parameter | UPLC-MS | NMR |
|---|---|---|
| Sensitivity | High (femtomole range) [4] | Low (nanogram to microgram range) [4] |
| Reproducibility | Average, instrument-dependent [7] | Very high and instrument-independent [4] [7] |
| Detection Limit | ~10(^{-13}) mol [4] | ~10(^{-9}) mol [4] |
| Throughput | High (minutes per sample) [69] | Moderate to Low (minutes to hours per sample) [4] |
| Quantitative Capability | Requires internal standards and calibration [3] | Inherently quantitative [68] |
| Structural Elucidation Power | Moderate (molecular formula, fragmentation patterns) [4] | High (atomic connectivity, stereochemistry, isomer distinction) [4] [68] |
| Sample Preparation | Complex, often requiring extraction and derivatization [7] | Minimal for crude mixtures [7] |
| Metabolite Coverage | 300-1000+ metabolites [7] | 30-100 metabolites [7] |
| Isomer Differentiation | Limited capability [4] | Excellent capability [4] |
Data Processing in Automated Workflows
Automated data processing represents a critical differentiator between UPLC-MS and NMR platforms. UPLC-MS data processing typically involves peak detection, integration, noise filtering, and spectral deconvolution algorithms, often assisted by machine learning approaches for feature recognition in complex samples [70]. The polarity switching capability of modern MS instruments allows simultaneous monitoring of positively and negatively charged ions within a single run, increasing throughput without compromising data quality [70]. Automated processing pipelines can align chromatographic peaks across multiple samples, perform background subtraction, and execute library searches against mass spectral databases for compound identification.
NMR data processing in automated workflows employs Fourier transformation of free induction decay signals, followed by phase correction, baseline correction, and chemical shift referencing [28]. For complex mixtures, specialized algorithms such as STORM (Structure Tuning and Recognition of Metabolites) enable automatic compound identification and quantification from 1D (^1)H-NMR spectra [71]. The CHECKIN system, implemented at Wyeth Research, demonstrates how NMR data can be integrated into automated compound validation workflows, allowing researchers to submit previously acquired NMR data directly into validation pipelines without additional sample preparation [28]. This approach saves significant time and preserves valuable compound material while maintaining analytical rigor.
Experimental Validation and Applications
Protocol for Comparative Metabolic Profiling
A validated experimental approach for comparing UPLC-MS and NMR performance involves metabolic profiling of biological samples. In a representative study investigating chemotypic variation in Sceletium tortuosum, researchers implemented parallel analyses using both platforms [72]. For UPLC-MS analysis, sample preparation involved acid/base extraction followed by chromatographic separation using a C18 column (50 mm × 2.1 mm, 1.8 μm) with a gradient mobile phase of methanol and 0.1% formic acid in water at a flow rate of 0.4 mL/min [72]. Mass spectrometric detection employed electrospray ionization in positive and negative modes with alternating polarity switching for comprehensive metabolite detection.
For NMR analysis, sample preparation involved methanol extraction without fractionation. (^1)H-NMR spectra were acquired at 25°C on a 600 MHz spectrometer using a cryoprobe for enhanced sensitivity [72]. Standard parameters included a 90° pulse, 2.5 s relaxation delay, and 64 scans. For structural elucidation, two-dimensional NMR experiments (COSY, HSQC, HMBC) were performed on selected samples to confirm metabolite identities suggested by initial UPLC-MS profiling [72].
Analytical Figures of Merit
Table 2: Experimental Performance Data from Comparative Studies
| Performance Metric | UPLC-MS Results | NMR Results |
|---|---|---|
| Analysis Time per Sample | 5 days for 132 samples in both polarities [3] | 4-5 minutes per sample for 1D (^1)H-NMR [3] |
| Reproducibility (\%RSD) | 11-15% for inter-day precision [69] | <2% for inter-day precision [3] |
| Quantitative Correlation | Pearson's r > 0.9 for 10 metabolites vs. reference method [3] | Excellent correlation with reference standards (r > 0.99) [3] |
| Linearity Range | 1-3000 ng/mL (Revumenib assay) [69] | Dynamic range of 10(^5) [4] |
| Limit of Quantification | 0.96 ng/mL for Revumenib [69] | ~10 μg for simple 1H spectrum [4] |
| Metabolites Identified | 80 triterpenoid saponins + 40 flavonoids in Medicago truncatula [71] | Validation of alkaloid markers in Sceletium tortuosum [72] |
Workflow Automation and Integration
The most significant advancements in analytical efficiency come from integrated platforms that combine the strengths of both techniques. The UHPLC-MS/MS-SPE-NMR system represents a state-of-the-art automated approach for confident metabolite identification [71]. This platform splits the UHPLC eluent, directing approximately 5% to a mass spectrometer for detection and triggering, while the remaining 95% is directed to solid-phase extraction (SPE) cartridges for compound trapping. After multiple injections, trapped compounds are eluted with deuterated solvents for offline NMR analysis, concentrating microgram quantities sufficient for structure elucidation [71].
Automated data processing pipelines are essential for handling the complex datasets generated by these integrated platforms. For UPLC-MS, software tools automatically perform peak picking, spectral deconvolution, and database searching against mass spectral libraries such as HMDB, MassBank, and NIST [71]. NMR data processing pipelines automatically perform Fourier transformation, phase correction, and chemical shift referencing, with advanced platforms like CHECKIN enabling direct submission of NMR data to compound registration workflows [28]. The integration of these processing streams through platforms like the automated UHPLC-MS/MS-SPE-NMR system has demonstrated the ability to confidently identify numerous previously unknown metabolites in complex plant extracts [71].
Essential Research Reagent Solutions
The implementation of robust UPLC-MS and NMR methodologies requires specific reagent systems and materials optimized for each platform. The following table details essential research reagents and their functions in automated analytical workflows.
Table 3: Essential Research Reagents for UPLC-MS and NMR Analyses
| Reagent/Material | Function | Application Notes |
|---|---|---|
| Deuterated Solvents (e.g., D₂O, CD₃OD) | NMR solvent with minimal interference; enables field frequency locking | Cost-effective option: use D₂O for aqueous phase only; ~$0.50/mL for D₂O vs >$1/mL for organic deuterated solvents [4] |
| LC-MS Grade Solvents (e.g., methanol, acetonitrile) | Mobile phase components with minimal ion suppression | High purity essential for reducing background noise and maintaining ionization efficiency [70] |
| Formic Acid/Ammonium Formate | Mobile phase additives for pH control and ion pairing | 0.05-0.1% formic acid common for positive ion mode; ammonium formate buffers for negative ion mode [69] [70] |
| Internal Standards (isotope-labeled) | Quantitative reference for MS; chemical shift reference for NMR | Essential for normalization in MS quantification; tetramethylsilane (TMS) or DSS for NMR chemical shift referencing [3] |
| Solid Phase Extraction Cartridges | Automated compound trapping for NMR | Enables concentration of analytes from multiple LC runs; typically C18 or similar reversed-phase material [71] |
| Protein Precipitation Reagents (e.g., methanol, acetonitrile) | Sample clean-up for biofluids | Methanol with 0.05% formic acid effective for serum samples; eliminates evaporation/reconstitution steps [70] |
Strategic Implementation in Drug Development
Automated Structure Verification
In pharmaceutical research, the verification of compound structures represents a critical application for automated analytical platforms. Sanofi, in partnership with ACD/Labs, developed an automated tool combining LC/MS and (^1)H NMR to help organic chemists efficiently verify synthetic compounds [29]. This system automatically collects, compiles, and evaluates analytical data against proposed structures once available, sending results directly to the chemist. Such integrated approaches significantly reduce the time from compound synthesis to structure confirmation, accelerating the drug discovery pipeline.
The selection between UPLC-MS and NMR for specific applications depends on multiple factors, including the required level of structural confidence, sample quantity, and throughput requirements. For high-throughput screening where thousands of compounds must be rapidly characterized, UPLC-MS provides the necessary speed and sensitivity. For definitive structure elucidation, particularly when dealing with novel compounds, positional isomers, or stereochemical considerations, NMR remains the "gold standard" [68]. The emerging trend toward integrated platforms allows researchers to leverage the initial screening power of UPLC-MS with the definitive structural capabilities of NMR in an automated workflow.
Analysis Pathways for Technique Selection
UPLC-MS and NMR spectroscopy offer complementary capabilities for automated analytical workflows, with selection dependent on specific research requirements. UPLC-MS excels in sensitivity, throughput, and detection of low-abundance compounds, making it ideal for high-throughput screening and quantitative analysis. NMR provides definitive structural elucidation, exceptional reproducibility, and intrinsic quantitative capabilities without requiring compound-specific standards. For the most challenging analytical problems, particularly in natural product discovery and metabolomics, integrated platforms such as UHPLC-MS/MS-SPE-NMR leverage the strengths of both techniques in an automated workflow. The ongoing development of automated data processing pipelines and intelligent data integration algorithms continues to enhance the efficiency and accuracy of both platforms, positioning them as indispensable tools in modern analytical laboratories.
Solvent Selection and Method Development for Comprehensive Metabolite Coverage
In metabolomics, the selection of solvents and extraction methodologies is a foundational step that directly determines the breadth and depth of metabolite coverage. Effective sample preparation must rapidly quench metabolic activity to preserve the true physiological state of the biological system while efficiently releasing a comprehensive range of intracellular metabolites with varying physicochemical properties [73] [74]. The optimal solvent system must accommodate the specific analytical technique—whether UPLC-MS or NMR—each presenting unique requirements for solvent compatibility, sensitivity, and metabolite detection capabilities.
This guide objectively compares extraction methodologies for comprehensive metabolite profiling, framing the analysis within the broader context of analytical technique validation between UPLC-MS and NMR. We present experimental data from recent studies to empower researchers in making informed decisions for method development in drug discovery and biomedical research.
Comparative Analysis of Extraction Solvents and Techniques
Efficiency of Organic Solvents for Metabolite Extraction
Experimental studies systematically comparing extraction solvents reveal significant differences in metabolite recovery profiles. Research on human adherent cells (HDFa and DPSCs) demonstrated that direct mechanical scraping into organic solvent yielded higher abundances of determined metabolites compared to enzymatic detachment (trypsinization), which caused leakage of amino acids and peptides [73].
Table 1: Metabolite Extraction Efficiency of Organic Solvents for NMR-Based Metabolomics
| Extraction Solvent | Cell Type/Model | Extraction Efficiency Observations | Key Metabolite Classes Recovered |
|---|---|---|---|
| 80% Methanol | HDFa, DPSCs | Same quality as other polar reagents; effective for polar metabolites | Amino acids, peptides, carbohydrates [73] |
| 50% Methanol | HDFa, DPSCs | Same quality as other polar reagents; effective for polar metabolites | Amino acids, peptides, carbohydrates [73] |
| 80% Ethanol | HDFa, DPSCs | Higher extraction efficiency for most identified and quantified metabolites | Broad spectrum [73] |
| Acetonitrile (70%) | HDFa, DPSCs | Same quality as other polar reagents | Polar metabolites [73] |
| Methanol-Chloroform | HDFa, DPSCs | Higher extraction efficiency; two-phase system separates polar/non-polar | Lipids and polar metabolites [73] |
| MTBE | HDFa, DPSCs | Higher extraction efficiency; two-phase system | Lipids and polar metabolites [73] |
For botanical ingredient authentication across nine taxa including Camellia sinensis and Cannabis sativa, methanol-deuterium oxide (1:1) and methanol (90% CH₃OH + 10% CD₃OD) proved most effective for comprehensive metabolite fingerprinting [75] [76]. Methanol-deuterium oxide yielded 155 NMR spectral metabolite variables for Camellia sinensis, while methanol produced 198 variables for Cannabis sativa and 167 for Myrciaria dubia [75].
Harvesting Methods Significantly Impact Metabolite Profiles
The initial cell harvesting approach introduces significant variation in metabolite profiles. For adherent cell cultures, trypsinization negatively affects metabolite integrity compared to mechanical methods [73].
Table 2: Impact of Cell Harvesting Methods on Metabolite Recovery
| Harvesting Method | Experimental Model | Impact on Metabolite Profiles | Recommended Applications |
|---|---|---|---|
| Direct Scraping into Solvent | HDFa, DPSCs | Higher abundances of determined metabolites; preserves labile metabolites | General metabolomics; time-course studies [73] |
| Trypsinization | HDFa, DPSCs | Reduced abundances in amino acids and peptides classes; metabolite leakage | Protocols requiring cell counting [73] |
| Cold Methanol Quenching | Various cell types | Rapidly halts metabolic activity within seconds; preserves intracellular metabolites | Differentiating intra/extracellular metabolites [74] |
Method Validation: UPLC-MS versus NMR
Complementary Technical Strengths and Requirements
UPLC-MS and NMR offer orthogonal approaches to metabolite analysis, each with distinct advantages that influence solvent selection and method validation strategies.
Table 3: Comparison of UPLC-MS and NMR for Metabolite Analysis
| Parameter | UPLC-MS | NMR |
|---|---|---|
| Sensitivity | Superior sensitivity for low-abundance metabolites [74] | Lower sensitivity but sufficient for abundant metabolites [54] |
| Reproducibility | High with proper calibration [74] | Excellent long-term reproducibility and stability [75] [76] |
| Structural Elucidation | Provides molecular weight and fragmentation pattern [54] | Determines full molecular framework and stereochemistry [54] |
| Sample Preparation | Requires protein precipitation; solvent compatibility with MS | Often uses deuterated solvents for field frequency lock [75] |
| Metabolite Coverage | Comprehensive with complementary chromatographic methods [74] | Broad coverage without separation; detects isomeric impurities [54] |
| Quantitation | Requires internal standards [74] | inherently quantitative without external standards [54] |
| Impurity Detection | Excellent for low-level impurities [54] | Excellent for isomeric impurities [54] |
Solvent Compatibility and Preparation Requirements
UPLC-MS Compatibility: Methanol, acetonitrile, and ethanol are preferred for UPLC-MS as they facilitate protein precipitation and provide good ionization efficiency. Acidified solvents may improve retention of acidic metabolites but can suppress ionization and damage LC columns [74].
NMR Compatibility: Deuterated solvents (e.g., CD₃OD, D₂O) are required for field frequency lock, though 10% deuterated methanol in regular methanol may be sufficient [75]. Buffering with phosphate buffers in D₂O enhances spectral consistency by minimizing pH-induced chemical shift variations [75] [76].
Experimental Protocols for Comprehensive Metabolite Extraction
Standardized Protocol for Intracellular Metabolite Extraction
The following protocol, adapted from recent metabolomics studies, ensures comprehensive metabolite coverage with compatibility for both UPLC-MS and NMR analysis:
Reagents and Materials:
- Pre-cooled methanol (80% or 100%, LC-MS grade)
- Phosphate buffer (for NMR applications)
- Deuterium oxide (for NMR applications)
- Cold PBS (4°C)
- Sonication device
- Refrigerated centrifuge
Procedure:
- Rapid Quenching: Aspirate culture medium and immediately add pre-cooled extraction solvent (e.g., 80% methanol at -20°C) [73] [74].
- Cell Harvesting: Scrape adherent cells directly into the extraction solvent using a chilled scraper [73].
- Cell Disruption: Transfer cell lysate to a microtube and sonicate 3 × 10 seconds with intervals on ice [73].
- Metabolite Extraction: Incubate samples for 20 minutes at -20°C to complete metabolite extraction [73].
- Protein Removal: Centrifuge at 14,000 × g for 15 minutes at 4°C [73].
- Sample Division: Transfer supernatant to fresh tubes for analysis:
- For UPLC-MS: Use LC-MS grade solvents without deuterated compounds
- For NMR: Include 10% deuterated solvent for field frequency lock [75]
- Storage: Store extracts at -80°C until analysis.
Two-Phase Extraction for Comprehensive Lipid and Polar Metabolite Profiling
For complete coverage of both polar and non-polar metabolites, a two-phase extraction system is recommended:
Methanol-Chloroform Extraction [73]:
- Harvest cells by scraping into 75% methanol.
- Add chloroform in a 9:1 ratio (methanol:chloroform).
- Sonicate (3 × 10 seconds), incubate 20 minutes at 4°C with agitation.
- Centrifuge at 14,000 × g and 4°C to separate phases.
- Collect polar (upper) and hydrophobic (lower) phases separately.
- Store at -80°C until analysis.
MTBE Extraction [73]:
- Harvest cells in methanol.
- Add MTBE and water to create a ternary solvent system.
- Mix thoroughly and centrifuge to separate phases.
- Collect upper (organic) and lower (aqueous) phases.
- Store at -80°C until analysis.
Workflow Visualization: Solvent Selection for Comprehensive Metabolite Coverage
The following diagram illustrates the decision pathway for selecting appropriate extraction methodologies based on research objectives and analytical techniques:
Essential Research Reagent Solutions
The following table details key reagents and their specific functions in metabolite extraction protocols:
Table 4: Essential Research Reagents for Metabolite Extraction
| Reagent/Solution | Function in Metabolite Extraction | Technical Considerations |
|---|---|---|
| Methanol (80-100%) | Protein precipitation and metabolite extraction; rapid metabolism quenching [73] [74] | Low viscosity and freezing point ideal for cold quenching; LC-MS grade for MS applications [74] |
| Deuterated Methanol (CD₃OD) | NMR-compatible solvent providing field frequency lock [75] | Can be blended with regular methanol (10%) to reduce cost while maintaining NMR functionality [75] |
| Deuterium Oxide (Dâ‚‚O) | Aqueous component for NMR; enhances polar metabolite extraction [75] [76] | Often used with phosphate buffer to stabilize pH and minimize chemical shift variation [75] |
| Methyl-tert-butyl ether (MTBE) | Organic solvent for lipid extraction; forms two-phase system with methanol/water [73] | Less dense than chloroform; forms upper organic phase [73] |
| Chloroform | Organic solvent for lipid extraction in two-phase systems [73] | Forms lower dense phase; requires proper hazardous handling [73] |
| Phosphate Buffer | pH stabilization for NMR applications; maintains consistent chemical shifts [75] | Critical for reproducible NMR spectra; typically prepared in Dâ‚‚O [75] |
| Acetonitrile | Protein precipitation solvent with different selectivity than methanol [73] | Effective for polar metabolites; compatible with UPLC-MS [73] |
Optimal solvent selection for comprehensive metabolite coverage requires careful consideration of analytical technique requirements, metabolite classes of interest, and biological matrix characteristics. Methanol-based extractions provide the most versatile performance across both UPLC-MS and NMR platforms, while two-phase systems offer complete coverage of polar and non-polar metabolites. Direct scraping into organic solvent consistently outperforms enzymatic detachment for adherent cells. Validation of extraction methods must account for the complementary strengths of UPLC-MS and NMR, with standardization using reference materials and protocols being essential for reproducible metabolomics research. By applying these evidence-based solvent selection strategies, researchers can significantly improve metabolite coverage and data quality in drug development and biomedical research applications.
Ensuring Data Integrity: A Framework for Technique Validation and Comparison
Adhering to ICH Q2(R2) Guidelines for Analytical Procedure Validation
In the pharmaceutical industry and clinical research, the reliability of analytical data is paramount. The International Council for Harmonisation (ICH) Q2(R2) guideline, entitled "Validation of Analytical Procedures," provides a fundamental framework for establishing that analytical methods are suitable for their intended purpose [77] [78]. This guideline outlines key validation characteristics including accuracy, precision, specificity, linearity, and range that must be demonstrated for analytical procedures used in the release and stability testing of commercial drug substances and products [77]. With the final version published in March 2024 and accompanying training materials released as recently as July 2025, the scientific community is currently adapting to these updated recommendations for both spectroscopic and chromatographic methods [78] [79].
Within this validation framework, Ultra-Performance Liquid Chromatography-Mass Spectrometry (UPLC-MS) and Nuclear Magnetic Resonance (NMR) spectroscopy represent two powerful but fundamentally different analytical approaches. This comparison guide objectively evaluates their performance characteristics when applied to metabolic phenotyping in biofluids, providing experimental data and methodologies to inform technique selection based on defined analytical needs. Both platforms offer distinct advantages and limitations in terms of sensitivity, throughput, metabolite coverage, and quantitative capabilities—all critical considerations when designing analytical strategies compliant with ICH Q2(R2) principles [3] [46] [44].
Analytical Technique Comparison: UPLC-MS versus NMR
Core Technical Principles and Experimental Workflows
UPLC-MS combines chromatographic separation with mass spectrometric detection, providing high sensitivity and selectivity. The workflow typically involves sample preparation, chromatographic separation, ionization, mass analysis, and data processing.
NMR Spectroscopy exploits the magnetic properties of certain nuclei, providing direct quantitative capability without requiring separation. The workflow involves sample preparation, placement in a strong magnetic field, application of radiofrequency pulses, and detection of the resulting signals.
The fundamental workflows for both techniques in metabolic phenotyping studies are illustrated below:
Direct Performance Comparison in Metabolic Phenotyping
The table below summarizes quantitative performance data derived from comparative studies analyzing human biofluids:
Table 1: Quantitative Performance Comparison of UPLC-MS and NMR for Biofluid Analysis
| Performance Characteristic | UPLC-MS | NMR | Experimental Context |
|---|---|---|---|
| Metabolites Quantified | 24-35 targeted metabolites [3] [46] | Up to 45 metabolites in saliva [46] | Human urine/saliva analysis |
| Analytical Sensitivity | Nanomolar to picomolar range [46] | Micromolar to millimolar range [3] | Limit of detection studies |
| Sample Throughput | 5 days for 132 samples (both polarities) [3] | 4-5 minutes per sample [3] | Batch analysis comparison |
| Quantitative Precision | Strong correlation (r > 0.9) for 10/35 metabolites vs. reference [3] | High reproducibility (<5% CV for quantified metabolites) [80] | Inter-method validation |
| Sample Volume Requirements | 10 μL urine (50-fold dilution) [3] | 300 μL serum/plasma [44] | Standard protocol comparison |
| Dynamic Range | ~4 orders of magnitude [3] | ~3 orders of magnitude [3] | Calibration curve assessment |
Complementary Strengths and Applications
UPLC-MS and NMR serve complementary roles in analytical laboratories. UPLC-MS excels in sensitivity and specificity for targeted analysis of low-abundance metabolites, particularly when using multiple reaction monitoring (MRM) or high-resolution mass detection [3] [46]. For example, in salivary analysis, LC-MS/MS quantified 24 bioactive lipids and 2 endocannabinoids that were undetectable by NMR [46].
NMR spectroscopy demonstrates superior reproducibility, direct quantitative capability without need for compound-specific calibration, and structural elucidation power [3] [44] [80]. A key advantage is that NMR "does not rely on identical reference materials for quantification" and requires minimal method development [80].
The techniques' complementary nature is evident in studies comparing serum and plasma, where NMR effectively quantified lipoproteins, lipids, lactate, glutamine, and glucose, while UPLC-MS provided data on specific phospholipids and linoleic acid [44].
Experimental Protocols for Method Validation
Protocol 1: UPLC-HRMS Method for Urinary Metabolites
This protocol follows ICH Q2(R2) validation principles as applied in comparative metabolic phenotyping studies [3]:
Sample Preparation: Thaw urine samples and pipette 10 μL in randomized order into deep-well plates. Dilute 50-fold with ultrapure water. Transfer 50 μL aliquots to well plates, adding 25 μL of multianalyte mixture of labeled internal standards prepared in methanol. Adjust total volume to 150 μL with methanol (final water-methanol proportion 1:2) [3].
Calibration Standards: Prepare multianalyte mixture of nonlabeled calibration standards at different concentration levels by mixing stock solutions in a total volume of 10 mL. Use pooled urine samples for preparation of study reference samples, validation QC samples, and calibration series to account for matrix effects [3].
UPLC-HRMS Analysis: Employ reversed-phase UPLC coupled to high-resolution mass spectrometry. The total run time for measuring a sample set of 132 samples in both polarities was approximately 5 days. Use full-scan HRMS profiles for exploratory analysis and targeted extraction of ions for quantitative analysis of selected metabolites [3].
Validation Parameters: Assess accuracy using Pearson's correlation (r > 0.9 indicating strong correlation) and Passing-Bablok regression. Evaluate agreement between methods using Bland-Altman plots. Determine precision through blinded duplicate sample analysis [3].
Protocol 2: Quantitative NMR (qNMR) for Metabolite Analysis
This protocol implements ICH Q2(R2) validation for NMR-based quantification, as demonstrated in steroid and salivary metabolite analysis [46] [80]:
Sample Preparation: For saliva/serum/plasma: Prepare samples using ultrafiltration (3 kDa cutoff) to remove macromolecules. Mix 300 μL of sample with 300 μL of phosphate buffer in NMR tubes. For solid samples (e.g., pregnenolone): Dissolve in appropriate deuterated solvent (e.g., DMSO-d6) [46] [80].
NMR Acquisition: Record 1H NMR standard 1D (NOESYPR1D) with water pre-saturation and CPMG spectra on a 600 MHz NMR spectrometer. Standard parameters: 32 scans, 4 dummy scans, 10 ms mixing time, 96k data points, temperature of 310K. For quantitative NMR, use relaxation delay ≥5×T1 (longest longitudinal relaxation time) to ensure complete relaxation between pulses [44] [80].
Spectral Processing: Apply Fourier transformation, phase correction, and baseline correction. Reference spectra to internal standard (e.g., TSP at 0.0 ppm). Perform probabilistic quotient normalization to account for dilution effects [44].
Validation Parameters: Demonstrate precision and accuracy at target analytical concentration (e.g., 2.0 mg/mL for pregnenolone). Validate method for linearity across working range (0.032-3.2 mg/mL), specificity, and robustness per ICH Q2(R1) guidelines [80].
Research Reagent Solutions and Essential Materials
Table 2: Essential Research Reagents for UPLC-MS and NMR Metabolomics
| Category | Specific Reagents/Materials | Function | Application |
|---|---|---|---|
| Chromatography | Reverse phase & HILIC columns | Compound separation | UPLC-MS [44] |
| Internal Standards | Labeled internal standards (e.g., deuterated analogs) | Quantification reference | UPLC-MS [3] |
| Sample Preparation | Amicon Ultra-0.5 (3 kDa cutoff) centrifugal filters | Macromolecule removal | NMR sample prep [46] |
| NMR Reagents | D2O, TSP, phosphate buffer | Field locking, referencing, pH control | NMR spectroscopy [46] [44] |
| Solvents | HPLC-grade methanol, acetonitrile, isopropanol | Sample extraction, mobile phase | Both techniques [3] [44] |
| Calibration Standards | Multianalyte mixture of nonlabeled calibration standards | Quantitative calibration | Both techniques [3] |
Strategic Implementation within ICH Q2(R2) Framework
Validation Characteristics Assessment
The following diagram illustrates the decision pathway for selecting and validating analytical procedures according to ICH Q2(R2):
Analytical Lifecycle Management Under ICH Q2(R2) and Q14
The implementation of ICH Q2(R2) should be integrated with ICH Q14 "Analytical Procedure Development" to establish a complete analytical procedure lifecycle approach [79] [81]. Recent industry surveys indicate that successful implementation requires:
- Adopting science- and risk-based approaches to analytical procedure development and validation [81]
- Developing Analytical Target Profiles (ATP) that define required procedure performance characteristics [79]
- Establishing multivariate models for complex analytical procedures [79]
- Implementing knowledge management systems to support ongoing procedure verification [81]
Both UPLC-MS and NMR spectroscopy offer validated pathways for metabolite quantification when properly implemented within the ICH Q2(R2) framework. UPLC-MS provides superior sensitivity and throughput for targeted analysis, while NMR offers unmatched reproducibility and direct quantification capability without extensive calibration. The techniques demonstrate complementary strengths in metabolic phenotyping studies, with the optimal choice dependent on the specific analytical requirements, sample matrix, and target metabolites.
Recent implementations of ICH Q2(R2) emphasize a risk-based approach to validation, encouraging developers to justify which validation characteristics are most critical for their specific analytical procedure [79] [81]. This flexibility allows researchers to tailor their validation strategies while maintaining scientific rigor, ensuring that both UPLC-MS and NMR methods generate reliable, high-quality data for pharmaceutical development and clinical research.
In the field of analytical technique validation, establishing correlation between orthogonal technologies represents a significant challenge and opportunity for advancing pharmaceutical research. Ultra-Performance Liquid Chromatography coupled to Mass Spectrometry (UPLC-MS) and Nuclear Magnetic Resonance (NMR) spectroscopy stand as two pillars of modern metabolomics and drug development analytics, yet they operate on fundamentally different physical principles [82]. UPLC-MS offers exceptional sensitivity, capable of detecting metabolites at femtomole levels, while NMR provides unparalleled structural elucidation power and intrinsic quantitative capabilities without requiring compound-specific standardization [4] [39]. The integration of these platforms has evolved from hardware-coupled systems to sophisticated data correlation approaches that leverage the complementary strengths of each technique while acknowledging their inherent limitations in sensitivity, throughput, and structural elucidation capabilities [4] [83].
The fundamental challenge in cross-platform analysis stems from the contrasting nature of these techniques. As clearly stated in the literature, "MS can provide the molecular weight and formula of a compound, but only reveals some structural features. NMR, on the other hand, can be used to reveal the entire structure of a compound" [82]. This complementary relationship drives the need for correlation strategies that can bridge the sensitivity gap—where MS detects compounds at extremely low concentrations that would be invisible to NMR—while leveraging NMR's definitive structural characterization capabilities for unambiguous compound identification [4]. Recent advancements in both instrumentation and data processing have created new opportunities for validating analytical measurements across these platforms, particularly through standardized sample preparation protocols and mathematical correlation approaches that do not require physical hyphenation of the instruments [39] [83].
Analytical Performance Comparison
Table 1: Fundamental technical characteristics of UPLC-MS and NMR platforms
| Parameter | UPLC-MS | NMR |
|---|---|---|
| Limit of Detection | Femtomole range (10â»Â¹Â³ mol) [4] | Microgram range (10â»â¹ mol) [4] |
| Structural Information | Molecular mass, formula, fragmentation patterns [82] [4] | Complete structural elucidation, stereochemistry [82] [4] |
| Quantitation | Requires internal standards, subject to ionization efficiency variations [84] [4] | inherently quantitative without compound-specific standards [4] [80] |
| Sample Throughput | Moderate to high (minutes per sample) [4] | Low to moderate (minutes to hours per sample) [4] |
| Isomer Differentiation | Limited capability [4] [27] | Excellent for isomers, stereoisomers, and conformers [27] |
| Matrix Effects | Susceptible to ion suppression/enhancement [4] | Minimal matrix effects [4] |
Table 2: Experimental cross-platform correlation performance in metabolomic studies
| Study Context | Correlation Metrics | Platforms Compared | Key Findings |
|---|---|---|---|
| Liver Fibrosis in HCV Patients | 20 metabolites measured over 500-fold concentration range; mean bias: 9.5% [85] | MSI-CE-MS vs. NMR [85] | Independent replication confirmed elevated choline and histidine in late-stage fibrosis [85] |
| Serum Metabolomics | Number of routinely detected metabolites | NMR vs. MSI-CE-MS [85] | NMR: 30 metabolites; MSI-CE-MS: 60 metabolites [85] |
| Methodology | Technical precision (median CV) | NMR vs. MSI-CE-MS [85] | Both platforms: <10% CV [85] |
| ICP Diagnostic Biomarkers | Diagnostic performance (AUROC) | ¹H-NMR screening with UPLC-MS/MS validation [19] | Combined choline/dimethylglycine model: AUROC=0.88 [19] |
The performance data reveals a compelling narrative about the complementary nature of these platforms. In direct comparison studies, both techniques demonstrate excellent technical precision with median coefficients of variation below 10%, indicating robust analytical performance within their respective domains [85]. The substantially higher metabolome coverage of UPLC-MS-based techniques (60 metabolites versus 30 for NMR in serum analysis) highlights its advantage for comprehensive profiling, while NMR's strengths lie in definitive identification and absolute quantification [85]. Most significantly, when both platforms measure the same metabolites across extensive concentration ranges, they achieve remarkable agreement with a mean bias of only 9.5%, providing strong evidence for cross-platform comparability in quantitative metabolomics [85].
Experimental Protocols for Cross-Platform Analysis
Integrated Serum Sample Preparation for Sequential NMR and UPLC-MS Analysis
The development of a unified sample preparation protocol that accommodates both NMR and UPLC-MS requirements represents a significant advancement in cross-platform metabolomics [39]. Traditional approaches utilized separate aliquots and preparation methods for each technique, introducing unnecessary variability and complicating data correlation. The integrated protocol involves:
Protein Removal: Serum samples undergo protein precipitation using methanol (4:1 solvent-to-serum ratio) followed by overnight incubation at -20°C and centrifugation at 13,000 rpm for 10 minutes [84] [39]. Alternatively, molecular weight cut-off (MWCO) filtration can be employed, with both methods demonstrating effective protein removal while maintaining metabolite integrity [39].
Solvent Considerations: For cross-platform compatibility, deuterated buffers (e.g., Dâ‚‚O phosphate buffer) are used for NMR compatibility while demonstrating no significant deuterium incorporation into metabolites that would affect MS interpretation [39]. This critical finding resolves a major theoretical concern in sequential analysis.
Sample Division: The resulting supernatant or filtrate is divided for sequential analysis, with NMR analysis typically performed first due to its non-destructive nature, followed by UPLC-MS analysis of the same sample [39].
This integrated approach has been experimentally validated, showing that "LC-MS compound-feature abundances are minimally affected by NMR buffers and protein removal" [39], enabling true sequential analysis from a single serum aliquot.
UPLC-MS Analytical Conditions for Cross-Platform Studies
Standardized UPLC-MS protocols are essential for generating reproducible data that can be correlated with NMR findings:
Chromatography: Employ ACQUITY UPLC BEH C8 or C18 columns (1.0 × 100 mm, 1.7 μm) with gradient elution using water-acetonitrile or water-methanol mobile phases containing 0.1% formic acid [84] [86]. Typical gradient times range from 3.0 minutes for high-throughput applications to 8.5 minutes for higher resolution separations [27].
Mass Spectrometry: Time-of-flight (TOF) mass analyzers provide high-resolution exact mass measurements essential for elemental composition determination, while tandem mass spectrometry (MS/MS) generates structural fragmentation patterns [84]. Typical settings include ESI positive/negative ion switching mode, desolvation temperature of 300-500°C, and cone voltage of 20-40 V [84].
Quantitation: Stable isotope-labeled internal standards enable precise quantification, with typical linear ranges of 0.05–50.00 ng/mL for drug compounds and their metabolites [86].
NMR Spectroscopy Conditions for Metabolite Identification and Quantification
NMR protocols for cross-platform studies must balance sensitivity requirements with throughput considerations:
Sample Configuration: Utilize 1.7 mm or 3 mm NMR tubes with cryoprobes or microcoil probes to maximize sensitivity with limited sample volumes [27]. Typical sample concentrations of 0.03-3.2 mg/mL provide sufficient signal-to-noise while maintaining reasonable acquisition times [80].
Data Acquisition: Employ 1D ¹H NMR with water suppression (e.g., presat, NOESY-presat, or CPMG pulse sequences) for metabolite profiling, typically acquiring 64-256 transients over 10-30 minute acquisition periods [19] [85]. For structural elucidation, 2D experiments including ¹H-¹³C HSQC, HMBC, and TOCSY may be required, extending acquisition times to several hours [80] [83].
Quantitative NMR (qNMR): Implement validated qNMR protocols following ICH Q2(R1) guidelines using internal calibrants such as maleic acid or DSS for absolute quantification [80]. The method demonstrates excellent precision and accuracy at analytical concentrations of 2.0 mg/mL with linear ranges spanning 0.032 to 3.2 mg/mL [80].
Advanced Data Correlation Strategies
Mathematical Correlation Approaches
Beyond physical hyphenation, advanced mathematical approaches enable correlation of data from separate UPLC-MS and NMR analyses:
SCORE-Metabolite-ID Framework: This semi-automatic correlation analysis links NMR signals with associated mass-to-charge ratios through the third dimension of chromatographic fractionation time courses [83]. The method generates Extracted Delta Chromatograms (EDCs) for NMR signals and Extracted Mass Chromatograms (EMCs) for MS data, then calculates Pearson correlation coefficients to identify signals originating from the same compound [83].
Statistical Heterospectroscopy (SHY): This statistical approach correlates NMR and MS spectral features across large sample sets, identifying covarying signals that may represent the same molecular species or biologically linked metabolites [83].
Multiplatform Workflow Integration: Automated structure verification platforms integrate UPLC-MS and NMR data through customized software solutions that compare experimental results with predicted fragmentation patterns and NMR chemical shifts [27].
Essential Research Reagent Solutions
Table 3: Key reagents and materials for cross-platform metabolomic studies
| Reagent/Material | Function in Workflow | Technical Specifications | Application Notes |
|---|---|---|---|
| Deuterated Solvents | NMR compatibility while maintaining MS integrity [39] | Dâ‚‚O phosphate buffer; deuterated acetonitrile for LC [4] [39] | Prevents solvent interference in NMR; minimal deuterium incorporation observed in MS [39] |
| Ultrafiltration Devices | Protein removal for MS compatibility [39] [85] | Molecular weight cut-off filters (3-10 kDa) [85] | Maintains metabolite integrity while removing proteins that interfere with MS ionization [39] |
| Stable Isotope Standards | Internal standards for MS quantification [84] [86] | ¹³C, ¹âµN, or ²H-labeled metabolite analogs [84] | Corrects for ionization efficiency variations in MS; enables absolute quantification [86] |
| qNMR Reference Standards | Internal calibrants for quantitative NMR [80] | Maleic acid, DSS, or TSP in deuterated solvent [80] | Provides chemical shift reference and enables absolute quantification without compound-specific standards [80] |
| UPLC Columns | Metabolic separation prior to detection [84] [27] | ACQUITY UPLC BEH C8/C18 (1.7 μm, 1.0 × 100 mm) [84] | Provides high-resolution separation of complex metabolite mixtures with MS-compatible mobile phases [84] |
The correlation of UPLC-MS and NMR data represents a powerful validation strategy that leverages the complementary strengths of both analytical platforms. Through standardized sample preparation protocols that enable sequential analysis from a single aliquot [39], and advanced mathematical correlation approaches that link spectral features without requiring physical hyphenation [83], researchers can achieve a level of analytical confidence unattainable with either technique alone. The experimental evidence demonstrates that with proper methodological controls, these platforms can achieve remarkable quantitative agreement (mean bias of 9.5%) while expanding metabolome coverage and providing orthogonal validation of biomarker candidates [85].
The integration of UPLC-MS and NMR continues to evolve toward greater automation and higher throughput, with emerging platforms demonstrating the feasibility of obtaining both MS and NMR data from microscale synthesis (3.0-75.0 μmol) without compromising biological testing material [27]. As these technologies advance, the pharmaceutical industry moves closer to a comprehensive analytical validation paradigm where cross-platform comparability becomes standard practice rather than specialized expertise, ultimately accelerating drug development through more reliable metabolite identification and quantification.
In the evolving landscape of automated analytical laboratories, the selection and validation of appropriate techniques are fundamental to ensuring data quality, regulatory compliance, and operational efficiency. Ultra-Performance Liquid Chromatography-Mass Spectrometry (UPLC-MS) and Nuclear Magnetic Resonance (NMR) spectroscopy represent two powerful platforms with distinct capabilities and validation profiles. As the industry moves toward higher throughput and greater automation—with the lab automation market projected to grow from $5.2 billion in 2022 to $8.4 billion by 2027—understanding the comparative performance characteristics of these techniques becomes increasingly critical for researchers, scientists, and drug development professionals [1]. This guide provides an objective comparison of UPLC-MS and NMR across four key validation parameters—accuracy, precision, linearity, and robustness—within the context of modern automated research environments, supported by experimental data and detailed methodologies.
Comparative Analysis of UPLC-MS and NMR Validation Parameters
The following comparison examines the core validation parameters for UPLC-MS and NMR spectroscopy based on experimental data from recent studies.
Table 1: Comparison of Key Validation Parameters for UPLC-MS and NMR
| Validation Parameter | UPLC-MS Performance Characteristics | NMR Performance Characteristics | Comparative Experimental Findings |
|---|---|---|---|
| Accuracy | High accuracy for targeted analysis; affected by matrix effects and ionization efficiency [4] | Inherently quantitative; minimal matrix effects; provides absolute quantification [4] [26] | NMR outperforms for absolute quantification without standards; UPLC-MS shows strong correlation (r > 0.9) for targeted metabolites when using proper calibration [3] |
| Precision | High precision with RSD typically <10% in optimized methods; autosamplers enhance reproducibility [87] [1] | Excellent precision due to non-destructive nature and stable instrumentation; highly reproducible across platforms [4] [26] | Both techniques demonstrate acceptable precision (<10-14% RSD); UPLC-MS slightly more variable due to sample preparation and ionization fluctuations [87] [9] |
| Linearity | Wide dynamic range (4-6 orders of magnitude); demonstrated R² > 0.995 in validated methods [88] [87] | Excellent linearity with wide dynamic range (up to 10âµ); inherently proportional response [4] [9] | Both techniques show excellent linearity; UPLC-MS requires compound-specific calibration, while NMR provides natural linear response [87] [9] |
| Robustness | Sensitive to mobile phase composition, matrix effects, and source contamination; improved with automation [89] [1] | Highly robust; minimal sample preparation required; unaffected by chromatographic variations [9] [26] | NMR demonstrates superior robustness against methodological variations; UPLC-MS robustness enhanced through standardized protocols and automation [9] [1] |
| Sensitivity | Exceptional sensitivity (LODs in femtomole range for many analytes) [4] [89] | Moderate sensitivity (LODs typically in nanomole range) [4] [26] | UPLC-MS provides 100-1000x lower detection limits; NMR sensitivity improved with cryoprobes and microcoils [4] |
| Throughput | High-throughput capability (2-5 minutes per sample in UHPLC-MS); amenable to automation [89] [1] | Moderate throughput (minutes to hours per sample depending on experiment) [4] | UPLC-MS offers significantly faster analysis; NMR throughput improved with flow systems and automation [3] [1] |
Experimental Protocols and Methodologies
UPLC-MS Method Validation Protocol
Recent studies demonstrate standardized approaches for UPLC-MS method validation. The development of a UPLC-MS method for serum arachidonic acid quantification exemplifies a typical validation workflow [87]. The method employed a Waters Acquity UPLC system coupled with a QDa mass spectrometer. Separation was achieved using a C18 column (100 × 2.1 mm, 1.7 μm) with a gradient elution of 0.1% formic acid in water (mobile phase A) and acetonitrile (mobile phase B) at a flow rate of 0.4 mL/min. Sample preparation involved protein precipitation followed by liquid-liquid extraction [87].
Validation followed ICH M10 guidelines, assessing:
- Accuracy and Precision: Evaluated using quality control samples at multiple concentrations with RSD values between 6-14% across intra-day and inter-day experiments [87].
- Linearity: Demonstrated R² = 0.9952 for solvent-based calibration and R² = 0.9979 for matrix-matched calibration across the range of 0.5-5.0 μg/mL [87].
- Robustness: Assessed by varying column temperature (±2°C), flow rate (±0.05 mL/min), and mobile phase composition (±2%) [87].
Another study on ketoconazole impurity quantification using LC-TQ-MS/MS highlighted validation parameters including LOD (0.046 μg/mL) and LOQ (0.133 μg/mL), further confirming the precision of UPLC-MS methods with RSD <10% [88].
NMR Method Validation Protocol
For NMR validation, a GMP-compliant approach focuses on different parameters reflective of the technique's strengths [9]. A standardized protocol for serum analysis using NMR illustrates the methodology: samples were prepared with deuterated phosphate buffer (pH 7.4) in a 96-well format, and 1D 1H NMR spectra were acquired on a 600 MHz spectrometer at 300K [39].
Validation included:
- Specificity: Assessed through the ability to distinguish individual metabolites in complex mixtures based on chemical shift dispersion [9] [26].
- Precision and Robustness: Evaluated through repeated measurements of quality control samples, demonstrating high reproducibility due to NMR's stability and minimal sample preparation requirements [39] [9].
- Linearity and Quantitative Performance: Verified using standard addition methods with certified reference materials, confirming NMR's inherent quantitative capabilities without need for compound-specific calibration curves [9] [26].
The compatibility of NMR samples with subsequent LC-MS analysis has been successfully demonstrated, highlighting the potential for sequential multi-platform analysis from a single sample preparation [39].
Integration in Automated Workflows
Automation represents a transformative trend in analytical laboratories, impacting both UPLC-MS and NMR methodologies. Recent presentations at HPLC 2025 highlighted developments including "AI-powered liquid chromatography systems that optimize gradients autonomously" and "robotic systems linking multiple labs to centralized LC-MS and NMR platforms" [1].
Table 2: Essential Research Reagent Solutions for UPLC-MS and NMR Analysis
| Reagent/Material | Function in UPLC-MS | Function in NMR | Application Notes |
|---|---|---|---|
| Deuterated Solvents (e.g., D₂O, CD₃OD) | Limited use due to cost; may be used in mobile phase for specialized LC-MS-NMR applications [4] | Essential for field frequency locking; prevents solvent signal interference [4] [39] | D₂O relatively inexpensive; organic deuterated solvents costly but required for full deuterium lock [4] |
| LC-MS Grade Solvents | Essential for minimal background noise and ionization suppression [88] [87] | Not required for NMR-specific applications | High purity critical for sensitivity; formic acid/ammonium formate common additives [88] |
| Internal Standards | Isotopically labeled analogs for quantification; corrects for matrix effects [3] [87] | Chemical shift reference compounds (e.g., TSP, DSS); quantification standards [39] [26] | Selection crucial for accurate quantification; should be non-interfering and stable [3] |
| GMP Reference Standards | Required for system suitability and method validation [88] [9] | Essential for identity confirmation and quantitative applications [9] | Certified purity and stability critical for regulatory compliance [9] |
The integration of UPLC-MS and NMR in automated environments is exemplified by workflows developed at AstraZeneca, where "robotic systems link multiple chemistry labs to centralized LC-MS and NMR platforms, supporting high-throughput synthesis, predictive modeling, and compound characterization" [1]. Such integrations demonstrate how the complementary strengths of both techniques can be leveraged in drug discovery pipelines.
Figure 1: Integrated UPLC-MS and NMR Automated Workflow for Comprehensive Metabolite Analysis
UPLC-MS and NMR spectroscopy offer complementary capabilities in automated analytical laboratories, with distinct advantages across key validation parameters. UPLC-MS demonstrates superior sensitivity, throughput, and dynamic range, making it ideal for targeted analysis of low-abundance metabolites in high-throughput environments. Conversely, NMR provides inherent quantitative capabilities, exceptional robustness, and non-destructive analysis, enabling structural elucidation and absolute quantification without compound-specific standards. The integration of both techniques in automated workflows, facilitated by data fusion strategies and robotic systems, represents the future of comprehensive metabolite analysis in drug development and clinical research. As automation continues to transform analytical laboratories, understanding these complementary validation profiles enables researchers to strategically deploy each technique to maximize analytical capabilities while maintaining regulatory compliance.
Green and Sustainable Analytical Chemistry (GAC) Metrics for Method Assessment
Green Analytical Chemistry (GAC) aims to minimize the environmental impact of analytical procedures while maintaining their effectiveness. The core of GAC is built upon 12 foundational principles that provide a roadmap for developing sustainable methods, focusing on reducing or eliminating hazardous substances, minimizing energy consumption, and prioritizing safety for operators and the environment [90] [91]. To translate these principles into practical assessments, the scientific community has developed several standardized metrics that allow researchers to quantitatively evaluate and compare the greenness of their analytical methods.
The proliferation of GAC metrics has created a need for clear comparison guides. Currently, more than 15 distinct assessment tools are in use, each with unique characteristics, scoring mechanisms, and output formats [90]. These include the National Environmental Methods Index (NEMI), Analytical Eco-Scale, Green Analytical Procedure Index (GAPI), Analytical GREENness Calculator (AGREE), and the more recently developed Greenness Evaluation Metric for Analytical Methods (GEMAM) [90] [91]. The selection of an appropriate metric depends on multiple factors, including the analytical technique being evaluated, the desired output format (qualitative or quantitative), and the specific aspects of greenness being prioritized.
Table 1: Overview of Major GAC Metrics and Their Key Characteristics
| Metric Name | Assessment Type | Output Format | Key Strengths | Primary Limitations |
|---|---|---|---|---|
| NEMI | Qualitative | Pictogram (4 quadrants) | Simple, visual | Limited scope, binary assessment |
| Analytical Eco-Scale | Quantitative | Numerical score (0-100) | Penalty point system, intuitive scoring | Complex calculation, no pictogram |
| GAPI | Qualitative | Pictogram (5 pentagons) | Comprehensive lifecycle assessment | Qualitative only |
| AGREE | Quantitative | Numerical score (0-1) & colored pictogram | Incorporates all 12 GAC principles | Requires specialized software |
| GEMAM | Quantitative | Numerical score (0-10) & hexagonal pictogram | Comprehensive, covers 21 criteria across 6 sections | Relatively new metric [91] |
Comparative Analysis of GAC Metrics
Traditional GAC Metrics: NEMI, Eco-Scale, and GAPI
The National Environmental Methods Index (NEMI) is one of the earliest and simplest GAC metrics. It employs a four-quadrant pictogram where each quadrant represents a different environmental criterion: persistent/bioaccumulative/toxic chemicals, corrosive pH, hazardous waste generation, and resource consumption. While its simplicity facilitates quick assessments, NEMI's binary (pass/fail) approach and limited scope restrict its utility for comprehensive method comparisons [90].
The Analytical Eco-Scale offers a more nuanced approach through a penalty point system. Starting from a perfect score of 100, points are deducted for hazardous reagents, energy consumption, waste generation, and operator risk. Higher final scores indicate greener methods. This metric provides valuable quantitative data but involves complex calculations and lacks a visual pictogram for quick reference [91].
The Green Analytical Procedure Index (GAPI) expands assessment coverage through a five-segment pictogram that evaluates environmental impact across the entire analytical method lifecycle. Each segment addresses different stages: sample collection, preservation, transportation, preparation, and analysis. GAPI provides more comprehensive evaluation than NEMI but remains primarily qualitative in nature, limiting its utility for precise comparisons [90].
Advanced GAC Metrics: AGREE and GEMAM
The Analytical GREENness Calculator (AGREE) represents a significant advancement by incorporating all 12 GAC principles into its assessment framework. It generates both a quantitative score (0-1) and a circular pictogram with 12 colored sections, providing immediate visual feedback on method performance across all GAC principles. AGREE requires specialized software but offers one of the most comprehensive evaluations currently available [90].
The newly proposed Greenness Evaluation Metric for Analytical Methods (GEMAM) builds upon previous metrics by evaluating 21 specific criteria across six key sections: sample, reagent, instrument, method, waste, and operator impact [91]. It employs a weighting system that allows users to prioritize different environmental aspects based on their specific applications. GEMAM produces both a numerical score (0-10) and a hexagonal pictogram, offering both quantitative and qualitative assessment capabilities.
Table 2: Scoring Criteria and Output Comparison of Major GAC Metrics
| Metric | Scoring System | Calculation Complexity | Pictogram Features | Weighting Flexibility |
|---|---|---|---|---|
| NEMI | Binary (pass/fail) | Low | 4 colored quadrants | No |
| Analytical Eco-Scale | Deductive (from 100) | High | None | No |
| GAPI | Qualitative | Medium | 5 colored pentagons | No |
| AGREE | 0-1 scale | Medium | 12-section circle | Yes |
| GEMAM | 0-10 scale | Medium-High | 7 hexagons | Yes (21 criteria, 6 sections) [91] |
GAC Assessment of UPLC-MS and NMR Platforms
UPLC-MS Greenness Profile
Ultra-Performance Liquid Chromatography-Mass Spectrometry (UPLC-MS) demonstrates variable greenness performance across different GAC metrics. The technique's primary environmental drawbacks include substantial solvent consumption (particularly acetonitrile and methanol), high energy requirements for operation, and hazardous waste generation. However, recent advancements have significantly improved its environmental profile.
Method optimization strategies can substantially enhance UPLC-MS greenness scores. Miniaturization of columns and reduction of flow rates decrease solvent consumption, while switch to green solvents like ethanol or acetone when compatible with analytical requirements can reduce environmental impact [91]. The development of sub-2μm particle columns enables faster separations, reducing both analysis time and solvent consumption. Automated method validation software further contributes to greenness by minimizing trial runs and optimizing resource utilization [92].
NMR Spectroscopy Greenness Profile
Nuclear Magnetic Resonance (NMR) spectroscopy presents a distinct environmental profile compared to UPLC-MS. While the technique offers minimal solvent consumption per analysis when optimized and generates less chemical waste, its most significant environmental limitation is extraordinary energy consumption required to maintain superconducting magnets. This substantial energy use negatively impacts its performance across multiple GAC metrics.
Recent developments have improved NMR's greenness credentials. The adoption of deuterated solvent recycling protocols addresses one of the method's major cost and waste issues [4]. Implementation of cryoprobes and microprobes enhances sensitivity, allowing for reduced sample quantities and analysis times [4]. The technique's inherent quantitative capabilities and non-destructive nature enable comprehensive analysis from single injections, reducing overall resource consumption [4] [76].
Comparative Greenness Assessment
Direct comparison of UPLC-MS and NMR through GAC metrics reveals a complex trade-off scenario where neither technique universally outperforms the other across all environmental criteria. UPLC-MS typically demonstrates advantages in energy efficiency but struggles with solvent-related impacts. NMR offers superior performance regarding solvent consumption and waste generation but is penalized for energy intensity.
The complementary nature of these techniques extends to their greenness profiles. Research demonstrates that integrated LC-MS-NMR platforms can leverage the strengths of both techniques while mitigating their individual environmental limitations [4]. Stop-flow approaches and automated loop collection systems optimize resource utilization by ensuring that NMR analysis is only performed on fractions of confirmed interest [4].
Diagram 1: GAC Assessment Workflow for UPLC-MS and NMR Techniques. The flowchart illustrates the systematic evaluation process, highlighting technique-specific environmental factors.
Experimental Protocols for GAC Assessment
Standardized GAC Evaluation Protocol
Implementing consistent GAC assessment requires standardized protocols that ensure comparable results across different laboratories and techniques. The following procedure outlines a comprehensive approach suitable for evaluating both UPLC-MS and NMR methods:
Sample Preparation Assessment: Document all materials, solvents, and quantities used in sample preparation. For UPLC-MS, this includes extraction solvents, filtration methods, and derivatization reagents. For NMR, this encompasses deuterated solvents, internal standards, and buffer systems. Evaluate each component against GAC criteria, prioritizing solvent toxicity, renewable resources, and miniaturization potential [91] [76].
Instrumental Analysis Profiling: Monitor and record all instrument parameters affecting environmental impact. For UPLC-MS systems, document mobile phase composition, flow rates, analysis duration, and column dimensions. For NMR spectrometers, record magnetic field strength, acquisition time, number of transients, and probe type. Calculate energy consumption per analysis using manufacturer specifications or direct measurement [91].
Waste Stream Characterization: Quantify all waste generated during analysis, including organic solvents, aqueous solutions, solid waste, and packaging materials. Categorize waste according to environmental hazard classifications and document disposal methods. This data directly impacts multiple GAC metrics, particularly those with dedicated waste assessment criteria [91].
Data Analysis and Scoring: Input collected data into selected GAC metric calculators (AGREE, GEMAM, etc.). For comparative studies, maintain consistent weighting factors across all evaluated methods. Generate both numerical scores and visual outputs (pictograms) for comprehensive reporting. Perform sensitivity analysis to identify parameters with greatest impact on overall greenness score [90] [91].
Case Study: Botanical Authentication Methods
Recent research on botanical ingredient authentication provides experimental data for direct comparison of UPLC-MS and NMR greenness profiles. The study optimized extraction methodologies across nine botanical taxa, including Camellia sinensis (tea), Cannabis sativa, and Myrciaria dubia (camu camu) [76].
Extraction Protocol: Samples (50-300 mg) were extracted with 1-2 mL of various solvents, including methanol, methanol-deuterium oxide mixtures, and other solvent systems. The extraction process involved homogenization followed by solvent extraction optimized for both NMR and LC-MS compatibility [76].
Analysis Conditions: NMR analysis employed a 400 MHz spectrometer with standardized parameters (0.01 ppm bin size). UPLC-MS utilized reverse-phase separation with sub-2μm particle columns and acetonitrile/water gradients with 0.1% formic acid [76].
Greenness Assessment Data: The study documented comprehensive resource consumption data enabling GAC metric application. Methanol (with 10% deuterated methanol for NMR) was identified as the optimal extraction solvent, providing broad metabolite coverage while minimizing environmental impact compared to alternative solvent systems [76].
Table 3: Experimental Data for GAC Assessment from Botanical Authentication Study [76]
| Parameter | UPLC-MS Analysis | NMR Analysis |
|---|---|---|
| Sample Mass | 50-300 mg | 50-300 mg |
| Extraction Solvent Volume | 1-2 mL | 1-2 mL |
| Primary Solvent | Methanol (100%) | Methanol with 10% CD₃OD |
| Analysis Time per Sample | 10-20 minutes | 5-10 minutes |
| Metabolite Coverage | 121 metabolites in Myrciaria dubia | 155-198 spectral variables |
| Solvent Waste per Analysis | ~2-4 mL | ~1-2 mL |
| Energy Consumption | Moderate | High (magnet maintenance) |
The Scientist's Toolkit: Essential Research Reagents and Materials
Implementing green analytical methods requires careful selection of reagents and materials that minimize environmental impact while maintaining analytical performance. The following toolkit highlights essential components for sustainable UPLC-MS and NMR workflows:
Solvent Systems: Methanol-water mixtures represent a greener alternative to acetonitrile-based mobile phases in UPLC-MS when method compatibility allows [91] [76]. For NMR, deuterated methanol (CD₃OD) with minimal protonated cosolvent provides excellent spectral quality while reducing consumption of expensive deuterated reagents [4] [76]. Solvent recycling systems significantly reduce waste generation and resource consumption for both techniques.
Extraction Materials: Reduced-scale extraction devices enable miniaturization of sample preparation, directly aligning with GAC principles [91]. In-line filtration systems eliminate the need for single-use filter units, reducing solid waste. Reusable extraction vessels manufactured from durable materials like PEEK or stainless steel offer sustainable alternatives to disposable glassware.
Analytical Columns and Consumables: For UPLC-MS, sub-2μm particle columns provide superior separation efficiency, enabling shorter run times and reduced solvent consumption [92]. Longevity-optimized column chemistries maintain performance over extended operational lifetimes. For NMR, cryoprobes and microprobes dramatically enhance sensitivity, allowing reduced sample requirements and analysis times [4].
Automation and Integration Tools: Automated liquid handling systems improve reagent dispensing precision, reducing consumption and waste [93]. Method validation software minimizes method development resources through optimized experimental design [92]. Integrated LC-MS-NMR platforms enable comprehensive analysis from single sample injections, significantly reducing overall resource consumption [4].
The comprehensive assessment of UPLC-MS and NMR techniques through Green Analytical Chemistry metrics reveals that neither technique universally outperforms the other across all environmental criteria. Each method demonstrates distinct greenness profiles characterized by complementary strengths and limitations. UPLC-MS excels in energy efficiency during operation but faces challenges with solvent-related environmental impacts. Conversely, NMR spectroscopy offers advantages in solvent consumption and waste generation but is impacted by substantial energy requirements for magnet maintenance.
The implementation of GAC metrics provides researchers with standardized frameworks for quantifying and comparing the environmental performance of analytical methods. Advanced metrics like AGREE and GEMAM offer particularly comprehensive assessment capabilities through their incorporation of multiple environmental factors and weighting systems [90] [91]. As analytical science continues to evolve, the integration of GAC principles into method development and validation processes will play an increasingly critical role in promoting sustainable scientific practices while maintaining analytical excellence.
Future directions in green analytical chemistry will likely focus on the development of integrated hyphenated techniques that maximize analytical information obtained per unit of environmental impact [4], the creation of automated assessment tools that streamline greenness evaluations [92], and the establishment of standardized environmental reporting requirements for analytical publications. Through continued refinement of GAC metrics and their application to technique selection and optimization, researchers can significantly reduce the environmental footprint of analytical chemistry while advancing scientific knowledge.
The quantification of genotoxic impurities (GTIs) in active pharmaceutical ingredients (APIs) is a critical aspect of pharmaceutical quality control, demanding methods of exceptional sensitivity and specificity. This case study provides a objective comparison of two leading analytical techniques: Ultra-Performance Liquid Chromatography-Mass Spectrometry (UPLC-MS) and Nuclear Magnetic Resonance (NMR) spectroscopy. Within the broader context of analytical technique validation and automation research, we evaluate a validated UPLC-MS method for quantifying GTIs in a novel P2Y12 receptor antagonist (TSD-1) [94], comparing its performance with NMR's capabilities where appropriate. This guide synthesizes experimental data and protocols to support scientists in selecting the optimal methodology for their impurity profiling needs.
Analytical Technique Comparison: UPLC-MS vs. NMR
The choice between UPLC-MS and NMR is pivotal in modern analytical chemistry, each offering distinct advantages and limitations. Understanding their core principles and performance characteristics is essential for effective application in pharmaceutical analysis.
UPLC-MS combines the high-resolution chromatographic separation of UPLC with the selective detection of mass spectrometry. This technique is renowned for its high sensitivity, capable of detecting analytes at trace (ng/mL) levels [94] [95]. It provides excellent specificity through multiple reaction monitoring (MRM) and enables the analysis of complex mixtures with minimal sample preparation. However, it often requires method optimization for different compound classes and can be affected by matrix effects.
NMR spectroscopy detects the magnetic properties of atomic nuclei, providing detailed structural information in a non-destructive manner. Its major strengths include high structural elucidation power, absolute quantification without need for identical standards, and minimal method development requirements. Primary limitations include relatively lower sensitivity (typically in the μM range) and significant instrument acquisition and maintenance costs [96].
Table 1: Head-to-Head Comparison of UPLC-MS and NMR for Quantitative Analysis
| Parameter | UPLC-MS/MS | NMR |
|---|---|---|
| Sensitivity | Excellent (LOD: 0.045-0.39 ng/mL) [94] | Moderate (μM range) [96] |
| Specificity | High (MRM mode) [94] | High (chemical shift dispersion) [97] |
| Linear Range | Wide (>2 orders of magnitude) [94] [95] | Wide (>2 orders of magnitude) [98] |
| Accuracy | 94.9-115.5% recovery [94] | Comparable to HPLC [98] [96] |
| Precision | CV < 3% [95] | High multivariate reproducibility (>98%) [96] |
| Analysis Time | ~5-30 minutes/sample [94] [96] | ~5-30 minutes/sample [98] [96] |
| Sample Preparation | Moderate | Minimal |
| Structural Information | Limited (requires fragmentation) | Comprehensive |
| Quantification | Relative (requires standards) | Absolute (with internal standard) [96] |
| Method Development | Extensive | Minimal |
Case Study: UPLC-MS Method Validation for Genotoxic Impurities
Background and Impurity Identification
This case study focuses on TSD-1, a novel deuterated P2Y12 receptor antagonist developed to overcome clopidogrel resistance. The synthetic route starting from 4-nitrobenzenesulfonyl chloride introduces four potential genotoxic impurities (PGIs): 4-nitrobenzenesulfonic acid (PGI-1), methyl 4-nitrobenzenesulfonate (PGI-2), ethyl 4-nitrobenzenesulfonate (PGI-3), and isopropyl 4-nitrobenzenesulfonate (PGI-4) [94]. These compounds were assessed as potentially genotoxic using (Q)SAR software (Toxtree and TOPKAT), requiring control at the TTC limit of 1.5 μg/day (15.0 ppm for a 100 mg daily dose) per ICH M7 guidelines [94].
Experimental Protocol
Instrumentation and Conditions
- Chromatographic System: UPLC system with Waters ACQUITY UPLC HSS T3 C18 column (100 mm × 2.1 mm, 1.8 μm)
- Mobile Phase: Gradient elution with water (A) and acetonitrile (B)
- Flow Rate: 0.3 mL/min
- Column Temperature: 30°C
- Injection Volume: Not specified (diluent: acetonitrile)
- Mass Spectrometer: Tandem MS with ESI source in negative mode
- Detection: Multiple Reaction Monitoring (MRM) [94]
Sample Preparation
API samples were prepared at a concentration of 0.5 mg/mL using acetonitrile as diluent, which provided optimal extraction efficiency, consistent recoveries (91.5-107.1%), and satisfactory peak shapes for all four PGIs [94].
Method Validation
The method was validated according to ICH Q2 guidelines, assessing the following parameters [94] [49]:
- Specificity: No interference observed at the retention times of the four PGIs
- Linearity: Demonstrated for all PGIs with correlation coefficients (R) > 0.9900
- LOD and LOQ: Ranged from 0.0453 ng/mL to 0.3897 ng/mL, confirming high sensitivity
- Accuracy: Recovery rates between 94.9-115.5% for all PGIs
- Precision: Satisfactory repeatability and intermediate precision
Table 2: Validation Parameters for UPLC-MS/MS Method for PGIs in TSD-1 [94]
| Compound | Linear Range (ng/mL) | Correlation Coefficient (R) | LOD (ng/mL) | LOQ (ng/mL) |
|---|---|---|---|---|
| PGI-1 | 0.1512-15.1158 | 0.9988 | 0.0453 ± 1.9% | 0.1512 ± 1.1% |
| PGI-2 | 0.3844-15.3778 | >0.9900 | Not specified | 0.3844 |
| PGI-3 | 0.3826-15.3056 | >0.9900 | Not specified | 0.3826 |
| PGI-4 | 0.3897-15.5861 | >0.9900 | Not specified | 0.3897 |
Comparative Experimental Data: UPLC-MS vs. NMR
To objectively evaluate the performance of UPLC-MS against NMR, we examine comparative studies analyzing identical samples with both techniques.
Carbohydrate Analysis in Yiqi Fumai Lyophilized Injection
A head-to-head comparison study quantified four carbohydrates (fructose, glucose, sucrose, and maltose) in YQFM using both qNMR and HPLC methods (PMP pre-column derivatization HPLC, HPLC-RID, and HPLC-ELSD) [98]. Both techniques showed similar performance characteristics in linearity range, accuracy, precision, and recovery, with analysis times under 30 minutes per sample. After methodological validation, both demonstrated good accuracy, precision, and stability. Analysis of variance (ANOVA) revealed no significant difference in sugar content results, indicating the methods could be used interchangeably for carbohydrate quantitative analysis [98].
Volatile Fatty Acid Analysis in Rumen Fluid
Another comparative study investigated the pros and cons of HPLC and ¹H-NMR for quantifying rumen volatile fatty acids (VFAs) [96]. Molar proportion and reliability analysis demonstrated highly consistent VFA concentrations between the two approaches. The study highlighted that NMR enabled identification and quantification of 118 metabolites simultaneously, including VFAs, while HPLC was optimized specifically for VFA analysis [96].
Table 3: Cross-Platform Method Performance Comparison
| Analysis Type | Analytes | UPLC-MS Performance | NMR Performance | Consistency |
|---|---|---|---|---|
| PGI Quantification [94] | Sulfonate esters | LOQ: 0.15-0.39 ng/mLAccuracy: 94.9-115.5% | Not applicable | Not applicable |
| Carbohydrate Analysis [98] | Fructose, glucose, sucrose, maltose | HPLC methods with similar performance | qNMR (internal/external standard) | No significant difference (ANOVA) |
| VFA Analysis [96] | Acetate, propionate, butyrate | High precision (CV < 2.5%)R² > 0.997 | High reproducibility (>98%)Identified 118 metabolites | Highly consistent concentrations |
Advanced Applications and Workflow Integration
Integrated LC-MS/NMR Approaches
Sophisticated analytical workflows increasingly leverage the complementary strengths of both techniques. A multilevel correlation workflow for foodomics advancement applied statistical heterospectroscopy (SHY) to combine UPLC-HRMS/MS and NMR datasets from the same table olive samples [97]. This integration increased confidence in biomarker annotation, identifying discriminant compounds across phenyl alcohols, phenylpropanoids, flavonoids, secoiridoids, and triterpenoids classes. Such approaches demonstrate how the platforms can be synergistically combined rather than viewed as competitors [97].
Metabolite Profiling and Structural Elucidation
In metabolite identification studies, the combination of UPLC-Q/TOF-MS and NMR provides a powerful solution for comprehensive structural characterization. A study on ingenol metabolism in rats identified 18 metabolites using UPLC-Q/TOF-MS, then unambiguously confirmed three metabolite structures through NMR analysis of reference standards obtained via microbial biotransformation [99]. This hybrid approach leverages MS sensitivity for metabolite detection and NMR's structural elucidation power for confirmation.
The Scientist's Toolkit: Essential Research Reagents and Materials
Successful implementation of UPLC-MS methods for genotoxic impurity analysis requires specific reagents, materials, and instrumentation optimized for trace-level detection.
Table 4: Essential Research Reagent Solutions for UPLC-MS Method Development
| Item | Function/Purpose | Example Specifications |
|---|---|---|
| UPLC-MS Grade Solvents | Mobile phase preparation; minimize background noise and ion suppression | Acetonitrile, methanol, water (LC-MS grade) [94] [100] |
| Volatile Buffers | pH adjustment and ion-pairing without MS signal suppression | Ammonium acetate, ammonium formate, formic acid, acetic acid (0.1%) [94] [100] |
| Stationary Phases | Chromatographic separation | HSS T3 C18 (100 × 2.1 mm, 1.8 μm) [94];BEH C18 (50 × 2.1 mm, 1.7 μm) [100] |
| Reference Standards | Method development and quantification | Certified reference materials of APIs and impurities (>95% purity) [94] [100] |
| Internal Standards | Quantification accuracy | Stable isotope-labeled compounds (when available) |
| Sample Preparation | Extraction and dilution | Acetonitrile for optimal recovery and peak shape [94] |
This case study demonstrates that UPLC-MS/MS represents a highly effective methodology for genotoxic impurity quantification, particularly suited to the demanding sensitivity (ppm-level) and specificity requirements of ICH M7 guidelines. The validated method for TSD-1 PGIs exemplifies how UPLC-MS delivers excellent sensitivity (LOD: 0.045-0.39 ng/mL), linearity (R > 0.990), accuracy (94.9-115.5% recovery), and precision – essential attributes for pharmaceutical quality control [94].
While NMR spectroscopy offers distinct advantages for structural elucidation and absolute quantification without reference standards [96], its relatively lower sensitivity makes it less suitable for trace-level genotoxic impurity analysis at current regulatory thresholds. The emerging paradigm in analytical science leverages both techniques complementarily: UPLC-MS for sensitive detection and quantification, with NMR providing definitive structural confirmation when needed [97] [99].
For researchers developing methods for genotoxic impurity quantification, UPLC-MS remains the primary workhorse, while NMR serves as a powerful orthogonal technique for structural challenges. The continued integration of these platforms through approaches like statistical heterospectroscopy represents the future of comprehensive analytical characterization in pharmaceutical development.
Conclusion
UPLC-MS and NMR are not competing technologies but rather powerful, complementary pillars of the modern automated laboratory. UPLC-MS offers unparalleled sensitivity and high-throughput capabilities for targeted quantification, while NMR provides a highly reproducible, non-destructive, and holistic view of the sample. The future of analytical science lies in their strategic integration within automated workflows, powered by AI and machine learning for data analysis and closed-loop optimization. This synergistic approach, governed by rigorous validation frameworks and sustainable practices, will be crucial for accelerating drug discovery, ensuring product quality and safety, and navigating the increasing complexity of biomedical and clinical research. Embracing this integrated model will empower scientists to generate more reliable data faster, ultimately driving innovation across the pharmaceutical and life sciences industries.
References
- 1. HPLC 2025 Day 1: Automating The Analytical Laboratory [https://www.chromatographyonline.com/view/hplc-2025-day-1-automation]
- 2. Artificial intelligence-driven autonomous laboratory for ... [https://www.oaepublish.com/articles/cs.2025.66]
- 3. Ultra-Performance Liquid Chromatography–High-Resolution ... [https://pmc.ncbi.nlm.nih.gov/articles/PMC6184476/]
- 4. The integration of LC-MS and NMR for the analysis of low ... [https://pmc.ncbi.nlm.nih.gov/articles/PMC6339611/]
- 5. Advantages and disadvantages of nuclear magnetic ... [https://www.sciencedirect.com/science/article/abs/pii/S0003267003011346]
- 6. 1H-NMR and UPLC-MS metabolomics: Functional tools for ... [https://www.sciencedirect.com/science/article/abs/pii/S0031942218300852]
- 7. Comparison of NMR and MS | Metabolomics [https://www.ebi.ac.uk/training/online/courses/metabolomics-introduction/designing-a-metabolomics-study/comparison-of-nmr-and-ms/]
- 8. Advancing Organic Chemistry Using Highâ€Throughput ... [https://pmc.ncbi.nlm.nih.gov/articles/PMC12462754/]
- 9. Unlocking Quality: The Ultimate Guide to GMP NMR ... [https://emerypharma.com/blog/unlocking-quality-the-ultimate-guide-to-gmp-nmr-testing-and-analytical-method-development-validation-services-for-reliable-release-testing/]
- 10. Combining mass spectrometry and nuclear magnetic ... [https://www.sciencedirect.com/science/article/abs/pii/S0079656516300656]
- 11. NMR-Guided Mass Spectrometry for Absolute Quantitation ... [https://pmc.ncbi.nlm.nih.gov/articles/PMC6260976/]
- 12. UPLC-MS/MS-based molecular networking and NMR ... [https://pubmed.ncbi.nlm.nih.gov/32619738/]
- 13. Process Research and Benchtop Online NMR [https://www.bruker.com/en/products-and-solutions/automation-digitalization/process-research-and-benchtop-online-nmr.html]
- 14. Automated analysis and reporting LC/MS and NMR ... [https://mestrelab.com/case-studies/pharma-company-solution.html]
- 15. An Automated Purification Workflow Coupled with Material- ... [https://pubmed.ncbi.nlm.nih.gov/39291006/]
- 16. Automated high-throughput RP-HPLC-MS and SFC- ... [https://www.sciencedirect.com/science/article/abs/pii/S0021967324010215]
- 17. Lab Automation, NMR, and the Power of Integration [https://www.news-medical.net/news/20250916/Inside-the-lab-of-the-future-Automation-NMR-and-the-power-of-integration.aspx]
- 18. A comparison of human serum and plasma metabolites using... [https://pubmed.ncbi.nlm.nih.gov/30830335/]
- 19. Screening and Validation Serum Potential Biomarkers for ... [https://pubmed.ncbi.nlm.nih.gov/41054242/]
- 20. Analysis of Panax ginseng Berries from... | Sigma-Aldrich Comparative [https://www.sigmaaldrich.com/NE/en/tech-docs/paper/1289347]
- 21. Development and validation of a UPLC-DAD-MS method ... [https://www.sciencedirect.com/science/article/pii/S1021949813000136]
- 22. - UPLC metabolic profiling of second trimester amniotic fluid and... MS [https://pubs.rsc.org/en/content/articlelanding/2012/mb/c2mb05424h]
- 23. What is the ATP? [https://www.gmp-compliance.org/gmp-news/what-is-the-atp]
- 24. Applying ICH Q14 in Pharmaceuticals Part 1 [https://premier-research.com/perspectives/applying-ich-q14-in-pharmaceuticals-part-1-the-application-of-analytical-target-profile-in-analytical-method-development/]
- 25. Selection of Analytical Technology and Development ... [https://pubmed.ncbi.nlm.nih.gov/34928590/]
- 26. Integrating NMR and MS for Improved Metabolomic Analysis [https://www.mdpi.com/1420-3049/30/12/2624]
- 27. An Automated Purification Workflow Coupled with Material ... [https://pmc.ncbi.nlm.nih.gov/articles/PMC11403749/]
- 28. An Automated Approach to NMR Data Handling ... [https://www.sciencedirect.com/science/article/pii/S1535553507002766]
- 29. Combined LC/MS and NMR for Automated Verification of ... [https://www.acdlabs.com/resource/combined-lc-ms-and-nmr-for-automated-verification-of-chemical-structures/]
- 30. Automated optimization of a flow reactor by using Bayesian ... [https://magritek.com/2025/06/13/automated-optimization-of-a-flow-reactor-by-using-bayesian-algorithms-and-inline-nmr-monitoring/]
- 31. Benchtop NMR for Pharmaceutical Process Optimisation [https://nmr.oxinst.com/application-detail/process-optimisation]
- 32. An Automated, Highly Selective Reaction Monitoring ... [https://pmc.ncbi.nlm.nih.gov/articles/PMC11504610/]
- 33. Advancements in Mass Spectrometry-Based Targeted ... [https://www.mdpi.com/1420-3049/29/24/5934]
- 34. Widely Targeted Metabolomics Based on Large-Scale MS ... [https://pmc.ncbi.nlm.nih.gov/articles/PMC2638709/]
- 35. Mass-spectrometry based metabolomics: an overview of ... [https://proteomesci.biomedcentral.com/articles/10.1186/s12953-025-00241-8]
- 36. A comparative UPLC-MS-based metabolomics approach ... [https://www.sciencedirect.com/science/article/pii/S1878535223009140]
- 37. A KNIME Workflow for Automated Structure Verification [https://pubmed.ncbi.nlm.nih.gov/32081066/]
- 38. Structure Elucidation & Verification | Software & Automation [https://www.acdlabs.com/solutions/structure-elucidation-verification/]
- 39. Integrating NMR and multi-LC-MS-based untargeted ... [https://www.sciencedirect.com/science/article/pii/S0003267025003733]
- 40. strategies in Dereplication research: How many tools... natural product [https://link.springer.com/article/10.1007/s11101-015-9448-7]
- 41. Review on natural products databases: where to find data in ... [https://pmc.ncbi.nlm.nih.gov/articles/PMC7118820/]
- 42. Review on natural products databases: where to find data in ... [https://jcheminf.biomedcentral.com/articles/10.1186/s13321-020-00424-9]
- 43. of microbial extracts and related analytical technologies Dereplication [https://www.nature.com/articles/ja201412?error=cookies_not_supported&code=f641ffb6-c2a5-4759-8bd3-bc37c8bd873b]
- 44. A comparison of human serum and plasma metabolites using ... [https://pmc.ncbi.nlm.nih.gov/articles/PMC7122646/]
- 45. Advanced Methods for Natural Discovery: Products ... Bioactivity [https://www.mdpi.com/1660-3397/21/5/308]
- 46. Metabolite quantification by NMR and LC-MS/MS reveals ... [https://www.sciencedirect.com/science/article/abs/pii/S0731708516313085]
- 47. NMR Spectroscopy for Metabolomics Research - PMC [https://pmc.ncbi.nlm.nih.gov/articles/PMC6680826/]
- 48. How Analytical Method Validation Ensures Product Quality [https://www.pharmsky.com.au/how-analytical-method-validation-ensures-product-quality/]
- 49. Analytical Method Validation: A Comprehensive Review ... [http://www.seejph.com/index.php/seejph/article/view/6516]
- 50. Validation of analytical methods and detection limits in ... [https://www.sciencedirect.com/science/article/abs/pii/S0969806X24009745]
- 51. Novel analytical method development and validation of ... [https://fjps.springeropen.com/articles/10.1186/s43094-025-00877-5]
- 52. Combining Mass Spectrometry and NMR Improves Metabolite ... [https://pmc.ncbi.nlm.nih.gov/articles/PMC6668615/]
- 53. A Cross-Platform Metabolomics Comparison Identifies ... [https://pmc.ncbi.nlm.nih.gov/articles/PMC8370474/]
- 54. 2025 Pharma Trends: Structure elucidation services by NMR [https://resolvemass.ca/structure-elucidation-services-by-nmr/]
- 55. Optimization of Sample Preparation for Metabolomics ... [https://pubmed.ncbi.nlm.nih.gov/34299389/]
- 56. Sample preparation optimization for metabolomics and ... [https://pubmed.ncbi.nlm.nih.gov/41075457/]
- 57. Cross-Platform Comparison of Amino Acid Metabolic ... [https://www.mdpi.com/2218-1989/13/3/402]
- 58. Identification and correction of spatial bias are essential for ... [https://www.nature.com/articles/s41598-017-11940-4]
- 59. Quantify and control reproducibility in high-throughput ... [https://pubmed.ncbi.nlm.nih.gov/33046893/]
- 60. Identification and Correction of Additive and Multiplicative ... [https://www.sciencedirect.com/science/article/pii/S2472555222068629]
- 61. Matrix Effects on Quantitation in Liquid Chromatography [https://www.chromatographyonline.com/view/matrix-effects-on-quantitation-in-liquid-chromatography-sources-and-solutions]
- 62. Strategies for the Detection and Elimination of Matrix ... [https://www.chromatographyonline.com/view/strategies-detection-and-elimination-matrix-effects-quantitative-lc-ms-analysis]
- 63. QuantyFey: An open-source tool for targeted LC-MS ... [https://www.sciencedirect.com/science/article/pii/S0003267025009651]
- 64. Matrix effects break the LC behavior rule for analytes in LC ... [https://pmc.ncbi.nlm.nih.gov/articles/PMC4935370/]
- 65. Correction of gas chromatography–mass spectrometry long ... [https://www.nature.com/articles/s41598-025-24794-y]
- 66. Overcoming Matrix Effects in Non-Target Screening [https://pmc.ncbi.nlm.nih.gov/articles/PMC12224152/]
- 67. Matrix Effect Assessment via Matrix Matching Strategy ... [https://www.sciencedirect.com/science/article/abs/pii/S0003267025010864]
- 68. NMR as a “Gold Standard†Method in Drug Design and ... [https://pmc.ncbi.nlm.nih.gov/articles/PMC7594251/]
- 69. An Ultra-Fast Validated Green UPLC-MS/MS Approach for ... [https://pmc.ncbi.nlm.nih.gov/articles/PMC11679331/]
- 70. Development and validation of an UPLC-MS/MS method ... [https://www.sciencedirect.com/science/article/abs/pii/S0731708524006976]
- 71. Recent Developments Toward Integrated Metabolomics ... [https://www.frontiersin.org/journals/molecular-biosciences/articles/10.3389/fmolb.2021.720955/full]
- 72. 1H-NMR and UPLC-MS metabolomics: Functional tools for ... [https://pubmed.ncbi.nlm.nih.gov/29783186/]
- 73. Comparison of Various Extraction Approaches for ... [https://pmc.ncbi.nlm.nih.gov/articles/PMC11122815/]
- 74. From Complexity to Clarity: Expanding Metabolome Coverage ... [https://pmc.ncbi.nlm.nih.gov/articles/PMC11836935/]
- 75. Optimization of Extraction Methods for NMR and LC-MS ... [https://pmc.ncbi.nlm.nih.gov/articles/PMC12388471/]
- 76. Optimization of Extraction Methods for NMR and LC-MS ... [https://www.mdpi.com/1420-3049/30/16/3379]
- 77. ICH Q2(R2) Validation of analytical procedures [https://www.ema.europa.eu/en/ich-q2r2-validation-analytical-procedures-scientific-guideline]
- 78. Q2(R2) Validation of Analytical Procedures March 2024 [https://www.fda.gov/regulatory-information/search-fda-guidance-documents/q2r2-validation-analytical-procedures]
- 79. ICH publishes Training Materials on Q2(R2) and Q14 [https://www.gmp-compliance.org/gmp-news/ich-publishes-training-materials-on-q2r2-and-q14]
- 80. Development and validation of a quantitative proton NMR ... [https://www.sciencedirect.com/science/article/pii/S0731708522004940]
- 81. Readiness for Implementation of ICH Q2(R2) and Q14 ... [https://ispe.org/pharmaceutical-engineering/september-october-2025/readiness-implementation-ich-q2r2-and-q14]
- 82. Multiplatform Metabolomics Studies of Human Cancers ... [https://pmc.ncbi.nlm.nih.gov/articles/PMC9024335/]
- 83. Identification of metabolites from complex mixtures by 3D ... [https://www.nature.com/articles/s41598-023-43056-3]
- 84. Serum UPLC-MS/MS metabolic profiling in an ... [https://pmc.ncbi.nlm.nih.gov/articles/PMC3490499/]
- 85. A Cross-Platform Metabolomics Comparison Identifies ... [https://www.frontiersin.org/journals/molecular-biosciences/articles/10.3389/fmolb.2021.676349/full]
- 86. Analytical validation and pilot clinical application of a ... [https://www.sciencedirect.com/science/article/abs/pii/S0731708525000895]
- 87. Simple and Robust UPLC-MS Method for Serum ... [https://www.mdpi.com/2076-3417/15/16/8789]
- 88. A sustainable and novel LC-TQ-MS/MS method for quantifying ... [https://pubs.rsc.org/en/content/articlehtml/2025/an/d5an01052g]
- 89. Recent Advances in Liquid Chromatography–Mass ... [https://pmc.ncbi.nlm.nih.gov/articles/PMC12204688/]
- 90. Green analytical chemistry metrics for evaluating the ... [https://www.sciencedirect.com/science/article/pii/S2095177924001102]
- 91. Greenness evaluation metric for analytical methods and ... [https://pmc.ncbi.nlm.nih.gov/articles/PMC12318332/]
- 92. Automation of the Chromatographic Analytical Method ... [https://www.chromatographyonline.com/view/automation-chromatographic-analytical-method-validation-process]
- 93. Six questions to ask when automating your drug discovery ... [https://www.tecan.com/blog/six-questions-to-ask-when-automating-your-drug-discovery-workflow-for-greater-productivity]
- 94. Quantitative Determination of Four Potential Genotoxic ... [https://pmc.ncbi.nlm.nih.gov/articles/PMC9268482/]
- 95. A sensitive UPLC-MS/MS method for the simultaneous ... [https://www.sciencedirect.com/science/article/pii/S2211715623002588]
- 96. Comparison of HPLC and NMR for quantification of the ... [https://www.nature.com/articles/s41598-021-03553-9]
- 97. A multilevel LC-HRMS and NMR correlation workflow ... [https://www.sciencedirect.com/science/article/abs/pii/S0039914024010208]
- 98. Head-to-Head Comparison of High-Performance Liquid ... [https://pubmed.ncbi.nlm.nih.gov/36677822/]
- 99. Systematic characterization of metabolic profiles of ingenol in rats by... [https://pubs.rsc.org/en/content/articlelanding/2021/ra/d1ra07915h]
- 100. UPLC-Q-TOF-MS method development and validation for ... [https://japsonline.com/abstract.php?article_id=3691&sts=2]