Automated Reaction Monitoring: Integrating UPLC-MS and NMR for Smarter Chemical Synthesis
This article explores the transformative integration of UPLC-MS and NMR spectroscopy for automated reaction monitoring, a cornerstone of modern high-throughput research in drug development and chemical synthesis.
Automated Reaction Monitoring: Integrating UPLC-MS and NMR for Smarter Chemical Synthesis
Abstract
This article explores the transformative integration of UPLC-MS and NMR spectroscopy for automated reaction monitoring, a cornerstone of modern high-throughput research in drug development and chemical synthesis. We cover the foundational principles of these techniques, highlighting their complementary strengths: UPLC-MS for high sensitivity and metabolite coverage, and NMR for superior reproducibility and non-targeted structural analysis. The piece provides a detailed guide to configuring automated workflows, from robotic sample handling to software integration, and addresses key troubleshooting and optimization strategies. Finally, it offers a comparative analysis of the techniques and examines validation protocols, providing researchers and scientists with a comprehensive resource to enhance efficiency, reproducibility, and data-driven decision-making in their labs.
The Pillars of Automation: Understanding UPLC-MS and NMR Synergy
Core Principles of UPLC-MS and NMR in Reaction Monitoring
In modern drug development, the design-make-test-analyze (DMTA) cycle is a foundational process for rapid compound optimization. A significant bottleneck in this cycle has traditionally been the purification and structural verification of synthesized compounds. The deep fusion of Ultra-Performance Liquid Chromatography-Mass Spectrometry (UPLC-MS) and Nuclear Magnetic Resonance (NMR) spectroscopy within automated, high-throughput platforms addresses this challenge directly [1] [2]. These intelligent automated systems provide a solid technical foundation, offering unique advantages of low consumption, low risk, high efficiency, high reproducibility, high flexibility, and good versatility [1]. This article details the core principles and application protocols for leveraging UPLC-MS and NMR in automated reaction monitoring, providing researchers with the methodologies to innovate material manufacturing and redefine the pace of chemical synthesis.
Core Principles and Instrumentation
Principles of UPLC-MS
UPLC-MS combines the superior separation power of ultra-performance liquid chromatography with the identification and quantification capabilities of mass spectrometry. The principles of UPLC-MS can be broken down into two main components:
- Ultra-Performance Liquid Chromatography (UPLC): UPLC operates on the same fundamental principles as HPLC but utilizes stationary phases with smaller particle sizes (typically below 2 µm) and higher operating pressures. This results in significantly improved chromatographic resolution, increased speed of analysis, and enhanced sensitivity. Compounds are separated based on their differential partitioning between a stationary phase (the column) and a mobile phase (the solvent).
- Mass Spectrometry (MS): Following chromatographic separation, analytes are ionized (typically by electrospray ionization - ESI), and their mass-to-charge ratios (m/z) are measured. This provides molecular mass information and, through tandem MS (MS/MS), characteristic fragmentation patterns for definitive identification.
The synergy of these techniques allows for the precise separation, detection, and identification of compounds in complex mixtures, making it indispensable for monitoring reaction progress and purity.
Principles of NMR Spectroscopy
Nuclear Magnetic Resonance (NMR) spectroscopy is a powerful analytical technique that provides detailed structural and quantitative information about molecules.
- Fundamental Principle: NMR exploits the magnetic properties of certain atomic nuclei, such as ^1H and ^13C. When placed in a strong magnetic field, these nuclei can absorb electromagnetic radiation at a characteristic frequency. The resulting NMR spectrum reveals a wealth of information, including:
- Chemical Shift: Provides information on the chemical environment of a nucleus.
- Spin-Spin Coupling: Reveals the connectivity between atoms within a molecule.
- Signal Intensity: Is directly proportional to the concentration of the nuclei, enabling quantification.
- Advantages for Reaction Monitoring: Unlike MS, NMR is nondestructive and excels at distinguishing between isomers (e.g., regioisomers, stereoisomers) and providing direct evidence of molecular structure and connectivity [2]. Its main historical limitations in high-throughput workflows have been lower sensitivity and the need for deuterated solvents.
Synergy in an Automated Workflow
UPLC-MS and NMR are highly complementary techniques. While UPLC-MS excels at rapid purity assessment and providing molecular mass information, NMR delivers unambiguous structural confirmation [2]. In an automated platform, samples can be routed from a UPLC-MS system to an NMR spectrometer, enabling a seamless workflow where the strengths of one technique compensate for the weaknesses of the other. This provides researchers with a complete analytical dataset—purity, molecular identity, and definitive structure—from a single, integrated process.
Experimental Protocols
UPLC-MS Protocol for Metabolite Identification
This protocol is adapted from a detailed method for metabolite analysis using a Thermo Fisher Q-Exactive HF Orbitrap mass spectrometer [3].
1. Sample Preparation:
- Dissolve or dilute reaction mixtures or crude samples in a solvent compatible with the mobile phase (e.g., water/acetonitrile).
- Centrifuge if necessary to remove particulate matter.
2. UPLC Conditions:
- System: Ultimate 3000 UPLC or equivalent.
- Column: Reverse-phase (e.g., Waters ACQUITY UPLC BEH C18, 2.1 × 50 mm, 1.7 µm).
- Mobile Phase A: Water/Acetonitrile (40:60 v/v) with 10 mM ammonium formate and 0.1% formic acid.
- Mobile Phase B: Acetonitrile/2-Propanol (10:90 v/v) with 10 mM ammonium formate and 0.1% formic acid.
- Gradient: Optimize for specific application (e.g., a 3.0 min fast gradient for high-throughput analysis or an 8.5 min gradient for more complex mixtures) [3] [2].
- Column Temperature: 55 °C.
- Auto-sampler Temperature: 5 °C.
- Injection Volume: 5 µL (for reverse-phase).
3. MS Conditions:
- Mass Spectrometer: High-resolution accurate mass instrument (e.g., Q-Exactive HF Orbitrap).
- Ionization Mode: Electrospray Ionization (ESI), positive or negative mode.
- Data Acquisition:
- Full Scan: For accurate mass measurement.
- Data-Dependent Acquisition (DDA): Top 5 DDA to automatically select and fragment the most abundant ions. Use stepped normalized collision energy (e.g., 10, 30, and 50 V) to generate rich MS/MS spectra [3].
- Parallel Reaction Monitoring (PRM): For targeted analysis, use a collision energy ramp (e.g., 10 to 40 V) [3].
4. Data Analysis:
- Use software to process chromatograms and mass spectra.
- Identify compounds based on retention time, accurate mass, and MS/MS fragmentation patterns compared to standards or databases.
Table 1: UPLC-MS Method Parameters for Reaction Monitoring
| Parameter | Specification | Purpose |
|---|---|---|
| Column Type | Reverse Phase (C18), 2.1 x 50 mm, 1.7 µm | High-resolution, fast separation |
| Mobile Phase A | Water/Acetonitrile with ammonium formate & formic acid | Aqueous phase, aids ionization |
| Mobile Phase B | Acetonitrile/2-Propanol with ammonium formate & formic acid | Organic phase, efficient elution |
| Gradient Time | 3.0 min (fast) to 8.5 min (comprehensive) | Balances throughput vs. resolution |
| MS Detection | High-resolution Orbitrap | Accurate mass and MS/MS data |
| Data Acquisition | DDA & PRM | Untargeted discovery & targeted quantification |
Automated NMR Sample Generation and Acquisition
This protocol describes an automated workflow for generating NMR samples from the "dead volume" of purification systems, enabling high-throughput structural verification without consuming material prioritized for biological assays [2].
1. Integrated Purification and NMR Sampling:
- Purification Scale: The workflow is applicable to multiple scales: Traditional (tPMC, 50-75 μmol), Analytical (aPMC, 10-30 μmol), and Micro (μPMC, 3-5 μmol) [2].
- Dead Volume Recovery: After UPLC-MS purification and fraction collection, the inaccessible "dead volume" in the vials (∼25 μL for traditional, ∼10 μL for analytical/micro scales) is rescued instead of being discarded.
- Sample Dilution: A liquid handling robot (e.g., Tecan) automatically adds 250 μL of DMSO to the vials containing the dead volume, creating a ready-to-analyze NMR sample [2].
2. NMR Acquisition Parameters:
- Sample Tube: Use 1.7 mm NMR tubes for high-throughput analysis to minimize sample volume and increase throughput.
- Spectrometer: High-field NMR spectrometer (e.g., 500 MHz or higher) equipped with an automated sample changer.
- Experiment Type:
- ¹H NMR: Standard one-dimensional proton NMR. This is the primary experiment for structural verification.
- Acquisition Parameters: Number of scans (NS) = 16-128; relaxation delay (D1) = 1-5 seconds. Parameters can be optimized for sensitivity and throughput.
- Automated Processing: Utilize automated Fourier transformation, phasing, and peak picking software. Integrate with structure verification algorithms for rapid analysis.
3. Data Interpretation:
- Manually or automatically review the ¹H NMR spectrum for the presence of expected signals and the absence of impurities or starting materials.
- Use the structural information to confirm the identity of the synthesized compound, particularly to distinguish isomeric products that UPLC-MS cannot.
Table 2: Key Parameters for Automated High-Throughput NMR
| Parameter | Specification | Purpose |
|---|---|---|
| Sample Source | Dead volume from purification | Uses otherwise wasted material |
| NMR Tube Diameter | 1.7 mm | Minimizes sample requirement, increases throughput |
| Deuterated Solvent | DMSO-d₆ | Standard solvent compatible with workflow |
| Throughput | Up to 36,000 compounds/year | Supports parallel medicinal chemistry (PMC) |
| Primary Experiment | ¹H NMR | Rapid structural confirmation |
| Automation | Liquid handling & auto-sampler | Enables high-throughput, minimal manual intervention |
The Scientist's Toolkit: Research Reagent Solutions
Table 3: Essential Materials for UPLC-MS and NMR Reaction Monitoring
| Item | Function / Application |
|---|---|
| UPLC BEH C18 Column (1.7 µm) | Provides high-resolution separation of reaction components under reverse-phase conditions [3]. |
| Ammonium Formate / Formic Acid | Mobile phase additives that improve chromatographic peak shape and enhance ionization efficiency in positive ESI-MS [3]. |
| 10 mM DMSO Stock Solutions | Standardized concentration for reformatting purified compounds for biological testing and storage; compatible with both assays and NMR [2]. |
| 1.7 mm NMR Tubes | Enables NMR data acquisition from minimal sample volumes (as low as 10 µg), which is critical for high-throughput microscale synthesis [2]. |
| Charged Aerosol Detector (CAD) | Provides mass-based quantification of compounds without UV chromophores, essential for accurate yield determination after purification [2]. |
| DMSO-d₆ | Standard deuterated solvent for NMR spectroscopy, allowing for sample locking and shimming without the need for extensive sample preparation from DMSO stocks [2]. |
Workflow Visualization
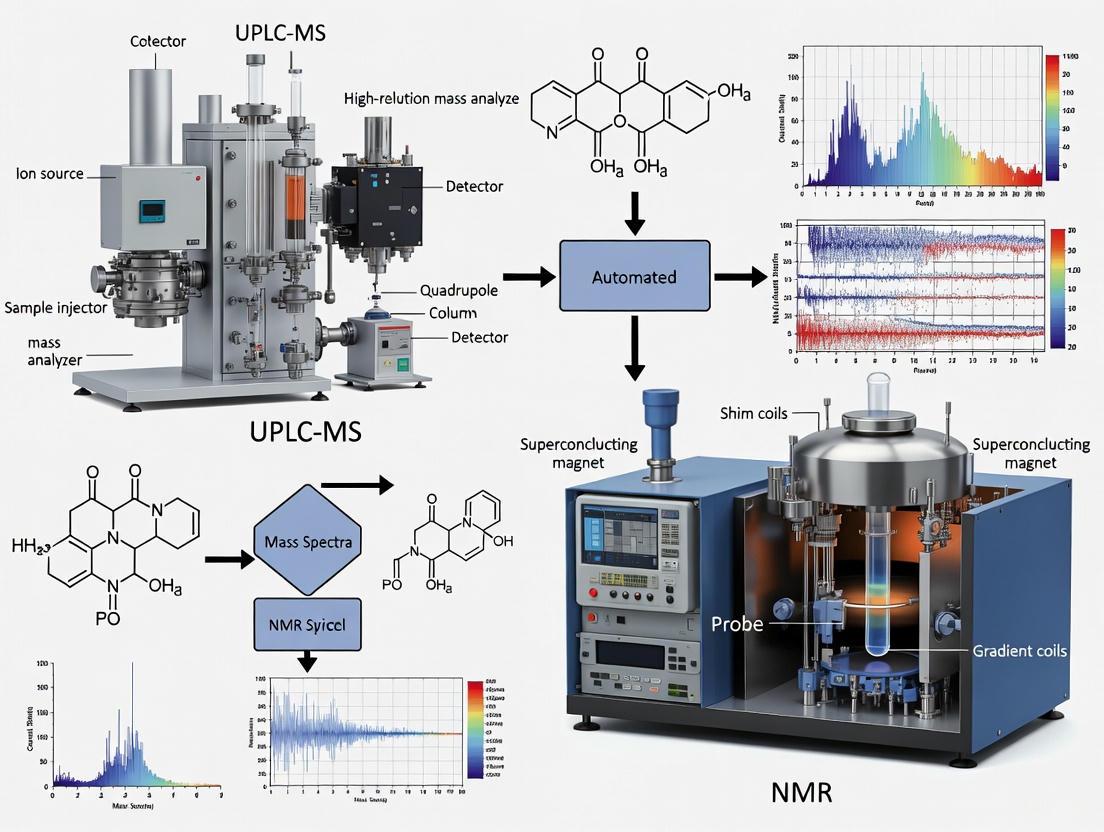
The following diagram illustrates the integrated automated workflow for reaction monitoring, purification, and analysis that synergizes UPLC-MS and NMR.
Integrated Automated Analysis Workflow
This workflow demonstrates how a sample progresses from submission through automated purification, with parallel tracks for biological testing and structural verification via NMR, all coordinated by a central LIMS [2].
Why Combine UPLC-MS and NMR? Defining Complementary Roles
The integration of Ultra-Performance Liquid Chromatography-Mass Spectrometry (UPLC-MS) and Nuclear Magnetic Resonance (NMR) spectroscopy represents a transformative approach in modern analytical chemistry, particularly for automated reaction monitoring in drug discovery and development. This application note delineates the complementary roles of these techniques, providing detailed experimental protocols and data comparison tables to guide researchers in implementing this powerful synergistic workflow. By leveraging the high sensitivity of UPLC-MS alongside the structural elucidation capabilities of NMR, scientists can achieve comprehensive molecular characterization of complex reaction mixtures with unprecedented efficiency.
In pharmaceutical research and development, the imperative to understand chemical processes thoroughly demands analytical techniques that provide both rapid detection and definitive structural characterization. UPLC-MS and NMR spectroscopy have emerged as cornerstone technologies for reaction monitoring, yet each possesses distinct strengths and limitations [4] [5]. The integration of these platforms creates a synergistic workflow that surpasses the capabilities of either technique used in isolation.
UPLC-MS delivers exceptional sensitivity, with limits of detection in the femtomole range for analytes with high ionization efficiency, enabling rapid analysis of complex mixtures [4] [6]. However, MS alone cannot readily distinguish isobaric compounds or positional isomers and provides limited structural information without authentic standards [4]. Conversely, NMR spectroscopy offers unparalleled structural elucidation power, distinguishing between isomers and providing atomic connectivity information through multidimensional experiments [4] [7]. Despite being less sensitive (typically requiring microgram quantities) and slower than MS, NMR is inherently quantitative, non-destructive, and unaffected by matrix effects [4] [8].
This application note, framed within broader thesis research on automated reaction monitoring, delineates practical strategies for combining UPLC-MS and NMR, complete with detailed protocols, comparative data tables, and visualization tools to guide implementation in drug development settings.
Complementary Analytical Strengths
Technical Comparison
Table 1: Comparative analytical profiles of UPLC-MS and NMR spectroscopy
| Parameter | UPLC-MS | NMR |
|---|---|---|
| Detection Limits | Femtomole range (10⁻¹³ mol) [4] | Microgram range (10⁻⁹ mol) [4] |
| Structural Information | Molecular weight, elemental composition, fragmentation patterns [4] | Atomic connectivity, stereochemistry, functional groups, isomer distinction [4] [7] |
| Quantitation | Relative quantitation; suffers from matrix effects and ionization efficiency variations [4] | Inherently quantitative; direct proportionality between signal and concentration [4] [8] |
| Analysis Speed | Seconds to minutes per sample [6] | Minutes to hours for 1D spectra; hours to days for 2D experiments [4] |
| Sample Preservation | Destructive analysis [9] | Non-destructive; sample recovery for further analysis [4] |
| Isomer Differentiation | Limited capability [4] | Excellent capability [4] |
Synergistic Applications in Reaction Monitoring
The combination of UPLC-MS and NMR enables comprehensive reaction monitoring that capitalizes on their complementary strengths:
- Reaction Progression Tracking: UPLC-MS provides rapid assessment of starting material consumption and product formation, while NMR delivers quantitative concentration data and identifies isomeric products [6] [8].
- Intermediate Identification: NMR can characterize transient reactive intermediates with sufficient lifetimes, while MS detects these species based on mass signatures [7] [8].
- Impurity Profiling: MS excels at detecting low-abundance impurities, while NMR determines their structures, including stereochemistry [6] [7].
- Mechanistic Elucidation: The combination provides both kinetic data (from NMR) and molecular weight information (from MS) for comprehensive reaction mechanism understanding [8].
Figure 1: Complementary data workflow for UPLC-MS and NMR in reaction monitoring
Experimental Protocols
UPLC-MS Reaction Monitoring Protocol
Application: Rapid screening of reaction progression and component detection [6]
Materials:
- ACQUITY UPLC System with BEH C8 Column (2.1 × 30 mm, 1.7 μm)
- SQ Mass Detector with ESI source
- Mobile Phase A: 0.1% Formic acid in water
- Mobile Phase B: 0.1% Formic acid in acetonitrile
Method Parameters:
- Column Temperature: 45°C
- Flow Rate: 800 μL/min
- Gradient: 5% to 95% B over 0.7 minutes
- Injection Volume: 1-5 μL
- MS Acquisition: 100-1300 m/z at 10,000 amu/sec
Procedure:
- Sample Preparation: Withdraw aliquot from reaction mixture, filter through 0.2 μm membrane, and dilute with appropriate solvent.
- System Equilibration: Condition UPLC system with initial mobile phase composition for 0.5 minutes.
- Sample Analysis: Inject prepared sample using specified gradient method.
- Data Acquisition: Acquire data in both positive and negative ionization modes simultaneously.
- Data Processing: Use automated software (e.g., OpenLynx) for peak detection and identification.
Key Advantages: Rapid analysis (cycle time <1.5 minutes) enables high-throughput screening of multiple reaction timepoints [6].
NMR Reaction Monitoring Protocol
Application: Structural elucidation and quantitative reaction profiling [7] [8]
Materials:
- NMR spectrometer (400-800 MHz) with flow probe or flow tube
- Deuterated solvent (e.g., CD₃CN, D₂O)
- Peristaltic pump for continuous flow
- Reactor vessel with temperature control
Method Parameters:
- Flow Rate: 1-2 mL/min (continuous circulation)
- NMR Acquisition: 1D ¹H NMR with solvent suppression
- Relaxation Delay: 1-2 seconds between scans
- Number of Scans: 4-16 for adequate signal-to-noise
- Acquisition Time: 2-3 minutes per time point
Procedure:
- System Setup: Connect reactor to NMR flow cell using appropriate tubing, ensuring continuous circulation.
- Deuterium Lock: Incorporate approximately 10% deuterated solvent in reaction mixture for field frequency lock.
- Initial Shimming: Optimize magnetic field homogeneity before reaction initiation.
- Kinetic Profiling: Acquire sequential ¹H NMR spectra throughout reaction duration.
- Data Processing: Use automated integration software (e.g., Mnova) to track concentration changes of specific resonances over time.
- Structural Analysis: For unknown intermediates, perform stopped-flow 2D experiments (e.g., COSY, HSQC).
Key Advantages: Non-invasive analysis provides true picture of reaction composition without perturbation; quantitative data enables kinetic studies [8].
Integrated UPLC-MS-NMR Workflow
Application: Comprehensive reaction analysis for complex or problematic reactions
Materials:
- Combined UPLC-MS and NMR systems
- LC-NMR interface with peak trapping capability
- Deuterated mobile phase components
Procedure:
- Initial Screening: Use UPLC-MS to identify optimal timepoints for detailed analysis based on reaction profile.
- Peak Selection: Based on MS data, select chromatographic peaks of interest for NMR analysis.
- Loop Collection: Trap relevant LC peaks in storage loops for subsequent offline NMR analysis.
- NMR Analysis: Transfer trapped peaks to NMR flow cell for structural characterization.
- Data Correlation: Integrate MS and NMR datasets for complete molecular understanding.
Key Advantages: Combines sensitivity of MS with structural power of NMR; ideal for identifying unknown impurities, metabolites, or reactive intermediates [4] [10].
The Scientist's Toolkit: Essential Research Reagents and Materials
Table 2: Key research reagent solutions for UPLC-MS-NMR reaction monitoring
| Item | Function | Application Notes |
|---|---|---|
| Deuterated Solvents (e.g., CD₃CN, D₂O) | Provides NMR field frequency lock without significant interference | Enables real-time NMR monitoring; cost can be managed using only partially deuterated solvents (10% in protonated solvent) [8] |
| Formic Acid (MS grade) | Mobile phase modifier for improved ionization in MS | Enhances protonation in positive ion mode; concentration typically 0.1% [6] |
| UPLC-MS Columns (C8 or C18, 1.7-1.8 μm) | High efficiency chromatographic separation | Sub-2μm particles provide narrow peaks (<1 sec width); requires high pressure systems [6] |
| NMR Flow Cells | Enables continuous monitoring without manual sampling | Can be fixed flow cell probes or modified NMR tubes; active volumes as low as 1.5 μL available [4] [8] |
| Solvent Suppression Sequences | Reduces strong solvent signals in NMR | Essential for observing analyte signals in non-deuterated or partially deuterated solvents [8] |
| Cryogenically Cooled Probes | Enhances NMR sensitivity | Reduces electronic noise; provides 2-4x sensitivity improvement compared to conventional probes [4] [10] |
| Automated Data Processing Software | Handles large datasets from continuous monitoring | Processes hundreds of spectra; aligns peaks with shifting chemical shifts; extracts kinetic profiles [8] |
Figure 2: Integrated NMR reaction monitoring setup for continuous flow analysis
The strategic integration of UPLC-MS and NMR technologies creates a powerful platform for automated reaction monitoring that transcends the limitations of either technique used independently. This synergistic approach enables researchers to rapidly identify reaction components with high sensitivity (UPLC-MS) while definitively characterizing their structures, including isomeric forms and reactive intermediates (NMR). The experimental protocols and technical comparisons provided in this application note offer practical guidance for implementing this workflow in drug discovery and development environments. As pharmaceutical research continues to emphasize efficiency and comprehensive process understanding, the combined UPLC-MS-NMR approach represents an essential methodology for advancing reaction optimization and mechanistic elucidation.
The global market for automated reaction monitoring is experiencing robust growth, driven by the increasing need for accelerated innovation and stringent quality control across life sciences, energy, and materials sectors. This field has become a cornerstone for organizations aiming to maintain a competitive edge, with advances in analytical technologies enabling real-time observation of reaction pathways, kinetics, and yield optimization [11]. The market is shifting from traditional end-point analysis to continuous monitoring, fundamentally reshaping how scientists approach process development, scale-up, and quality control [11].
Quantitative market data reveals a strong upward trajectory, as detailed in Table 1 below.
Table 1: Reaction Monitoring Market Size and Projections
| Metric | 2024 Value | 2025 Value | Projected 2032 Value | CAGR (2025-2032) |
|---|---|---|---|---|
| Global Market Size | USD 1.85 billion | USD 1.97 billion | USD 3.14 billion | 6.86% [11] |
This growth is segmented across various industries and product types, with the pharmaceutical and biotechnology sector representing the largest market share due to its demand for high-throughput analysis in drug development [11] [12]. The market's concentration and key characteristics are summarized in Table 2.
Table 2: Market Segmentation and Key Characteristics
| Segment | Dominant Players/Areas | Market Characteristics & Concentration |
|---|---|---|
| End-User Industries | Pharmaceutical & Biotechnology, Academic Research, Clinical Diagnostics [12] | Pharmaceutical sector is the largest revenue generator; clinical diagnostics shows rapid growth potential [12]. |
| Product Types | Mass Spectrometers, Software, Reagents & Consumables [12] | High-end mass spectrometers hold significant share; consumables market is substantial and crucial for growth [12]. |
| Regional Adoption | North America, Europe, Asia-Pacific [11] [12] | North America holds largest share; Asia-Pacific expected to see fastest growth rate [12]. |
| Innovation Focus | Sensitivity, Selectivity, Automated Data Analysis, Multiplexing [12] | Driven by demand for high-throughput screening and user-friendly software [11] [12]. |
Experimental Protocol: Automated Reaction Monitoring with Inline NMR
The following detailed protocol describes a methodology for the self-optimization of a flow reactor using inline benchtop NMR, as exemplified by the Knoevenagel condensation model reaction [13]. This protocol integrates hardware, software, and analytical techniques to create a closed-loop, automated system.
Principle
A self-optimizing flow reactor system integrates real-time analytics with an intelligent optimization algorithm. The system continuously monitors reaction output via inline NMR spectroscopy and uses a Bayesian algorithm to adjust reaction parameters automatically, seeking optimal performance with minimal human intervention [13]. This approach is highly suited for accelerated reaction development and optimization.
Materials and Equipment
Reagents and Compounds:
- Salicylaldehyde (104.5 mL, 1 mol) [13]
- Ethyl acetoacetate (126.5 mL, 1 mol) [13]
- Piperidine (9.88 mL, 10 mol%) as catalyst [13]
- Ethyl Acetate (HPLC grade) [13]
- Acetone (HPLC grade) [13]
- Dichloromethane [13]
Instrumentation:
- Flow Reactor System: Ehrfeld Micro Reaction System (MMRS) including micromixer and capillary reactor [13]
- Pumps: Three SyrDos syringe pumps [13]
- Automation & Control: HiTec Zang LabManager and LabVision software [13]
- Inline Analyzer: Magritek Spinsolve 80 Ultra Benchtop NMR Spectrometer [13]
- Optional: Tecan liquid handling robot for sample reformatting [2]
Procedure
Step 1: System Setup and Configuration
- Prepare Feed Solutions:
- Feed 1: Dissolve salicylaldehyde (104.5 mL, 1 mol) and piperidine (9.88 mL, 10 mol%) in ethyl acetate to a final volume of 1 L.
- Feed 2: Dissolve ethyl acetoacetate (126.5 mL, 1 mol) in ethyl acetate to a final volume of 1 L.
- Dilution Feed: Mix dichloromethane (8.0 mL, 125 mmol) with acetone to a final volume of 1 L [13].
Assemble Flow Reactor: Connect the feed lines via the micromixer to the capillary reactor, maintained at a constant temperature. Connect the outlet to a second mixer where the dilution feed is added, and then route the stream through the NMR flow cell [13].
Configure Software: Establish communication between the LabManager automation system and the Spinsolve NMR spectrometer using the external control mode. Pre-load a quantitative NMR (qNMR) template in the Spinsolve software with acquisition parameters (e.g., 1D EXTENDED+ protocol, 4 scans, 6.55 s acquisition time) [13].
Step 2: Method Definition and Algorithm Calibration
- Define Variable Parameters: Set the optimization algorithm to vary the flow rates of Feed 1 and Feed 2 within a range of 0 to 1 mL/min. This manipulates both the reactant ratio and the residence time [13].
Set Optimization Goal: Configure the algorithm to maximize the reaction yield, which will be calculated from the real-time NMR data [13].
Steady-State Criteria: Program the system to take consecutive NMR measurements at each set of conditions until three consecutive readings show no significant change in conversion and yield, indicating a steady state has been reached [13].
Step 3: Execution of the Automated Optimization Run
- Initiate Optimization: Start the automated run via the LabVision software. The system will begin with an initial set of conditions.
Data Acquisition and Analysis: For each iteration:
- The LabManager triggers the Spinsolve NMR to acquire a spectrum.
- The qNMR software automatically analyzes the spectrum, calculating the conversion and yield based on defined integrals (e.g., aldehyde proton from starting material and olefinic proton from the product) [13].
- The yield data is passed back to the LabVision software.
Iterative Feedback Loop: The Bayesian optimization algorithm in LabVision analyzes the yield result and calculates a new, potentially better set of flow rate parameters. The LabManager then implements these new settings on the syringe pumps, and the loop repeats [13].
Step 4: Data and Output Handling
- Monitor Progress: Track the yield as a function of the iteration number. The algorithm will balance "exploration" (testing new regions of parameter space) and "exploitation" (refining known promising conditions) [13].
- Final Output: The system will run for a pre-defined number of iterations or until convergence criteria are met. The conditions corresponding to the highest yield achieved are identified as the optimal parameters [13].
The workflow of this automated system is illustrated in the following diagram:
Calculations
NMR Yield and Conversion Calculations for Knoevenagel Model Reaction:
- Reference Integral (R): Aromatic region (6.6 - 8.10 ppm), representing 4 protons constant in both starting material and product.
- Starting Material Integral (S1): Aldehyde proton of salicylaldehyde (9.90 - 10.20 ppm).
- Product Integral (S2): Olefinic proton of 3-acetyl coumarin (8.46 - 8.71 ppm).
Conversion of salicylaldehyde is calculated as:
Conversion (%) = [1 - (S1 / R)] × 100% [13]
Yield of 3-acetyl coumarin is calculated as:
Yield (%) = (S2 / R) × 100% [13]
The Scientist's Toolkit: Essential Research Reagent Solutions
The implementation of robust automated reaction monitoring platforms relies on a suite of essential reagents, instruments, and software. Table 3 details these key components and their functions in the experimental workflow.
Table 3: Key Research Reagent Solutions for Automated Reaction Monitoring
| Tool Name/Category | Function in Workflow | Specific Examples & Notes |
|---|---|---|
| Benchtop NMR Spectrometer | Provides real-time, non-destructive structural analysis and quantification directly in the reaction stream [13]. | Magritek Spinsolve Ultra; operates without cryogens, can be installed in a fume hood, does not require deuterated solvents for locking [13]. |
| Process Automation & Control Software | The central "brain" that integrates hardware, controls parameters, acquires data, and executes optimization algorithms [13]. | HiTec Zang LabManager (hardware) and LabVision (software); enables flexible configuration and recipe control for R&D [13]. |
| Microreactor Flow System | Provides a controlled environment for reactions with enhanced heat/mass transfer and seamless integration with analytics [13]. | Ehrfeld Modular Microreactor System (MMRS); includes micromixers and capillary reactors [13]. |
| Bayesian Optimization Algorithm | Intelligently navigates the parameter space by balancing exploration and exploitation to find optimal conditions with fewer experiments [13]. | Integrated into control software (e.g., LabVision); uses yield data to propose subsequent reaction parameters [13]. |
| Syringe Pumps with High Precision | Deliver reactants and dilution solvents at precisely controlled flow rates, a key variable for optimization [13]. | SyrDos syringe pumps; capable of varying flow rates between 0-1 mL/min as directed by the automation system [13]. |
| Deuterated Solvents for NMR | Used in the analyte for frequency lock and shimming in high-field NMR; not required for benchtop NMR operation [13] [14]. | Deuterated methanol (CD₃OD) or D₂O can be used in extraction for LC-MS/NMR cross-platform work [14]. |
| Laboratory Information Management System (LIMS) | Manages sample tracking, data analysis, and generates instructions for automated equipment in high-throughput workflows [2]. | Internal systems used in pharma (e.g., at Pfizer) to handle purification, characterization, and plate management for thousands of compounds [2]. |
| UPLC-MS Systems | Offers high-sensitivity, high-throughput analysis for qualitative and quantitative analysis of reaction mixtures, often used alongside NMR [15] [2]. | Waters UPLC systems coupled to MS detectors; used for purity assessment and method development in purification workflows [2]. |
This application note details the pivotal role of Ultra-Performance Liquid Chromatography coupled with Mass Spectrometry (UPLC-MS) in modern metabolomics and automated reaction monitoring, emphasizing its core advantages of exceptional sensitivity and broad metabolite coverage. Within the broader research context integrating UPLC-MS and benchtop NMR for automated synthesis and real-time analysis, these strengths enable unprecedented insight into complex chemical and biological systems [16].
Analytical Superiority and Quantitative Data
UPLC-MS represents a significant evolution from conventional LC-MS, offering superior chromatographic resolution, speed, and sensitivity. These improvements directly translate to enhanced detection and quantification of metabolites, which is critical for elucidating the multi-component, multi-target mechanisms of action in systems like traditional Chinese medicine (TCM) and for monitoring reaction pathways in real-time [17] [18].
Table 1: Key Performance Advantages of UPLC-MS in Metabolite Analysis
| Aspect | Capability/Advantage | Impact on Research |
|---|---|---|
| Chromatographic Resolution | Sub-2µm particle columns; higher peak capacity. | Reduces co-elution, improves separation of isomeric compounds, leading to cleaner spectra and more accurate quantification [17] [18]. |
| Analysis Speed | Significantly reduced run times compared to HPLC. | Enables high-throughput (HT) analysis of large sample cohorts, essential for biobank studies and rapid reaction screening [18] [16]. |
| Detection Sensitivity | Enhanced signal-to-noise due to sharper peak elution. | Lowers limits of detection (LOD), allowing quantification of low-abundance metabolites and transient reaction intermediates [17] [18]. |
| Metabolite Coverage | Compatible with diverse separation modes (RP, HILIC). | Expands the analytical space to cover metabolites across a wide polarity range, from lipids to polar organic acids [17]. |
| Data Quality for Informatics | Produces high-resolution, precise m/z and retention time data. | Provides robust input for computational tools like asari, improving feature detection accuracy and reproducibility in metabolomics [19]. |
Detailed Experimental Protocols for Metabolite Profiling
The following protocol outlines a standardized workflow for UPLC-MS-based untargeted metabolomics, which forms the basis for applications in drug discovery and reaction monitoring.
Protocol: Untargeted Metabolic Profiling Using UPLC-HRMS
A. Sample Preparation (Critical for Coverage & Sensitivity)
- Quenching & Homogenization: Rapidly quench metabolic activity in biological samples (e.g., cells, tissues) using liquid nitrogen or cold methanol. Homogenize the sample to ensure uniform extraction and maximize metabolite recovery [17].
- Metabolite Extraction:
- Employ a biphasic solvent system for comprehensive coverage. A typical method uses a methanol/water/chloroform mixture (e.g., 2.5:1:1 ratio) [17].
- Vigorously vortex, then centrifuge (e.g., 14,000 x g, 15 min, 4°C) to separate phases.
- For polar metabolite analysis, collect the upper aqueous-methanol layer. For lipid analysis, collect the lower organic (chloroform) layer.
- Dry the extracts under a gentle stream of nitrogen or using a vacuum concentrator.
- Reconstitution: Reconstitute dried extracts in a solvent compatible with the chromatographic method (e.g., 100 µL of water/acetonitrile (98:2) for HILIC-MS; acetonitrile/water (50:50) for RPLC-MS). Centrifuge to remove particulates before injection [17].
B. UPLC-HRMS Analysis
- Chromatography:
- System: UPLC system equipped with a high-pressure capable binary pump.
- Columns: Use sub-2µm particle columns. For reversed-phase (RP), a C18 column (e.g., 2.1 x 100 mm, 1.7 µm) is standard. For hydrophilic interaction (HILIC), a bridged ethylene hybrid (BEH) amide column is recommended [17].
- Gradient: Employ optimized gradients. Example RP gradient: 1-99% acetonitrile (with 0.1% formic acid) in water over 10-15 minutes. Maintain a constant column temperature (e.g., 40°C) [18].
- Mass Spectrometry:
- Instrument: High-resolution mass spectrometer (e.g., Q-TOF, Orbitrap) capable of data-dependent acquisition (DDA) or data-independent acquisition (DIA) [17] [18].
- Ionization: Use electrospray ionization (ESI) in both positive and negative modes to maximize metabolite coverage.
- Acquisition Parameters: Set resolution > 35,000 FWHM; mass range 50-1200 m/z. Use automatic gain control (AGC) and optimized collision energies for MS/MS fragmentation.
C. Data Processing & Feature Extraction
- Convert raw data to an open format (e.g., mzML) using tools like
msConvert[19]. - Process data using a reproducible algorithm like
asari. Key steps include mass alignment via "mass tracks," which treats m/z alignment independently from and prior to elution peak detection, enhancing consistency and selectivity (mSelectivity) [19]. - Perform peak picking, alignment across samples, and gap filling to generate a feature intensity table (m/z, RT, intensity).
Visualizing the Integrated Workflow
UPLC-MS in Automated Reaction Monitoring Workflow
High-Resolution Metabolomics Data Processing Logic
The Scientist's Toolkit: Essential Research Reagents & Solutions
Table 2: Key Reagents and Materials for UPLC-MS Metabolomics & Reaction Monitoring
| Item | Function & Description | Application Context |
|---|---|---|
| Cold Quenching Solvents | Methanol, acetonitrile (pre-chilled to -80°C). Stops enzymatic activity instantly to preserve the in vivo metabolic state [17]. | Sample preparation for cellular/tissue metabolomics. |
| Biphasic Extraction Solvents | Methanol/Water/Chloroform mixtures. Enables simultaneous extraction of polar and non-polar (lipid) metabolites, maximizing coverage [17]. | Comprehensive metabolite profiling. |
| UPLC Columns (Sub-2µm) | e.g., C18 (RP), BEH Amide (HILIC). Provides high chromatographic resolution and peak capacity for separating complex mixtures [17] [18]. | Core separation component in UPLC-MS systems. |
| High-Purity Calibrants & QCs | Stable isotope-labeled internal standards (SIL-IS), pooled quality control (QC) samples. Essential for instrument calibration, monitoring performance, and ensuring data quality in large studies [20] [18]. | All quantitative MS applications. |
| Automated Synthesis & Sampling Platform | e.g., FLEX ISYNTH with integrated fluidics and valve systems. Enables reproducible, high-throughput reaction execution and automated aliquot sampling for online analysis [21] [16]. | Automated reaction monitoring and optimization. |
| Integrated Analytics Module | Interface coupling automated sampler to UPLC-MS and/or benchtop NMR (e.g., Fourier 80). Allows for complementary, real-time analysis of reaction progress and components [16]. | Multi-modal reaction monitoring. |
| Reproducible Data Processing Software | e.g., asari (open-source). Performs trackable and scalable processing of LC-MS data with improved feature correspondence and mSelectivity [19]. |
Metabolomics data extraction and analysis. |
| Interactive Dashboard Tools | e.g., Dash/Plotly-based QC dashboards. Visualizes instrument performance metrics (peak area, RRT) over time, enabling proactive maintenance [20]. | Laboratory quality control and assurance. |
Application Note: The Central Pillar in Automated Reaction Monitoring Research
Within the framework of a thesis investigating integrated UPLC-MS and NMR platforms for automated reaction monitoring, Nuclear Magnetic Resonance (NMR) spectroscopy emerges as the indispensable technique for definitive structural characterization and ensuring data reproducibility. This application note delineates the core strengths of NMR in this context, providing detailed protocols and resources to empower research in pharmaceutical and chemical development.
Foundational Strengths: Why NMR is Irreplaceable
NMR spectroscopy provides atom-level insight into molecular structure, dynamics, and purity that is orthogonal and complementary to mass spectrometric data. Its non-destructive nature makes it ideal for continuous reaction monitoring and sample reuse [22] [23].
Table 1: Comparative Analytical Strengths of NMR in Integrated Workflows
| Feature | NMR Spectroscopy | Mass Spectrometry (MS) | Infrared (IR) Spectroscopy |
|---|---|---|---|
| Structural Detail | Full molecular framework, stereochemistry, conformation [22] | Molecular weight, fragmentation pattern [22] | Functional group identification [22] |
| Stereochemistry | Excellent (via NOESY/ROESY) [22] | Limited [22] | Not applicable [22] |
| Quantification | Accurate without external standards (qNMR) [24] [22] | Requires standards/calibrants [22] | Limited [22] |
| Impurity ID | High sensitivity to isomers, non-ionizables [22] | Sensitive to low-level impurities [22] | May miss low-level impurities [22] |
| Automation | High; integrated in benchtop & workflow automation [25] [26] | High | Moderate |
Table 2: Performance of Solvent Suppression Sequences for qNMR in Non-Deuterated Solvents Critical for high-throughput analysis in reaction monitoring where deuterated solvents may not be practical.
| Sequence Type | Key Principle | Robustness | Best Use Case | Reference |
|---|---|---|---|---|
| 1D-NOESYpr | Presaturation + z-filtering | Variable; sensitive to parameter setup | General metabolomics [24] | [24] |
| Binomial-like (e.g., WET, PURGE) | Selective excitation/suppression | High; produces robust quantitative results | High-accuracy qNMR [24] | [24] |
| Perfect-Echo based (e.g., PEW5, WADE) | Perfect echo scheme; active exchange broadening | Excellent at high field; reduces artifacts | High-field, aqueous samples [27] [24] | [27] [24] |
Core Experimental Protocols
Protocol 1: High-Accuracy Quantitative NMR (qNMR) for Reaction Yield Determination
Objective: To quantify reaction components accurately using an internal standard, enabling precise yield calculation during automated monitoring [24].
Materials & Sample Prep:
- Internal Standard: Maleic acid Certified Reference Material (CRM), precisely weighed [24].
- Sample: Reaction aliquot or purified product.
- Solvent: Can use non-deuterated solvent (e.g., H₂O) with appropriate suppression, or standard deuterated solvent [24].
- NMR Tube: Standard 5 mm or high-throughput tube.
Methodology:
- Weighing: Accurately weigh the internal standard and sample into an NMR vial. Use a calibrated balance with µg-mg resolution [24].
- Dissolution: Add solvent, vortex thoroughly for 1 minute to ensure complete dissolution and homogeneity [24].
- T₁ Measurement: Perform an inversion-recovery experiment to determine the longitudinal relaxation time (T₁) of the quantifiable signals for both the analyte and standard. Use a relaxation delay of ≥ 30 s [24].
- Quantitative Acquisition:
- Pulse Sequence: Use a binomial-like solvent suppression sequence (e.g., PURGE, WET) for highest accuracy in non-deuterated solvents [24]. For deuterated solvents, a standard zg pulse sequence is sufficient.
- Repetition Time (D1): Set to > 10 x the longest T₁ measured to ensure full relaxation [24].
- Scan Count (NS): Acquire sufficient scans to achieve a signal-to-noise ratio (SNR) > 250 for the target peaks.
- Spectral Width: 30 ppm.
- Data Points: 128k.
- Processing & Quantification:
- Process FID with exponential line broadening (LB = 0.3 Hz), Fourier Transform, phase correction, and baseline correction.
- Integrate relevant peaks for analyte and standard.
- Calculate concentration:
C_analyte = (I_analyte / I_std) * (N_std / N_analyte) * (M_std / M_analyte) * (W_std / W_sample), where I=integral, N=number of protons, M=molecular weight, W=weight.
Protocol 2: Automated Structural Dereplication via FID Reproc essing
Objective: To verify the identity of a reaction product by comparing its raw NMR data against a database, maximizing reproducibility [28].
Materials & Data:
- Raw Data: Free Induction Decay (FID) file of the unknown sample and reference compound(s) [28].
- Software: NMR processing software with advanced analysis capabilities (e.g., Mnova, TopSpin) [26].
- Database: Access to an NMR spectral database (e.g., NMRshiftDB, HMDB) [28].
Methodology:
- FID Acquisition: Ensure raw FID files are saved and archived from the automated reaction monitoring system.
- Reprocessing: Load the FID into processing software. Reprocess using different window functions (e.g., Lorentzian-to-Gaussian transformation) and zero-filling to enhance resolution [28].
- Advanced Analysis: Apply quantum mechanics-based fitting or multiplet analysis tools to extract precise chemical shifts (δ to 0.1-1 ppb) and coupling constants (J to 10 mHz) [28].
- Database Search: Use the extracted peak list or the processed spectrum to search against a unified spectral database (e.g., www.osdb.info, www.hmdb.ca) [28].
- Validation: Compare the unknown's raw FID or reprocessed spectrum with the reference FID from the database or literature. Overlay spectra and check for exact multiplet pattern matches, which are more diagnostic than tabulated shifts alone [28].
Visualization of Integrated Workflows
Diagram 1: Automated Reaction Monitoring with NMR and UPLC-MS Integration
Diagram 2: The FID Reproc essing Path for Structural Transparency
The Scientist's Toolkit: Essential Research Reagents & Solutions
Table 3: Key Reagents and Solutions for NMR in Automated Monitoring
| Item | Function & Specification | Application Context |
|---|---|---|
| Maleic Acid CRM | High-purity internal standard for qNMR; enables absolute quantification without identical analyte standard [24]. | Reaction yield determination, purity assessment. |
| Deuterated Solvents (D₂O, d₆-DMSO) | Provides lock signal for field stability; minimizes large solvent proton signals. | Standard high-resolution NMR analysis. |
| Non-Deuterated Solvents (H₂O) | Enables analysis in native reaction conditions; requires robust solvent suppression [24]. | Direct analysis of aqueous reaction mixtures, increased throughput. |
| qNMR Suitability Reference | Certified material (e.g., USP qNMR RS) for verifying instrument quantitative performance. | System suitability testing (SST) for validated workflows. |
| Cryoprobes & Inverse Probes | NMR probe hardware providing 4x sensitivity increase (cryoprobe) or optimized for ¹H detection. | Detecting low-concentration intermediates or products in reaction monitoring. |
| Automation-Compatible NMR Tubes | High-throughput, uniform tubes or flow cells for integrated systems. | Used in platforms like FLEX AUTOPLANT for online analysis [25]. |
| Mnova Gears / AUTOSUITE Software | Automation workflow software for batch NMR data processing, analysis, and reporting [25] [26]. | Pipelines for processing data from multiple reaction monitoring timepoints. |
| Spectral Databases (e.g., HMDB, OSDB) | Public repositories of NMR spectra and raw FIDs for dereplication [28]. | Verifying compound identity against known references. |
Protocol 3: PEARLScreen NMR for Ligand Screening in Fragment-Based Drug Discovery
Objective: To identify initial protein-ligand binding hits with high sensitivity using a perfect echo-based experiment, applicable in early-stage drug discovery research [27].
Materials:
- Protein target solution.
- Library of fragment compounds.
- NMR buffer (e.g., phosphate buffer, often in D₂O for lock).
- High-field NMR spectrometer (80 - 1200 MHz) [27].
Methodology:
- Sample Preparation: Prepare protein sample at low µM concentration (protocol allows for up to 40x reduction in protein requirement at high field) [27]. Mix with individual fragments or small mixtures.
- Experiment Setup: Select the PEARLScreen pulse sequence on the spectrometer [27].
- Acquisition Parameters: Utilize the perfect echo scheme. Key advantage is the use of longer relaxation delays and active exchange broadening to enhance binding sensitivity [27].
- Screening: Acquire ¹H spectra. Ligand binding is indicated by significant signal attenuation or line broadening for the fragment protons compared to a control spectrum without protein.
- Analysis: Use automated analysis software (e.g., Mnova Screen plugin) to rapidly process data and identify hits based on signal intensity changes [26].
Protocol 4: Archiving Raw FIDs for Reproducible Research
Objective: To adhere to Good Research Practices by preserving and sharing original NMR data to ensure long-term reproducibility and allow for re-analysis [28].
Methodology:
- Data Retention: Configure NMR software to automatically save the raw Free Induction Decay (FID) file in addition to the processed spectrum.
- Metadata Inclusion: Ensure the FID is accompanied by a complete set of acquisition parameters (pulse sequence, receiver gain, number of scans, etc.).
- Submission for Publication: As per emerging guidelines, submit the FID as part of the Supporting Information for publication. Annotate with the proposed structure [28].
- Deposition in Repository: Upload the FID to a public unified digital repository (e.g., Open Spectral Database - www.osdb.info) to assign a permanent access code [28].
- Citation: Reference the repository code in publications, allowing peers direct access to the primary data for verification or re-interpretation using advanced future methods [28].
The landscape of pharmaceutical analysis has undergone a fundamental transformation, shifting from manual, labor-intensive techniques to integrated, automated workflows that significantly accelerate drug discovery and development. This paradigm shift is particularly evident in the implementation of advanced analytical techniques such as Ultra-Performance Liquid Chromatography-tandem Mass Spectrometry (UPLC-MS/MS) and Nuclear Magnetic Resonance (NMR) spectroscopy. These technologies have evolved from standalone identification tools to core components of automated reaction monitoring systems, enabling real-time decision-making and high-throughput characterization in modern laboratories [29] [30] [31].
The driving force behind this transition stems from the pharmaceutical industry's need to overcome critical bottlenecks. Traditional methods struggled with throughput limitations, operator dependency, and delayed data availability, which impeded the rapid progression of drug candidates through development pipelines. Automated UPLC-MS/MS and NMR workflows now provide unprecedented efficiency in assessing critical parameters including solubility, metabolic stability, and impurity profiling, thereby compressing development timelines from months to weeks while delivering superior data quality and reproducibility [29] [31].
Automated UPLC-MS/MS for Solubility Screening
Protocol: Automated Solubility Screening Using UPLC-MS/MS
Application Note: High-throughput solubility determination for early-stage drug candidates [29]
Experimental Workflow:
Sample Preparation:
- Prepare stock solutions of test compounds at 5 mM concentration in DMSO using 96-well plates
- Transfer 50 μL aliquots of each stock solution to a 2-mL 96-well plate
- Add 950 μL of appropriate pH buffer (pH 1.0, 7.4, or 9.4) to each well, resulting in 250 μM compound concentration
- Shake gently for 1.5 hours at room temperature
- Vacuum-filter using Sirocco plates for 30-60 seconds into collection plates
- Dilute filtrates 1:100 in 50:50 acetonitrile/water for UPLC-MS/MS analysis
Standard Preparation:
- Prepare three-point calibration standards at 0.25 μM, 1.25 μM, and 2.5 μM concentrations
- Use serial dilutions from 5 mM DMSO stock solutions with 50:50 acetonitrile/water as diluent
UPLC Conditions:
- System: Waters ACQUITY TQD
- Column: ACQUITY UPLC BEH C18 (2.1 × 50 mm, 1.7 μm)
- Temperature: 40°C
- Flow Rate: 600 μL/min
- Mobile Phase A: 0.1% formic acid in water
- Mobile Phase B: 0.1% formic acid in acetonitrile
- Gradient: 5% to 95% B over 1.3 minutes
MS/MS Conditions:
- Ionization Mode: ESI Positive
- Capillary Voltage: 3200 V
- Source Temperature: 150°C
- Desolvation Temperature: 450°C
- Desolvation Gas: 900 L/hr
- Acquisition Mode: Multiple Reaction Monitoring (MRM)
- Dwell Time: 200 ms per transition
Data Analysis:
- Process data using ProfileLynx Application Manager
- Generate calibration curves for each compound from standard concentrations
- Automatically quantify analyte concentrations using established curves
- Multiply results by 100 (to account for dilution factor) to obtain final solubility values
- Flag values outside predetermined range (0.0-2.5 mg/mL) for review [29]
Table 1: Key Advantages of Automated UPLC-MS/MS Solubility Screening
| Parameter | Traditional Methods | Automated UPLC-MS/MS |
|---|---|---|
| Throughput | 10-20 samples/day | 96+ samples in single run |
| Sample Consumption | High (mL volumes) | Low (μL volumes) |
| Analysis Time | Hours to days | Minutes per sample |
| Detection Specificity | Moderate | High (MS/MS confirmation) |
| Dynamic Range | Limited | >3 orders of magnitude |
| Data Processing | Manual calculation | Automated reporting |
Automation Enablers in UPLC-MS/MS
The transformation to automated workflows has been facilitated by several key technological advancements. Software integration plays a pivotal role, with applications like QuanOptimize enabling automated MS method development and optimization, while ProfileLynx provides unified data processing and reporting across multiple assays [29]. This software integration eliminates manual intervention in method development and ensures consistency across analyses.
The implementation of Multiple Reaction Monitoring provides exceptional selectivity and sensitivity by targeting specific precursor-product ion transitions, enabling accurate quantification even in complex matrices [29] [15]. This approach has been successfully applied to multi-component analysis, simultaneously quantifying 22 marker compounds in traditional herbal formulations with high precision [15].
Furthermore, standardized data formats such as mzQuantML have been developed by the HUPO Proteomics Standards Initiative to capture quantitative outputs, supporting submissions to public repositories and enabling consistent data interpretation across platforms [32]. This standardization is crucial for reproducible automated workflows in regulated environments.
Automated NMR Workflows in Drug Development
Protocol: Quantitative NMR for Solubility and Physicochemical Properties
Application Note: Rapid determination of drug solubility and lipophilicity using automated qNMR [31]
Experimental Workflow:
Sample Preparation:
- Prepare saturated solutions of drug candidate by adding excess compound to aqueous buffer
- Agitate for 24 hours at constant temperature to achieve equilibrium
- Centrifuge at 15,000 × g for 10 minutes to separate undissolved material
- Transfer supernatant to NMR tube, adding internal standard (e.g., 3-(trimethylsilyl)propionic-2,2,3,3-d4 acid, sodium salt)
- For log P determinations, prepare samples in octanol-water systems and analyze both phases
NMR Acquisition Parameters:
- Instrument: High-field NMR spectrometer (≥400 MHz)
- Probe: Inverse detection cryoprobe for enhanced sensitivity
- Temperature: Controlled at 25°C or 37°C
- Pulse Sequence: Standard ¹H pulse sequence with pre-saturation for water suppression
- Relaxation Delay: ≥5 × T₁ (longest relaxation time)
- Acquisition Time: 2-4 seconds
- Scans: 16-64 depending on concentration
Data Processing:
- Process spectra with exponential multiplication (line broadening 0.3-1.0 Hz)
- Apply Fourier transformation and phase correction
- Reference spectra to internal standard signal
- Integrate target compound peaks and internal standard peak
- Calculate concentration using equations:
[ C{sample} = \frac{I{sample} \times N{std} \times m{std} \times P{std}}{I{std} \times N{sample} \times M{std}} \times 10^9 ]
Where: (C{sample}) = sample concentration (μg/mL) (I) = integral area (N) = number of nuclei contributing to signal (m{std}) = mass of internal standard (g) (M{std}) = molar mass of internal standard (g/mol) (P{std}) = purity of internal standard [31]
Automation Features:
- Automated sample changing with robotic sample handlers
- Automated locking, shimming, and calibration
- Pre-defined acquisition protocols for consistent data quality
- Automated data processing and quantification scripts
- Direct export of results to laboratory information management systems
Table 2: Research Reagent Solutions for Automated Analytical Workflows
| Reagent/Software | Function | Application |
|---|---|---|
| ProfileLynx | Automated data processing and reporting | UPLC-MS/MS solubility screening |
| QuanOptimize | MS method development and optimization | MRM parameter optimization |
| TopSpin | NMR data acquisition and processing | Automated NMR analysis |
| MNova | NMR data processing and quantification | qNMR analysis |
| mzQuantML | Standardized data representation | SRM data exchange and storage |
| Skyline | Targeted mass spec data analysis | SRM/MRM data processing |
Automation Enablers in NMR Spectroscopy
The automation of NMR workflows has been accelerated by several complementary technologies. Robotic sample handling enables continuous operation with automated loading, locking, shimming, and calibration, significantly increasing throughput for routine analyses [33] [31].
The implementation of quantitative NMR methodologies leverages the inherent quantitative nature of NMR signals, where peak areas directly correlate to the number of nuclei, enabling concentration determination without compound-specific calibration curves [31]. This approach is particularly valuable for simultaneous multi-component analysis in complex mixtures.
Advanced computational methods including quantum chemical calculations and machine learning algorithms have revolutionized NMR data interpretation. Density Functional Theory enables accurate prediction of NMR parameters, while machine learning approaches automate spectral analysis and facilitate structural elucidation of complex molecules [34]. These computational tools have dramatically reduced the expertise barrier and time investment required for NMR data interpretation.
Integrated Workflows and Data Management
Protocol: Automated SRM Data Analysis Workflow for Targeted Proteomics
Application Note: Large-scale targeted proteomic studies using automated SRM data analysis [35]
Experimental Workflow:
Data Processing:
- Convert raw SRM data to mzXML format
- Import transition lists in tab-separated format
- Execute mProphet for peptide identification via probabilistic scoring
- Perform peak picking and integration of transition chromatograms
Statistical Analysis:
- Process data with SRMstats using linear mixed-effect models
- Define experimental design with biological and technical replicates
- Calculate significance analysis for protein quantification changes
- Adjust p-values for multiple testing using false discovery rate control
Data Dissemination:
- Export results in standardized mzQuantML format
- Submit data to PASSEL repository for public access
- Generate summary reports for experimental interpretation
Timeline:
- Complete workflow execution: 1-2 weeks
- Processing time dependent on number of replicates and sample size [35]
Workflow Visualization
Diagram 1: Integrated UPLC-MS/NMR Automated Workflow
The paradigm shift from manual to automated analytical workflows represents a fundamental transformation in pharmaceutical research and development. By integrating advanced UPLC-MS/MS and NMR technologies with automated sample handling, data acquisition, and processing protocols, laboratories can achieve unprecedented levels of throughput, reproducibility, and data quality. These automated workflows have become indispensable tools for addressing the complex challenges of modern drug development, enabling researchers to efficiently characterize drug candidates and advance promising compounds through development pipelines with enhanced confidence in data quality and interpretation.
The continued evolution of these technologies, particularly through improved computational methods and standardized data formats, promises to further accelerate drug discovery while maintaining the rigorous analytical standards required for pharmaceutical development. As these automated workflows become increasingly sophisticated and accessible, they will continue to drive innovation and efficiency across the entire drug development landscape.
Building the Automated Workflow: From Hardware to Data Integration
The integration of robotic platforms with analytical instruments, particularly Ultra-Performance Liquid Chromatography-Mass Spectrometry (UPLC-MS) and Nuclear Magnetic Resonance (NMR) spectroscopy, is transforming modern laboratories into highly efficient, automated systems for reaction monitoring and chemical analysis [36] [37]. This technological synergy addresses growing demands for higher throughput, improved accuracy, and enhanced cost-efficiency in pharmaceutical development and chemical research [36]. Automated workflows now enable seamless sample preparation, analysis, data processing, and reporting with minimal human intervention, significantly accelerating the Design-Make-Test-Analyze (DMTA) cycles critical to drug discovery [38].
The global laboratory automation market, valued at $5.2 billion in 2022, is projected to reach $8.4 billion by 2027, driven largely by adoption in pharmaceutical, biotechnology, and environmental sectors [36]. This growth reflects a fundamental shift toward autonomous laboratories where mobile robotic agents, advanced instrumentation, and intelligent decision-making algorithms create continuous, closed-loop experimentation systems [37] [39]. This application note details the configuration, implementation, and protocols for successfully integrating robotic platforms with UPLC-MS and NMR systems to establish robust automated workflows for reaction monitoring.
System Components and Specifications
A fully integrated automated platform requires coordinated hardware and software components that work in concert to execute analytical workflows. The core system consists of robotic handling systems, analytical instruments, and control software infrastructure.
Robotic Platforms
Robotic systems serve as the physical interface between different analytical modules, transporting samples and performing precise manipulations.
- Mobile Robotic Agents: Free-roaming robots with multipurpose grippers can navigate standard laboratory environments to operate instruments, transfer samples, and perform manual tasks [37]. These systems emulate human researchers without requiring extensive laboratory redesign.
- Fixed Robotic Arms: Stationary robotic systems, such as those integrated into automated synthesizers like the Chemspeed ISynth platform, provide dedicated sample preparation and reformatting capabilities [37] [38].
- Automated Liquid Handlers: Precision robotic systems capable of performing micro-pipetting, solvent preparation, and sample dilution with integrated mass spectrometry feedback [40].
Analytical Instruments
The core analytical technologies for comprehensive reaction monitoring provide orthogonal data for complete chemical characterization.
- UPLC-MS Systems: Provide high-resolution chromatographic separation coupled with mass-based detection for compound identification and quantification [37] [38]. These systems offer superior sensitivity and speed compared to conventional HPLC.
- Benchtop NMR Spectrometers: Compact, cryogen-free instruments like the Magritek Spinsolve Ultra enable automated structural elucidation with high homogeneity magnetic fields for narrow signal linewidths [34] [13]. Their portability allows installation in fume hoods or adjacent to reaction setups.
- Additional Analytical Modules: Systems may incorporate charged aerosol detectors (CAD), diode array detectors (DAD), and supercritical fluid chromatography (SFC) modules for orthogonal separation capabilities [38].
Control Software and Data Systems
Software integration forms the critical link between physical components and enables autonomous operation.
- Laboratory Information Management System (LIMS): Customized platforms like SAPIO LIMS track samples throughout the entire workflow, from submission to final analysis and registration [38].
- Process Control Software: Systems such as LabVision and LabManager provide recipe control, instrument monitoring, and data acquisition capabilities [13].
- Data Processing Tools: Applications like Analytical Studio automate the processing of raw chromatographic and spectral data, accelerating review and decision-making [38].
- Decision-Making Algorithms: Heuristic rule-based systems or AI-driven algorithms (Bayesian optimization, machine learning) process analytical data to determine subsequent experimental steps [37] [13].
Table 1: Core System Components for Automated Robotic-Analytical Integration
| Component Category | Specific Examples | Key Functions | Technical Specifications |
|---|---|---|---|
| Robotic Platforms | Mobile robots with grippers, Chemspeed ISynth, fixed robotic arms | Sample transport, instrument operation, sample preparation | Precision grippers, navigation capabilities, integrated vision systems |
| UPLC-MS Systems | Various commercial UPLC-MS platforms | Chromatographic separation, mass identification, quantification | Sub-2µm particle columns, MRM detection, high pH mobile phases |
| Benchtop NMR | Magritek Spinsolve Ultra, 80 MHz systems | Structural verification, reaction monitoring, quantification | No deuterated solvent requirement, 80 MHz frequency, automated shimming |
| Control Software | LabManager/LabVision, SAPIO LIMS, Analytical Studio | Workflow orchestration, data management, decision-making | Customizable Python scripts, instrument control interfaces |
Integrated Workflow Configuration
The complete integration of robotic platforms with UPLC-MS and NMR instruments establishes an automated workflow for end-to-end reaction monitoring and analysis. The following diagram illustrates the primary components and their interactions:
Workflow Execution
The autonomous operation follows a sequential cycle that mimics expert researcher decision-making:
- Synthesis Initiation: The automated synthesis platform (e.g., Chemspeed ISynth) performs chemical reactions based on an predefined experimental plan or instructions from the decision-making algorithm [37].
- Sample Aliquoting and Reformating: Upon reaction completion, the synthesizer automatically takes aliquots of each reaction mixture and prepares them in appropriate vials or plates for UPLC-MS and NMR analysis [37].
- Robotic Sample Transport: Mobile robots collect the prepared samples and transport them to the respective analytical instruments located elsewhere in the laboratory [37]. This distributed approach allows equipment sharing with human researchers.
- Parallel Analysis: The UPLC-MS and NMR instruments automatically analyze delivered samples:
- UPLC-MS: Typically uses pre-programmed methods with generic gradients to cover a wide polarity range. Data is acquired in multiple reaction monitoring (MRM) mode for targeted analysis or full-scan for untargeted analysis [15] [38].
- Benchtop NMR: Acquires proton (¹H) spectra automatically, often using quantitative NMR (qNMR) protocols with predefined acquisition parameters (4 scans, 6.55 s acquisition time, 15 s repetition time, 90-degree pulse) [13].
- Data Processing and Decision Making: Acquired data is automatically processed and analyzed. A heuristic or AI-driven decision-maker evaluates the results against pass/fail criteria (e.g., detection of expected products, sufficient conversion) to determine subsequent steps, such as scale-up, replication, or new condition exploration [37] [13].
- Iterative Experimentation: The system executes the next set of experiments based on the decision-maker's instructions, creating a closed-loop, autonomous optimization cycle [39].
Experimental Protocols
Protocol: Automated Reaction Monitoring for Compound Synthesis
This protocol describes the automated monitoring of a synthetic reaction using the integrated robotic-UPLC-MS-NMR platform, applicable to reaction optimization and discovery campaigns.
Materials and Reagents
- Reaction substrates and reagents dissolved in appropriate solvents
- LC-MS grade acetonitrile and methanol (e.g., Chromasolv)
- LC-MS grade water (e.g., Milli-Q Integral system)
- Formic acid or ammonium hydroxide for mobile phase pH adjustment
- Ethyl acetate or acetone for dilution
- Deuterated NMR solvents (if required by the NMR system)
Table 2: Research Reagent Solutions for Automated Analysis
| Reagent/Solution | Function/Purpose | Example Application/Notes |
|---|---|---|
| LC-MS Grade ACN/MeOH | UPLC mobile phase organic modifier | Provides sharp peak shape and high sensitivity in MS detection [38] |
| Ammonium Hydroxide (32%) | Mobile phase pH modifier for basic compounds | Used at high pH (e.g., 10) for improved chromatographic separation [38] |
| Formic Acid (FA) | Mobile phase pH modifier for acidic compounds | Typical concentration 0.1% in mobile phase for positive ion mode MS [38] |
| Ethyl Acetate | Solvent for reaction mixture dilution | Compatible with UPLC-MS and NMR analysis; used in Knoevenagel condensation optimization [13] |
| Dichloromethane in Acetone | Post-reaction dilution solvent | Prevents product precipitation prior to NMR analysis in flow reactor setups [13] |
Equipment and Instrumentation
- Chemspeed ISynth automated synthesizer or equivalent
- Mobile robotic agent with multipurpose gripper
- UPLC-MS system with appropriate stationary phases
- Benchtop NMR spectrometer (e.g., Magritek Spinsolve Ultra)
- Laboratory control software (e.g., LabManager/LabVision)
- Centralized data system running decision-making algorithms
Procedure
System Initialization
- Power on all instruments and initialize control software.
- Verify mobile robot navigation paths and ensure clear access to all instruments.
- Perform quality control checks on UPLC-MS and NMR systems using standard reference materials.
- In the control software, load the experimental plan detailing reaction compositions and conditions.
Reaction Setup and Execution
- Command the automated synthesizer to prepare reaction mixtures according to the experimental plan in designated vials or microtiter plates.
- Program the synthesizer to maintain specified reaction conditions (temperature, stirring, time).
- Upon reaction completion, the synthesizer automatically aliquots each reaction mixture into separate UPLC-MS vials and NMR tubes.
Automated Sample Analysis
- The mobile robot collects UPLC-MS vials and transports them to the autosampler of the UPLC-MS system.
- The UPLC-MS system executes analysis using pre-programmed methods. A typical UPLC method uses:
- Column: C18 or HILIC stationary phase
- Gradient: 5-95% organic modifier over 3-10 minutes
- Detection: MS in MRM or full-scan mode
- Simultaneously, the robot delivers NMR tubes to the benchtop NMR spectrometer.
- The NMR system acquires ¹H spectra automatically using a standard qNMR method with solvent suppression if needed.
Data Processing and Decision Cycle
- Raw UPLC-MS and NMR data are automatically transferred to the central data system.
- Software algorithms process the data: UPLC-MS data is analyzed for peak identification and quantification, while NMR spectra are evaluated for reaction-specific signatures.
- The heuristic decision-maker applies pre-defined pass/fail criteria to the combined data set:
- UPLC-MS Criteria: Detection of expected mass ions, acceptable chromatographic peak shape.
- NMR Criteria: Disappearance of starting material signals, appearance of product signals, sufficient signal-to-noise ratio.
- Reactions passing both UPLC-MS and NMR criteria are selected for further investigation (scale-up, diversification).
- The decision-maker sends new experimental instructions to the automated synthesizer for the next iteration.
System Shutdown
- After experiment completion, command the system to run cleaning cycles for fluidic paths.
- Return all robotic agents to their docking stations.
- Archive all experimental data and results in the LIMS.
Protocol: Self-Optimization of Reaction Conditions in Flow
This protocol details the configuration for autonomous real-time optimization of reaction conditions in a flow reactor using inline NMR monitoring and Bayesian optimization algorithms, based on the setup by Magritek and HiTec Zang [13].
Materials and Reagents
- Reaction substrates (e.g., salicylaldehyde and ethyl acetoacetate for Knoevenagel condensation)
- Catalyst (e.g., piperidine)
- Anhydrous solvents (e.g., ethyl acetate)
- Dilution solvent (e.g., acetone with internal standard)
Equipment and Instrumentation
- Modular flow reactor system (e.g., Ehrfeld Micro Reaction System)
- Syringe pumps (e.g., SyrDos) for reagent delivery
- Benchtop NMR spectrometer (e.g., Spinsolve Ultra) with flow cell
- Process control system (e.g., LabManager/LabVision)
- Computer running Bayesian optimization algorithm
Procedure
- System Configuration
- Set up the flow reactor with integrated NMR flow cell as illustrated in the diagram below.
- Connect the control system to regulate temperature, pressure, and pump flow rates.
- Configure the NMR spectrometer for automated, triggered acquisition using the external control mode.
- Optimization Workflow
- Prepare reactant solutions and load them into the syringe pumps.
- In the control software, define the optimization goal (e.g., maximize yield) and parameter constraints (flow rate ranges).
- Initiate the autonomous optimization cycle:
- The Bayesian algorithm proposes initial flow rate conditions.
- The system achieves steady state at these conditions.
- The NMR spectrometer automatically acquires and analyzes spectra using qNMR protocols.
- Yield is calculated based on integral ratios of reactant and product signals.
- The yield value is fed back to the optimization algorithm.
- The algorithm calculates and sets new flow rate conditions for the next iteration.
- The system continues this cycle until convergence to optimal conditions or a maximum number of iterations.
Data Management and Analysis
Effective data management is crucial for successful automated workflows. The integration of Laboratory Information Management Systems (LIMS) ensures comprehensive sample tracking and data integrity throughout the process [38].
- Centralized Data Repository: All analytical data (UPLC-MS chromatograms, NMR spectra) and experimental metadata are automatically stored in a centralized database with standardized formats to ensure Findability, Accessibility, Interoperability, and Reusability (FAIR principles) [38] [40].
- Automated Data Processing: Software tools like Analytical Studio automatically process raw chromatographic data, performing peak integration, compound identification, and purity assessment [38]. For NMR data, Python scripts or machine learning models can automate spectral analysis and interpretation [34] [41].
- Decision-Making Algorithms: Heuristic rule-based systems apply expert-defined criteria to analytical results, while AI-driven approaches use machine learning or Bayesian optimization to guide experimental progression [37] [13]. These algorithms combine orthogonal data from UPLC-MS and NMR to make robust decisions on subsequent experimental steps.
Troubleshooting and Technical Considerations
Successful implementation requires addressing several technical challenges:
- Instrument Interoperability: Standardize communication protocols and data formats across different manufacturers' equipment using standards such as SiLA (Standardization in Lab Automation) [40].
- Spatial and Temporal Biases: In microtiter plate-based systems, account for edge effects and ensure consistent heating/lighting across all wells [42].
- Data Quality Validation: Implement automated quality control checks for both UPLC-MS (peak shape, retention time stability) and NMR (linewidth, signal-to-noise ratio) data [38].
- Error Recovery: Program the system to detect and respond to common failures (clogged lines, poor spectra) through automated recovery protocols or alert generation [39].
The integration of robotic platforms with UPLC-MS and NMR instruments creates a powerful automated system for comprehensive reaction monitoring and optimization. This configuration enables continuous, closed-loop experimentation that significantly accelerates research cycles in drug discovery and chemical development. The protocols outlined provide a framework for implementing these advanced workflows, highlighting the critical importance of robust system integration, automated data analysis, and intelligent decision-making algorithms. As autonomous laboratories continue to evolve, advancements in artificial intelligence, modular robotics, and standardized interfaces will further enhance the capabilities and accessibility of these transformative technologies.
The integration of advanced liquid handling and gravimetric dispensing is revolutionizing sample preparation for UPLC-MS and NMR analysis within automated reaction monitoring platforms. These technologies are pivotal for enhancing throughput, improving data quality, and reducing solvent consumption in modern drug development pipelines. This note details protocols and data demonstrating their application in automated workflows, directly supporting the broader thesis that integrated, automated analytical systems are essential for accelerating research.
Automated, gravimetrically-controlled systems address critical bottlenecks. In high-throughput environments, manual sample preparation is a time-consuming, error-prone process that binds highly qualified resources [43]. Automation, particularly when coupled with gravimetric precision, enables the preparation of samples from the microscale (∼3.0 μmol) to traditional scales (75.0 μmol), making it adaptable for various stages of drug discovery [2]. Furthermore, a recent study highlights that gravimetric sample preparation for liquid chromatography can reduce solvent consumption by over 90% compared to traditional volumetric methods, offering significant economic and environmental benefits while maintaining high analytical accuracy [44]. This precision is crucial for generating the high-quality data required for training predictive algorithms and advancing toward self-driving laboratories [36].
The quantitative advantages of automated and gravimetric methods over manual techniques are summarized in the following tables, which compare key performance metrics and workflow specifications.
Table 1: Performance Comparison of Sample Preparation Methods
| Parameter | Manual Volumetric | Automated Gravimetric | Reference |
|---|---|---|---|
| Solvent Consumption | Baseline (High) | >90% reduction | [44] |
| Dispensing Precision | Variable (user-dependent) | ± 10 μg resolution | [43] |
| Typical Synthesis Scale | Higher scales common | 3.0 - 75.0 μmol | [2] |
| Annual Throughput | Low | ~36,000 compounds | [2] |
| Key Advantage | Low initial cost | Accuracy, efficiency, sustainability | [44] |
Table 2: Automated Gravimetric Workflow Specifications
| Workflow Tier | Synthesis Scale | Target Concentration | Typical Dead Volume |
|---|---|---|---|
| Micro (μPMC) | 0.03–1 mg (3–5 μmol) | 4 mM | ~10 μL |
| Analytical (aPMC) | >1–10 mg (10–30 μmol) | 10 mM | ~10 μL |
| Traditional (tPMC) | 10–100 mg (50–75 μmol) | 30 mM | ~25 μL |
Experimental Protocols
Protocol 1: Automated Gravimetric Solid Dispensing for Sample Reformating
This protocol describes the use of an overhead gravimetric robotic tool for the precise "pick & decision dispense" of solid compounds directly from source vials into target containers like NMR tubes or LC vials [43].
- System Setup: Configure the automated platform (e.g., Chemspeed FLEX SWILE) with the gravimetric dispensing tool, an on-deck analytical balance, a tilt/shake rack for powder loosening, and a dispenser for disposable glass tips to prevent cross-contamination [43].
- Source Vial Preparation: Load solid compounds in source vials into the designated rack. Use the tilt/shake function to loosen and tilt the powder, ensuring consistent accessibility for the tool [43].
- Tool Operation: The robotic tool, equipped with a disposable glass tip, picks up solid material. The combined weight of the tool and solid is measured gravimetrically during transport. The final dispensing decision is made using a second, on-deck balance, achieving a resolution of ±10 μg for amounts ranging from hundreds of micrograms to about 5 mg [43].
- Target Delivery: Dispense the weighed solid directly into the target vessel (e.g., an NMR tube or LC vial). The system's software (e.g., AUTOSUITE) records the exact dispensed mass [43].
Protocol 2: Integrated Automated Purification and NMR Sample Generation
This protocol outlines a high-throughput workflow for purifying reaction products and automatically generating NMR samples from the "dead volume" otherwise inaccessible during standard liquid handling, enabling structural verification without consuming material prioritized for biological assays [2].
Sample Submission and Purification Method Development:
- Submit crude samples dissolved in DMSO to the automated purification workflow via a Laboratory Information Management System (LIMS). Samples can be processed as singletons or aggregated in plates [2].
- Develop a purification method on a UPLC system (e.g., Waters) coupled with UV, ELSD, and MS detectors. Use a short, fast gradient (e.g., 3.0 min for microscale and analytical-scale workflows) [2].
- Execute the preparative purification using mass-triggered or UV-triggered fraction collection.
Fraction Processing and Reformating:
- Evaporate collected fractions in vacuo (e.g., using a Genevac system) to remove solvent [2].
- For aPMC and tPMC scales, weigh isolated fractions gravimetrically from pre-tared tubes using a robotic system (e.g., Tecan Evo-200). For μPMC scales, use ELSD for quantitation [2].
- Reformatted the majority of the purified compound in DMSO to create stock solutions at predefined concentrations (e.g., 4 mM for μPMC, 10 mM for aPMC, 30 mM for tPMC) for biological assays and storage. Take a 5 μL aliquot for quality control (QC) via UPLC to assess purity [2].
NMR Sample Generation from Dead Volume:
- Instead of discarding the dead volume (∼10 μL for aPMC/μPMC, ∼25 μL for tPMC) from the liquid handling step, recover this solution [2].
- Using a liquid handling robot (e.g., Tecan) controlled by dynamic scripts from the LIMS, add a precise volume of deuterated solvent (e.g., 250 μL) directly to the vial containing the dead volume. This action creates a ready-to-analyze NMR sample without subtracting from the main stock [2].
- Transfer the prepared NMR sample to a 1.7 mm NMR tube for data acquisition on a benchtop NMR spectrometer (e.g., Bruker Fourier 80) [2].
Workflow Diagrams
Automated Purification and NMR Workflow
Gravimetric Solid Dispensing Process
The Scientist's Toolkit: Essential Research Reagent Solutions
Table 3: Key Equipment and Consumables for Automated Sample Preparation
| Item Name | Function / Application |
|---|---|
| Gravimetric Dispensing Tool | An overhead robotic tool for precise "pick & decision dispense" of solids directly from source vials, with a typical resolution of ±10 μg [43]. |
| Disposable Glass Tips (SWINs) | Used with the gravimetric tool to eliminate cross-contamination between different solid compounds [43]. |
| Tilt / Shake Rack | Loosens and tilts powder in source vials prior to pick-up, ensuring consistent and reliable material access for the dispensing tool [43]. |
| Liquid Handling Robot | Automates liquid addition, dissolution, and reformatting steps; critical for adding deuterated solvent to dead volume for NMR sample generation [2]. |
| 1.7 mm NMR Tubes | Sample tubes for high-sensitivity NMR analysis, compatible with automated sample generation from limited material [2]. |
| Benchtop NMR Spectrometer | Online NMR device (e.g., 80 MHz) integrated into automated workflows for real-time reaction monitoring and structure verification [16] [2]. |
| Laboratory Information Management System (LIMS) | Central software that coordinates the workflow, generates instructions for automation equipment, and tracks sample data [2]. |
Real-time Nuclear Magnetic Resonance (NMR) spectroscopy has emerged as a powerful analytical technique for monitoring chemical reactions, providing unparalleled insight into reaction kinetics, mechanisms, and intermediate species. Unlike conventional analytical methods that require sample removal and preparation, real-time NMR enables the continuous, non-destructive observation of reactions under actual process conditions [45] [46]. This capability is particularly valuable for pharmaceutical development, where understanding reaction pathways and optimizing conditions are critical for process scale-up and control.
The fundamental principle underlying NMR reaction monitoring is the quantitative relationship between NMR signal intensity and concentration, allowing researchers to track the consumption of starting materials and formation of products and intermediates directly [45] [47]. Modern implementations utilize benchtop NMR spectrometers that can be installed directly in fume hoods or integrated with flow reactors, coupled with specialized software for automated data acquisition and analysis [45] [48]. This integration has positioned NMR as a robust Process Analytical Technology (PAT) tool that complements other techniques like UPLC-MS within automated reaction optimization platforms [49] [46].
Experimental Protocols
Benchtop NMR for Flow Chemistry Monitoring
The integration of benchtop NMR systems with continuous flow reactors represents a cutting-edge approach for real-time reaction monitoring and optimization. This protocol describes the setup and operation for monitoring reactions in flow mode using the Magritek Spinsolve system, though the principles apply to similar platforms [45].
Materials and Equipment:
- Spinsolve benchtop NMR spectrometer or equivalent
- Continuous flow reactor system (e.g., Ehrfeld Micro Reaction System)
- PTFE tubing (0.5-1.0 mm ID) or glass flow cell (4 mm ID)
- Peristaltic or syringe pump capable of precise flow control
- Data acquisition computer with reaction monitoring software (e.g., Mnova Reaction Monitoring)
Procedure:
- System Configuration: Install the NMR spectrometer in a fume hood near the reactor system. Connect the reactor outlet to the NMR flow cell inlet using PTFE tubing, and similarly connect the outlet back to the reactor or to a collection vessel. Ensure all connections are secure and pressure-tested if necessary.
Flow Rate Calibration: Set the pump flow rate to achieve a residence time in the NMR detection zone that allows for adequate signal acquisition. Typical flow rates range from 0.1-1.0 mL/min, depending on reactor volume and reaction kinetics.
NMR Method Development: Create an automated acquisition method with the following parameters:
- Pulse sequence: Standard 1D proton sequence
- Spectral width: 20 ppm (covering the entire chemical shift range of interest)
- Number of scans: 4-16 (balancing signal-to-noise with temporal resolution)
- Relaxation delay: 2-5 seconds (ensuring quantitative accuracy)
- Total experiment time: 30-60 seconds per spectrum
Reaction Initiation and Monitoring: Start the reaction by introducing substrates into the reactor system. Begin continuous NMR data acquisition simultaneously. The software will collect sequential spectra at regular intervals throughout the reaction.
Data Processing and Analysis: Use the reaction monitoring software to:
- Phase and baseline-correct all spectra automatically
- Identify and integrate characteristic signals for each reaction component
- Generate concentration-time profiles by plotting normalized integral values versus time
- Calculate kinetic parameters by fitting appropriate models to the concentration data
Troubleshooting Notes:
- For reactions with heterogeneous mixtures, consider using wider bore tubing to prevent clogging, though this may increase dead volume [45].
- For rapid reactions (<1 minute), increase flow rate or reduce the number of scans to improve temporal resolution.
- When monitoring multiple nuclides (e.g., 1H, 19F, 31P), implement interleaved acquisition methods to track different nuclei simultaneously [46].
Real-Time NMR for Transient Intermediate Detection
This protocol describes the use of high-field NMR to identify and characterize labile intermediates in enzyme-catalyzed reactions, based on the methodology applied to study UDP-apiose/UDP-xylose synthase (UAXS) [47]. The approach is equally applicable to other systems where transient species are involved.
Materials and Equipment:
- High-field NMR spectrometer (≥500 MHz) with temperature control
- NMR tube suitable for the reaction conditions (e.g., standard 5 mm or Shigemi tubes)
- Syringes for reagent introduction within the NMR magnet
- Data processing software capable of handling time-series data (e.g., Mnova, TopSpin)
Procedure:
- Sample Preparation: Prepare a solution containing the substrate (e.g., UDP-α-d-glucuronic acid) in appropriate buffer (80% D2O/20% H2O) to provide a lock signal. Transfer 500-600 μL to an NMR tube.
Initial Spectrum Acquisition: Place the sample in the NMR magnet and allow temperature equilibration (e.g., 25°C or 37°C). Acquire a high-resolution 1H NMR spectrum to establish the initial substrate signals.
Reaction Initiation: Without removing the sample from the magnet, introduce the enzyme (e.g., UAXS) directly into the NMR tube using a syringe with a long needle. Mix gently by inverting the syringe several times.
Real-Time Data Acquisition: Immediately begin sequential 1H NMR acquisitions with the following parameters:
- Pulse angle: 30°-45° (for rapid repetition)
- Acquisition time: 2-4 seconds
- Relaxation delay: 0.5-1.0 seconds
- Number of transients: 4-8
- Total experiment time: 30-60 seconds per spectrum
- Total duration: 2-24 hours (depending on reaction rate)
Intermediate Identification: Process the time-series data as a stack plot and identify signals that:
- Appear early in the reaction and disappear as products form
- Exhibit characteristic chemical shifts that differ from both starting materials and products
- Show appropriate coupling patterns for the proposed intermediate structure
Structural Elucidation: For promising intermediate candidates, pause the reaction at the point of maximum intermediate concentration and acquire 2D spectra (COSY, TOCSY, HSQC) to confirm connectivity and assignment.
Application Notes:
- For the UAXS reaction, this approach successfully identified the transient intermediate uridine 5'-β-l-threo-pentapyranosyl-4″-ulose diphosphate (UDP-4-keto-xylose) and the unstable product UDP-apiose, which spontaneously converts to apiofuranosyl-1,2-cyclic phosphate [47].
- The method is particularly valuable for enzyme systems where intermediates are too labile for isolation or traditional analytical approaches.
Quantitative Data and Analytical Performance
NMR Chemical Shifts for Reaction Monitoring
The following table presents characteristic 1H NMR chemical shifts for common functional groups encountered in reaction monitoring studies, serving as a reference for identifying reaction components [50].
Table 1: Characteristic ¹H NMR Chemical Shifts for Functional Groups Relevant to Reaction Monitoring
| Functional Group | Chemical Shift Range (ppm) | Notes |
|---|---|---|
| Alkyl (R-CH₃) | 0.7-1.3 | Shielded protons; reference point |
| Allylic (C=C-CH₃) | 1.6-2.0 | Slight deshielding due to adjacent sp² center |
| Alcohol (RO-H) | 1.0-5.5 | Broad, exchangeable; varies with concentration |
| Amine (RN-H) | 1.0-5.0 | Broad, exchangeable; position concentration-dependent |
| Ether (RO-CH) | 3.3-4.0 | Deshielded by oxygen atom |
| Alkene (C=CH) | 4.5-6.5 | Deshielded by sp² hybridization and magnetic anisotropy |
| Aromatic (Ar-H) | 6.5-8.5 | Strongly deshielded due to ring current |
| Aldehyde (R-CHO) | 9.0-10.0 | Strongly deshielded carbonyl group |
| Carboxylic acid (R-CO₂H) | 11.0-12.0 | Strong hydrogen bonding causes significant deshielding |
Comparison of Analytical Techniques for Reaction Monitoring
The selection of an appropriate analytical technique for reaction monitoring depends on multiple factors including sensitivity, structural information, and compatibility with reaction conditions. The following table compares NMR with alternative approaches.
Table 2: Comparison of Analytical Techniques for Real-Time Reaction Monitoring
| Parameter | NMR | UPLC-MS | DIR-MS |
|---|---|---|---|
| Quantitation | Directly quantitative without calibration [45] | Requires calibration curves [49] | Requires internal standards and matrix correction [49] |
| Structural Information | High (molecular structure, stereochemistry) | Moderate (molecular weight, fragmentation) | Low (molecular weight only) |
| Sample Preparation | Minimal (direct analysis) | Often extensive (quenching, dilution) | Minimal (direct infusion) |
| Temporal Resolution | Seconds to minutes | Minutes | Seconds |
| Sensitivity | μM-mM [49] | nM-μM [49] | nM-μM [49] |
| Compatibility with Aqueous Systems | Excellent | Good | Excellent |
| Compatibility with Flow Chemistry | Direct integration possible [45] [46] | Requires sampling and dilution | Direct integration possible |
| Detection of Unknowns | Excellent (all NMR-active nuclei) | Good (if ionizable) | Limited (if ionizable) |
Implementation in Automated Reaction Systems
Integration with Self-Optimizing Reactors
Real-time NMR has been successfully implemented in self-optimizing reactor systems that autonomously explore reaction conditions to maximize performance. These systems combine NMR analysis with intelligent process control algorithms to create closed-loop optimization [45].
A representative implementation includes:
- Spinsolve Ultra benchtop NMR spectrometer for continuous flow analysis
- LabManager and LabVision automation tools for system control
- Ehrfeld Micro Reaction System for precise parameter adjustment
- Feedback loop that uses NMR concentration data to adjust temperature, residence time, and reagent stoichiometry
In one application, this system successfully optimized a Knoevenagel condensation, identifying optimal parameters with minimal human intervention [45]. The continuous flow reactor setup offers enhanced control, faster reaction dynamics, and seamless integration of feedback for real-time optimization compared to batch reactors.
Software Solutions for Data Analysis
Specialized software packages have been developed to handle the large spectral datasets generated in real-time NMR experiments and extract meaningful kinetic information:
Mnova Reaction Monitoring:
- Automatically processes spectral arrays collected at regular intervals
- Generates concentration-time profiles by tracking signal integrals
- Provides kinetic curve fitting with mathematical functions
- Enables real-time data analysis during acquisition [48]
InsightMR 2.0:
- Integrates acquisition control with real-time data processing
- Provides on-the-fly visualization of concentration build-up curves
- Handles large datasets including hundreds of stacked spectra
- Supports interleaved experiments and parallel multi-sample analysis [46]
These software solutions significantly reduce the analysis burden and enable researchers to focus on reaction interpretation rather than data processing.
The Scientist's Toolkit: Research Reagent Solutions
Table 3: Essential Research Reagent Solutions for Real-Time NMR Reaction Monitoring
| Item | Function | Application Notes |
|---|---|---|
| Spinsolve Benchtop NMR [45] | Compact NMR spectrometer for direct installation in fume hoods | Enables on-line monitoring without cryogens; operates at 60-80 MHz; ideal for lab-based reaction monitoring |
| InsightMR Flow Unit [46] | PAT-ready flow system for on-line and in-line monitoring | Temperature-controlled transfer lines (-20 to 120°C); withstands pressures >10 bar; compatible with standard NMR probes |
| PTFE Tubing [45] | Fluid transfer from reactor to NMR flow cell | Chemically inert; various diameters available; suitable for most organic solvents |
| Glass Flow Cell [45] | Sample containment during NMR measurement | 4mm internal diameter; optimized for magnetic field homogeneity; alternative to tubing for improved spectral quality |
| Deuterated Solvents | Field-frequency lock for NMR stabilization | Essential for high-resolution experiments; can be used in mixture with protonated solvents for cost reduction |
| Tetramethylsilane (TMS) [50] | Chemical shift reference compound | Provides 0 ppm reference point; added in small quantities to reaction mixtures |
| Mnova Reaction Monitoring Software [48] | Automated processing of time-series NMR data | Kinetic curve generation; real-time analysis; academic licenses available |
| Peristaltic/Syringe Pump [45] | Controlled fluid transfer between reactor and NMR | Precise flow control (0.1-10 mL/min); chemically resistant fluid path |
Workflow Visualization
Real-time NMR spectroscopy has established itself as an indispensable tool for monitoring chemical reactions, providing unparalleled quantitative and structural information that enables researchers to elucidate reaction mechanisms, identify transient intermediates, and optimize process conditions. The development of benchtop NMR systems and specialized software solutions has made this technology increasingly accessible, allowing direct integration with reaction apparatus in both academic and industrial settings.
When implemented as part of an integrated analytical strategy that may include UPLC-MS, real-time NMR provides a comprehensive understanding of reaction pathways that neither technique could deliver alone. As the field advances, the continued development of automated systems combining NMR monitoring with intelligent feedback control promises to further accelerate reaction discovery and optimization, particularly in pharmaceutical development where understanding and controlling complex chemical transformations is paramount.
Within the broader research framework of automated reaction monitoring integrating UPLC-MS and NMR, high-throughput experimentation (HTE) has emerged as a transformative paradigm for accelerating catalyst discovery and synthetic route optimization [42]. Traditional one-variable-at-a-time (OVAT) approaches are inefficient for exploring the multidimensional chemical space of catalysts, ligands, solvents, and substrates. This application note details a standardized, miniaturized, and parallelized workflow utilizing Ultra-Performance Liquid Chromatography coupled with Mass Spectrometry (UPLC-MS) for the rapid screening and optimization of chemical reactions. The protocol is designed to support data-driven decision-making in medicinal chemistry and process development, enabling the generation of robust datasets suitable for machine learning (ML) applications [51] [42].
Materials, Instrumentation, and Reagent Toolkit
The successful implementation of a high-throughput UPLC-MS screening campaign relies on an integrated suite of automated tools and specialized reagents.
Table 1: Essential Research Reagent Solutions and Materials for HTE-UPLC-MS
| Item | Function in HTE Workflow | Key Specification/Example |
|---|---|---|
| Automated Liquid Handler | Precise nanoliter- to microliter-scale dispensing of reagents, catalysts, and substrates into microtiter plates (MTPs). Enables parallel reaction setup under inert atmosphere. | Compatible with organic solvents [42]. |
| Microtiter Plates (MTP) | Reaction vessels for parallel miniaturized synthesis. | 96-well or 384-well plates, chemically resistant [42]. |
| UPLC-MS System with High-Speed Autosampler | Core analytical engine for rapid, sequential analysis of multiple reaction aliquots. Provides quantitative conversion data and product identification. | Sub-2µm particle columns for fast separations (<3 min gradient) [2]. Autosampler capable of sampling from MTPs. |
| In-line Dilution System | Automatically dilutes reaction aliquots to an appropriate concentration for MS detection, minimizing cross-contamination and ion suppression. | Integrated with the autosampler or liquid handler. |
| Data Processing & Visualization Software | Automatically processes raw LC-MS data, calculates metrics (e.g., % conversion, yield), and presents color-coded results for instant interpretation (e.g., <40%, 40–75%, >75% conversion) [52]. | Enables export to formats (Excel, CSV) for statistical analysis and ML [52]. |
| Pretrained Molecular Representation Model | Provides rapid, calculation-free molecular descriptors for reaction prediction and catalyst prioritization before experimental screening [51]. | e.g., Uni-Mol based framework [51]. |
| Deuterated Solvents for QC-NMR | Used in integrated workflows where "dead volume" from UPLC-MS purification is rescued for automated, microscale NMR sample generation, providing orthogonal structural confirmation [2]. | DMSO-d6, etc. |
| Internal Standard (IS) | Added to each reaction well prior to analysis to normalize for variations in injection volume and MS response, improving quantification precision. | A compound inert to the reaction conditions with distinct m/z. |
Experimental Protocols
Protocol A: High-Throughput Catalyst Screening for an Asymmetric Aldol Reaction
This protocol is adapted from successful catalyst screening campaigns that identified tetrapeptide catalysts achieving up to 94% yield and 99% enantiomeric excess [51].
1. Reaction Plate Setup:
- Design: Utilize a 96-well plate. Vary the catalyst structure across rows and key reaction parameters (e.g., solvent, additive) across columns.
- Dispensing: Using an automated liquid handler under an inert atmosphere:
- Add a constant volume of substrate stock solution (e.g., in DMF or DCM) to all wells.
- Dispense varying catalyst solutions from a stock library into designated wells.
- Add solvents and reagents according to the designed matrix.
- Initiating Reaction: Add the final reagent (e.g., the electrophile) to all wells simultaneously using the liquid handler's multi-channel arm or via a rapid sequential addition protocol. Seal the plate.
- Incubation: Agitate the plate on a heated orbital shaker at the target temperature (e.g., 25°C) for a predetermined time.
2. Quenching & Sample Preparation for UPLC-MS:
- Quenching: At the designated reaction time, automatically add a standardized quenching solution (e.g., 50 µL of 1% formic acid in acetonitrile) to each well using the liquid handler.
- Internal Standard Addition: Concurrently add a fixed amount of internal standard solution to each well.
- Dilution: Perform an in-line dilution with a suitable MS-compatible solvent (e.g., acetonitrile/water 1:1) to achieve a target analyte concentration.
3. UPLC-MS Analysis:
- Chromatography:
- Column: C18 reversed-phase (e.g., 2.1 x 50 mm, 1.7-1.8 µm).
- Gradient: Fast linear gradient from 5% to 95% acetonitrile in water (both with 0.1% formic acid) over 2.5 minutes. Flow rate: 0.6 mL/min [2].
- Temperature: 40°C.
- Mass Spectrometry:
- Ionization: Electrospray Ionization (ESI), positive or negative mode.
- Scan Mode: Use Targeted Single Ion Recording (SIR) or Multiple Reaction Monitoring (MRM) for the substrate(s), product(s), and internal standard to maximize speed and sensitivity [53].
- Data Acquisition: Total cycle time per sample should be ≤ 3 minutes.
4. Data Analysis:
- Automated software imports raw files, integrates relevant peaks, and calculates the ratio of product to substrate peak areas (normalized to the internal standard).
- Results are visualized in a heat map format overlaid on the plate layout, color-coded by % conversion [52].
- Top-performing catalyst "hits" are identified for subsequent validation and scale-up.
Protocol B: Integrated HTE Workflow with Automated Purification and Microscale NMR
This protocol outlines a comprehensive DMTA (Design-Make-Test-Analyze) cycle where synthesis, UPLC-MS analysis, purification, and NMR characterization are fully integrated [2].
1. Parallel Synthesis: Conduct reactions on a microscale (3–75 µmol) in parallel [2]. 2. UPLC-MS Analysis: Analyze crude reaction mixtures using Protocol 3.1 to assess conversion and selectivity. 3. Automated Mass-Directed Purification: For reactions requiring purification, submit positive wells to an automated preparative LC-MS system. Fractions are collected based on target mass triggers. 4. Reformating & NMR Sample Generation: The purified fractions are evaporated and redissolved in DMSO to specified concentrations (e.g., 4-30 mM). A liquid handler reformats the solutions for biological testing. Crucially, the inaccessible "dead volume" (~10-25 µL) from this reformatting step is recovered [2]. 5. Microscale NMR Acquisition: The rescued dead volume is automatically diluted with deuterated solvent and transferred to a 1.7 mm NMR tube. A fully automated NMR system acquires quality ¹H NMR spectra, providing orthogonal structural verification without consuming material reserved for bioassays [2].
Results & Data Presentation
The following tables summarize quantitative outcomes achievable with the described HTE-UPLC-MS workflows.
Table 2: Performance Metrics in Catalyst Screening Applications
| Application / Target | Screening Scale | Key Analytical Method | Optimal Result Identified | Reference |
|---|---|---|---|---|
| Asymmetric Aldol Reaction | Tetrapeptide Library | UPLC-MS (Presumptive) | 94% yield, 99% enantiomeric excess (ee) | [51] |
| General Catalyst Optimization | Dozens of parallel combinations | High-throughput LC-MS | Hits categorized by conversion: >75%, 40-75%, <40% | [52] |
| Integrated Purification & Analysis | 36,000 compounds/year | UPLC-MS & Automated 1.7 mm NMR | >95% purity by HPLC; Structural confirmation via NMR | [2] |
Table 3: Comparison of High-Throughput Analysis Techniques
| Technique | Speed (per sample) | Key Advantage | Primary Limitation | Best For |
|---|---|---|---|---|
| UPLC-MS / LC-MS | 1-2 min (fast gradients) | Label-free, quantitative, provides structural info | Requires method development | Primary HTE screening, reaction monitoring |
| Direct Infusion MS | 10-20 sec | Very fast, no separation | Susceptible to ion suppression | Rapid initial screens of clean mixtures |
| Automated NMR | 5-20 min | Definitive structural information | Lower sensitivity, slower throughput | Orthogonal verification of HTE hits [2] |
| Ambient MS (e.g., ASAP) | < 1 min | No sample prep, fastest option | Limited quantitation, matrix effects | Rapid, qualitative reaction progress checks [54] |
Workflow and System Diagrams
Discussion and Best Practices
The integration of UPLC-MS into HTE frameworks represents a cornerstone of modern data-rich organic chemistry. Key to success is minimizing spatial bias in MTPs, especially for photoredox or highly exothermic reactions, through careful equipment selection and plate design [42]. Validation of UPLC-MS results with orthogonal techniques like NMR is critical when quantitative kinetics or absolute structure confirmation are required [2] [55]. The generated datasets must adhere to FAIR (Findable, Accessible, Interoperable, Reusable) principles to maximize their value for training predictive ML models, which can, in turn, guide future screening campaigns [51] [42]. This closed-loop, automated workflow—from design and synthesis through UPLC-MS analysis to purification and NMR—dramatically accelerates the DMTA cycle, reshaping the pace of catalyst discovery and synthesis optimization.
Within modern automated reaction monitoring platforms, sophisticated software solutions are crucial for handling the complex data generated by UPLC-MS and NMR systems. This document details the implementation of two key software technologies—an intuitive Drag-and-Drop Control interface and an AI-Powered Gradient Optimization system—framed within drug development research. These components work in concert to streamline experimental workflows, enhance data quality, and accelerate the iterative cycle of synthesis and analysis, which is fundamental for high-throughput experimentation and self-driving laboratory initiatives [36].
Drag-and-Drop Control for Experimental Workflow Design
A well-designed drag-and-drop interface allows researchers to visually construct and manage complex analytical workflows, thereby reducing setup time and potential for error.
User Interface Design and Interaction Protocol
The design must balance discoverability, clarity, and precise feedback throughout the interaction [56].
- Drag Affordance and Handle Design: The draggable element must be clearly indicated. For instrument control components in a web application, a dedicated drag handle is recommended. On touch devices, consider making the entire component draggable or providing a large, touch-friendly handle [57].
- Interaction States Protocol: The system must provide clear visual feedback for each state of the interaction, as Arted in Table 1.
- Accessibility Requirements: To ensure the interface is usable without a mouse, implement full keyboard support. This typically involves using the
spacekey to pick up a component, arrow keys to move it, andspaceagain to drop it. Utilize ARIA Live Regions to communicate operation status to screen reader users [57].
Table 1: Drag-and-Drop Interaction States and Feedback
| State | Trigger | Visual Feedback |
|---|---|---|
| Hover | Mouse cursor over a draggable item. | Cursor changes to "grab" or "move"; item may be highlighted. |
| Grab/Click | Mouse click or touch initiation on the item. | Cursor changes to "grabbing"; item appearance changes (e.g., opacity, border). |
| In Motion | Cursor/finger moves while holding the item. | A translucent "ghost" image of the item follows the cursor. |
| Drop-Zone Active | Dragged item is over a valid drop target. | Drop target is highlighted (e.g., changes color, displays a border). |
| Drop Complete | Mouse button/finger is released over a valid target. | Item is integrated into the drop zone; a success confirmation may be shown. |
Technical Implementation Guide
For web-based control panels, the HTML5 Drag and Drop API provides the foundation [58].
- Define Draggable Elements: Add the
draggable="true"attribute to the HTML elements representing instruments or processing steps. - Handle Drag Start: Add an event listener for the
dragstartevent to define the data being transferred. - Define Drop Targets: Add event listeners for
dragoveranddropevents to elements that can accept the dragged items.
Application in Automated Reaction Monitoring
In a reaction monitoring platform like Mnova, a drag-and-drop interface allows scientists to assemble analytical sequences intuitively [59]. For example, a researcher can drag an "NMR" icon onto a "Reaction Vessel 1" timeline, followed by a "UPLC-MS" icon, to define a scheduled analysis sequence. This visual programming approach makes complex, multi-instrument workflows easier to create and understand.
AI-Powered Gradient Optimization for UPLC-MS
AI-powered gradient optimization represents a significant leap in chromatographic method development, leveraging machine learning to autonomously achieve optimal separation conditions, thereby saving time and improving data quality [36].
Core Principle and Workflow
The system uses an algorithm, typically a form of machine learning, to iteratively refine the liquid chromatography (LC) gradient based on the outcome of previous experiments. The goal is to maximize a target function, such as the resolution of critical peak pairs, within a defined design space [36].
Detailed Experimental Protocol
This protocol outlines the steps for implementing AI-powered gradient optimization for a UPLC-MS method to separate synthetic peptides and their impurities [36].
- Step 1: Initial Parameter Definition. Define the initial chromatographic conditions and the bounds of the optimization.
- Stationary Phase: Select 2-3 candidate columns (e.g., C18, phenyl-hexyl).
- Mobile Phase: Prepare aqueous (A) and organic (B) phases suitable for MS (e.g., 0.1% formic acid in water and acetonitrile).
- Gradient Bounds: Set the minimum and maximum values for the gradient parameters to be optimized: initial %B, final %B, gradient time, and flow rate.
- Detection: Use a high-resolution mass spectrometer with a single quadrupole or Orbitrap detector for precise peak tracking [36].
- Step 2: Initial Scouting Runs. Perform a limited set of initial experiments across the defined design space (e.g., using different gradient times and temperatures) to provide the AI algorithm with baseline data.
- Step 3: AI-Driven Optimization Loop.
- The AI algorithm (e.g., a Bayesian optimizer) selects the next set of gradient parameters to test based on the previous results.
- The system automatically executes the UPLC-MS run with the proposed conditions.
- Peak detection and integration are performed automatically. Critical metrics like resolution between the target peptide and its closest eluting impurity are calculated.
- The result (the resolution value) is fed back to the AI algorithm.
- Steps 3.1-3.4 repeat until a termination condition is met, such as achieving the target resolution (>2.0) or completing a set number of iterations.
- Step 4: Method Validation. The final, optimized method is validated for robustness, precision, and accuracy according to standard laboratory practices.
Table 2: Key Parameters for AI-Powered UPLC-MS Gradient Optimization
| Parameter | Role in Optimization | Typical Range/Options |
|---|---|---|
| Initial %B | Determines starting elution strength. | 2% - 10% |
| Final %B | Determines strength for eluting all analytes. | 80% - 98% |
| Gradient Time | Impacts resolution and run duration; a key optimization variable. | 5 - 30 minutes |
| Flow Rate | Affects backpressure and efficiency. | 0.2 - 0.6 mL/min (for UPLC) |
| Column Temperature | Impacts selectivity and efficiency. | 30°C - 60°C |
| Target Function | The metric the AI seeks to maximize (e.g., resolution of a critical pair). | Resolution > 2.0 |
Integration with Automated Reaction Monitoring
The optimized UPLC-MS method can be deployed within an automated reaction monitoring platform. A robotic system can link synthesis labs to a centralized UPLC-MS, injecting samples from ongoing reactions according to a schedule [36]. The AI-optimized method ensures consistent, high-quality data for tracking reaction progress and characterizing compounds, directly supporting predictive modeling and compound design in drug discovery [36].
The Integrated Workflow
The combination of drag-and-drop control and AI-powered optimization creates a powerful, closed-loop system for automated reaction monitoring.
Diagram 1: Integrated reaction monitoring and optimization workflow.
The Scientist's Toolkit
Table 3: Essential Research Reagents and Materials
| Item | Function / Application |
|---|---|
| HILIC Silica Column | Stationary phase for separating hydrophilic metabolites in UPLC-MS, crucial for profiling polar reaction components [60]. |
| Deuterated NMR Solvents | Provides the lock signal for stable NMR acquisition and minimizes interfering solvent signals in reaction monitoring [59]. |
| Stable Isotope Standards | Internal standards for quantitative MS and NMR, correcting for instrumental variance and enabling accurate concentration measurement [60]. |
| Formic Acid / Ammonium Formate | Common mobile phase additives in LC-MS to promote protonation and improve chromatographic peak shape and ionization [60]. |
| Tetramethylsilane | Reference compound for chemical shift calibration in NMR spectroscopy, ensuring data reproducibility [61]. |
The accelerating pace of drug discovery demands rapid, efficient, and highly accurate analytical techniques to characterize newly synthesized compounds. Modern medicinal chemistry, particularly Parallel Medicinal Chemistry (PMC), has enabled the synthesis of ever-increasing numbers of compounds on progressively smaller scales, shifting the bottleneck downstream to purification and analysis [2]. This application note details an integrated, automated workflow from synthesis to analysis using LC-MS and NMR, a process critical for supporting efficient Design-Make-Test-Analyze (DMTA) cycles in pharmaceutical development [2] [38]. We present a case study implementing a high-throughput purification (HTP) and analysis platform, capable of processing tens of thousands of compounds annually, thereby significantly reducing the time from synthesis to biological testing [2].
Automated Workflow Integration
A seamless, automated workflow is foundational to modern drug discovery. The process integrates synthesis, purification, mass spectrometry, and NMR analysis into a single, continuous operation managed by a Laboratory Information Management System (LIMS) [38]. This system tracks samples from submission through purification, QC analysis, and final registration, ensuring data integrity and process consistency across global sites [38]. The implementation of such automated workflows is driven by the need for higher throughput, improved accuracy, and cost efficiency, with the lab automation market projected to grow from $5.2 billion in 2022 to $8.4 billion by 2027 [36].
Synthesis and Scale Considerations
Synthetic outputs are typically categorized into a three-tiered system based on scale to optimize the purification and analysis strategy:
- Traditional Scale (tPMC): 10–100 mg (50–75 μmol)
- Analytical Scale (aPMC): >1–10 mg (10–30 μmol)
- Micro Scale (μPMC): 0.03–1 mg (3–5 μmol) [2]
This scaling allows for the conservation of costly intermediates and aligns the purification process with the material available [2].
Experimental Protocols
High-Throughput Purification (HTP) Protocol
Principle: Automated purification of crude synthesis products using Reversed-Phase High-Performance Liquid Chromatography (RP-HPLC) or Supercritical Fluid Chromatography (SFC), both coupled to Mass Spectrometry (MS) and UV/Diode Array Detection (DAD) [38].
Procedure:
- Sample Submission: Crude samples, submitted as libraries or singletons, are registered in the LIMS (e.g., SAPIO LIMS) and aggregated into a standard microplate format [38].
- Pre-Purification Analysis (PreQC):
- Analytical Screening: An aliquot of the crude sample is automatically injected for fast LC-MS or SFC-MS analysis.
- Method Scouting: A rapid gradient (e.g., 3.0 min for μPMC/aPMC) is run on a Waters UPLC system to determine the best column, modifier, and mobile phase gradient for isolation [2]. This step uses data processing tools like Analytical Studio for automated data review [38].
- Preparative Purification:
- Scale-Up: The optimized method is transferred to the preparative-scale HPLC or SFC system.
- Fraction Collection: Target compounds are isolated by mass-triggered or UV wavelength-triggered fraction collection [2]. Multiple fractions can be collected per sample if requested.
- Platforms: Both achiral (RP-HPLC) and chiral (SFC-MS) purifications are supported within the same workflow [2].
- Post-Purification Processing:
- Solvent Evaporation: Collected fractions are evaporated in vacuo using Genevac systems, typically overnight [2].
- Quantification: Isolated compounds are quantified gravimetrically (for aPMC and tPMC) or via Charged Aerosol Detector (CAD) / Evaporative Light Scattering Detector (ELSD) quantitation for μPMC scales [2].
- Reformatting: Compounds are dissolved in DMSO at specified concentrations (e.g., 4 mM for μPMC, 10 mM for aPMC, 30 mM for tPMC) for biological testing and storage [2].
LC-MS Analysis for Purity Assessment
Principle: Ultra-Performance Liquid Chromatography (UPLC) coupled to Mass Spectrometry (MS) provides high-resolution separation and detection for assessing compound purity and identity.
Procedure:
- Sample Preparation: A 5 μL aliquot is taken from the DMSO stock and diluted to 0.5 mg/mL for quality control (QC) analysis [2].
- Chromatography:
- System: Waters UPLC system.
- Detection: Coupled to multiple detectors (UV, ELSD, MS) for comprehensive analysis [2].
- Data Analysis: The purity of the target compound is assessed by reviewing the chromatographic data (DAD, MS, CAD signals) in an automated data processing application (e.g., Analytical Studio) [38].
Integrated NMR Sample Generation and Analysis
Principle: Nuclear Magnetic Resonance (NMR) spectroscopy provides structure-based confirmation, which is crucial for unambiguous compound verification. An automated workflow rescues the "dead volume" from liquid handling systems to prepare NMR samples without consuming material prioritized for biological assays [2].
Procedure:
- NMR Sample Generation:
- Dead Volume Recovery: The inaccessible dead volume from the liquid handler reformatting step (∼10-25 μL, depending on scale) is recovered [2].
- Sample Preparation: A Tecan liquid handling robot, controlled by dynamic scripts from the LIMS, adds 250 μL of DMSO to the vials containing the dead volume, creating the NMR sample [2].
- Throughput: This workflow is integrated into the HTP platform and can process over 36,000 compounds yearly [2].
- HT-NMR Acquisition:
- Analysis: High-Throughput NMR (HT-NMR) data collection is performed, often aided by in-house-developed Python scripts to automate data analysis and reduce cycle time [38].
- Verification: Automated structure verification is applied to the NMR data, enabling NMR to serve as a routine high-throughput analysis technique comparable to UPLC-MS [2].
Data Presentation and Analysis
Workflow Performance Metrics
The implemented automated workflow demonstrates high efficiency and scalability in processing drug discovery compounds. The following table summarizes key quantitative performance data.
Table 1: Performance Metrics of the Automated Workflow
| Metric | Value | Context / Scale | Source |
|---|---|---|---|
| Annual Throughput | 36,000 compounds | Integrated Purification & NMR | [2] |
| Purification Cycle Time | 42 hours | Set of 92 samples (Novartis) | [2] |
| Purification Cycle Time | 4.5 days | Up to 100 PMC samples (Merck) | [2] |
| Analytical Gradient (μPMC/aPMC) | 3.0 minutes | Fast UPLC method scouting | [2] |
| Analytical Gradient (tPMC) | 8.5 minutes | Standard UPLC analysis | [2] |
| DMSO Stock Concentration (μPMC) | 4 mM | Post-purification reformatting | [2] |
| DMSO Stock Concentration (aPMC) | 10 mM | Post-purification reformatting | [2] |
| DMSO Stock Concentration (tPMC) | 30 mM | Post-purification reformatting | [2] |
Analytical Technique Comparison
Liquid Chromatography coupled to Mass Spectrometry (LC-MS) and Nuclear Magnetic Resonance (NMR) spectroscopy are complementary techniques. The table below outlines a comparison of these techniques in the context of automated analysis.
Table 2: Comparison of Analytical Techniques for Compound Characterization
| Parameter | LC-MS | NMR |
|---|---|---|
| Primary Information | Molecular mass, purity, hydrophobicity (logD) | Molecular structure, confirmation of regio- and stereochemistry |
| Key Advantage | High sensitivity, excellent for quantification | Unambiguous structural elucidation, non-destructive |
| Throughput | Very high | High (when automated) |
| Sample Consumption | Low | Higher (but minimized by dead-volume recovery) |
| Integration with Automation | Well-established in HTP workflows | Fully integrable into HTP workflows via automated sampling |
| Role in DMTA Cycle | Rapid purity check and identity confirmation | Definitive structural verification prior to biological testing |
The Scientist's Toolkit: Essential Research Reagents and Materials
The following table details key reagents, instruments, and software solutions that form the core of the automated synthesis-to-analysis platform.
Table 3: Essential Research Reagents and Solutions for Automated Workflows
| Item | Function / Application | Example Specifications / Notes |
|---|---|---|
| Ln-CDs (Paramagnetic Cavitands) | Hosts for paraCEST/paraGEST NMR; induce pseudo-contact shifts (PCS) in guest molecules for multiplexed detection [62]. | Library of lanthanide-cradled α-cyclodextrins (e.g., Dy-CD, La-CD). |
| Fluorinated Guests (e.g., Guest 2) | Small molecule guests for host-guest NMR dynamics; provide strong 19F-NMR signal for GEST experiments [62]. | Contains three equivalent fluorine atoms for improved signal-to-noise. |
| HPLC/SFC Solvents | Mobile phase for analytical and preparative chromatography. | LC-MS Chromasolv Acetonitrile/Methanol; 0.1% Formic Acid/Ammonium Hydroxide buffers [38]. |
| Deuterated Solvent (DMSO-d6) | Solvent for HT-NMR sample preparation. | Used for resuspending samples from the "dead volume" for NMR analysis [2]. |
| Waters UPLC/Xevo TQ-MS | High-resolution LC-MS system for analysis and method development. | Used for PreQC, FinalQC, and quantitative bioanalysis [2] [63]. |
| Automated Liquid Handler (Tecan) | For reformatting purified compounds and preparing NMR samples from dead volume. | BioMicroLab XL100; programmed via LIMS for high-throughput processing [2]. |
| SAPIO LIMS | Laboratory Information Management System for end-to-end workflow and data management. | Customized to track samples from submission to delivery, integrating with analytical software [38]. |
| Analytical Studio Software | Automated data processing for chromatographic (DAD, MS, CAD) data review. | Integrated with LIMS to accelerate decision-making in PreQC, PostQC, and FinalQC [38]. |
| waters_connect for Quantitation | Software for automated MRM method development, particularly for peptides. | Simplifies optimization of precursor/product ion pairs for multiply charged biomolecules [63]. |
The integration of automated synthesis, purification, LC-MS, and NMR analysis into a seamless workflow represents a significant advancement in pharmaceutical research and development. The case study presented herein demonstrates that through the strategic implementation of a LIMS, robotic platforms, and advanced data processing tools, laboratories can achieve a throughput of tens of thousands of compounds annually [2] [38]. The critical innovation of recovering "dead volume" for automated NMR analysis ensures the acquisition of definitive structural data without impacting the material sent for biological assays, thereby closing the loop on the DMTA cycle [2]. As the field moves towards increasingly autonomous "self-driving laboratories," the continued development and integration of these automated platforms will be essential for accelerating the discovery of new therapeutics [36].
Modern drug development laboratories face increasing pressure to accelerate innovation while managing complex, data-intensive workflows. The integration of advanced analytical techniques like UPLC-MS and NMR with centralized data management systems is pivotal for establishing a robust closed-loop system for automated reaction monitoring and optimization. Such integration enables real-time data acquisition and analysis, fostering more efficient and reproducible research outcomes [25] [64]. This application note details the protocols and benefits of creating a seamless data flow between UPLC-MS/NMR analyzers and Laboratory Information Management Systems (LIMS) and Electronic Lab Notebooks (ELN), providing a framework for enhanced operational efficiency and data integrity in pharmaceutical research.
System Architecture & Integration Workflow
A closed-loop system for automated reaction monitoring synergizes process automation, real-time analytics, and centralized data management. The architectural blueprint for this integration is depicted below.
Diagram 1. Data flow in a closed-loop reaction system. The system creates a continuous cycle where the reactor produces samples, analytics provide data, and the AI algorithm uses centralized data to optimize the process.
This architecture demonstrates a cohesive informatics ecosystem where the ELN captures unstructured experimental data, the LIMS manages structured sample information, and both systems communicate with analytical instruments and automation controllers [65] [66]. Platforms like Bruker's AUTOSUITE software exemplify this integration, enabling drag-and-drop experimentation with direct links to LIMS and ELN [25] [16]. This setup is fundamental for implementing AI/ML-driven closed-loop optimization, allowing the system to autonomously adjust reaction parameters based on real-time analytical feedback [64].
Experimental Protocols
Protocol 1: Real-Time Reaction Monitoring with Integrated UPLC-MS and NMR
Objective: To quantitatively monitor reaction progression and identify intermediates in real-time using coupled UPLC-MS and benchtop NMR, with automated data logging to ELN/LIMS.
Materials & Equipment:
- Automated reactor system (e.g., Chemputer, Chemspeed FLEX AUTOPLANT) [25] [64]
- UPLC-MS system (e.g., Waters ACQUITY UPLC with SQ Mass Detector) [67]
- Benchtop NMR spectrometer (e.g., Magritek Spinsolve or Bruker Fourier 80) [45] [16]
- Integrated software platform (e.g., AUTOSUITE, SciSure DLP) [25] [65]
Procedure:
- System Initialization: Configure the automated reactor with desired initial parameters (temperature, stir rate). Establish fluidic connections for continuous sampling from the reactor to the UPLC-MS and NMR flow cells [45] [64].
- Analytical Method Setup:
- UPLC-MS: Utilize a fast gradient (e.g., 5–95% organic solvent in 0.7 minutes) with sub-2µm particle columns. Operate the mass detector in fast-scanning mode (e.g., up to 10,000 amu/sec) with switching between positive and negative ionization modes to maximize compound detection [67].
- Benchtop NMR: Set the spectrometer to acquire repetitive 1H NMR spectra automatically (e.g., 2 scans per spectrum with a 30-second repetition time). The non-destructive nature of NMR allows the sample to be returned to the reactor or routed to the UPLC-MS for further analysis [45].
- Data Acquisition & Integration:
- Initiate the reaction and start the continuous sampling loop.
- UPLC-MS and NMR data are automatically acquired and processed. The software identifies key analyte peaks (reactants, products, intermediates) and calculates concentrations based on calibration curves or relative spectral integrals [67] [45].
- Processed results (e.g., chromatograms, spectra, concentration-time profiles) are automatically pushed to the ELN, creating a time-stamped experimental record. Sample identities and key metadata are simultaneously logged in the LIMS for full traceability [65] [66].
- Closed-Loop Feedback: The concentration-time data is fed into an optimization algorithm (e.g., in the ChemputationOptimizer software). The algorithm analyzes the reaction trajectory and sends new instructions (e.g., adjust temperature, reactant addition rate) back to the automated reactor, completing the loop [64].
Protocol 2: Self-Optimization of a Chemical Reaction
Objective: To autonomously optimize reaction yield by using real-time UPLC-MS/NMR data to guide an AI-driven search for optimal reaction conditions.
Materials & Equipment:
- As in Protocol 1.
- Optimization software (e.g., Summit, Olympus, or ChemputationOptimizer) [64].
Procedure:
- Define Optimization Parameters: Select the variable parameters to optimize (e.g., temperature, stoichiometry, catalyst loading, concentration) and define their allowable ranges. Set the objective function, typically to maximize product yield or purity as quantified by UPLC-MS/NMR [64].
- Execute Initial Experiment: The system executes the reaction using a baseline set of conditions from the initial χDL (XDL) procedure.
- Analyze and Plan: The reaction output is quenched and analyzed by UPLC-MS/NMR. The analytical result is passed to the optimization algorithm, which suggests a new set of conditions predicted to improve the outcome.
- Iterate to Optimum: The procedure is dynamically updated with the new parameters and executed again. This cycle repeats for a set number of iterations (e.g., 25–50) or until a performance target is reached, efficiently navigating the complex parameter space [64].
Results and Data Interpretation
Table 1: Comparative analysis of analytical techniques for reaction monitoring.
| Analytical Technique | Key Advantages | Quantitative Capabilities | Integration Compatibility with LIMS/ELN | Sample Throughput |
|---|---|---|---|---|
| UPLC-MS | High sensitivity, fast analysis (<1.5 min/run), provides structural information [67] | Excellent for relative quantification; requires reference standards for absolute quantification [67] | High; open-access software (e.g., OpenLynx) enables automated result reporting and emailing [67] | Very High |
| Benchtop NMR | Non-destructive, quantitative without calibration, provides rich structural data, insensitive to sample matrix [45] | Directly quantitative; concentration is linearly proportional to signal integral [45] | High; dedicated software modules (e.g., Magritek's) allow for easy data transfer and processing [45] | High (with flow systems) |
| Integrated NMR/UPLC-MS | Comprehensive metabolome/reaction mixture coverage, highly complementary data [68] | Cross-validated quantitative results from two orthogonal techniques [68] | High; a single sample preparation protocol can serve both techniques, streamlining data management [68] | Moderate to High |
Table 2: Performance outcomes of integrated closed-loop systems in reaction optimization.
| Application Example | System Components | Key Outcome | Data Management Integration |
|---|---|---|---|
| Van Leusen Oxazole Synthesis Optimization [64] | Automated reactor, HPLC, Raman, NMR, AI algorithm | Achieved up to 50% yield improvement over 25–50 autonomous iterations | χDL procedures and results stored in a searchable database for full verification and reproducibility |
| High-Throughput Reaction Screening [25] | Chemspeed FLEX AUTOPLANT, Fourier 80 NMR, AUTOSUITE | Up to 100x productivity gain over manual methods; 24-96 parallel reactions per run | Drag-and-drop software integration with LIMS and ELN for end-to-end data traceability |
| Self-Optimizing Flow Reactor [45] | Spinsolve NMR, LabManager, Micro Reaction System | Autonomous identification of optimal reaction parameters with minimal human intervention | Real-time NMR data used for immediate feedback control |
The integrated approach yields significant benefits. Real-time analytics, such as UPLC-MS and NMR, provide the immediate feedback necessary for dynamic control [67] [45]. For instance, a self-optimizing system using online NMR and AI was able to improve the yield of a reaction by up to 50% over a series of autonomous iterations [64]. The synergy between LIMS and ELN is critical here; the ELN captures the experimental context and NMR spectral interpretations, while the LIMS manages the sample lifecycle and structured UPLC-MS results, creating a complete and auditable data chain [65] [66]. The following workflow diagram illustrates the experimental process within the integrated system.
Diagram 2. The iterative cycle of automated experimentation, analysis, and optimization. This workflow enables rapid, data-driven exploration of reaction parameters, dramatically accelerating development.
The Scientist's Toolkit: Essential Research Reagent Solutions
Table 3: Key materials and software for implementing an integrated closed-loop system.
| Item / Solution | Function / Description | Example Products / Vendors |
|---|---|---|
| Automated Synthesis Platform | Executes synthetic procedures and handles liquid/solid transfers autonomously. | Chemspeed FLEX AUTOPLANT/FLEX ISYNTH, Chemputer [25] [64] |
| Benchtop NMR Spectrometer | Provides real-time, quantitative structural and concentration data directly in the lab. | Bruker Fourier 80, Magritek Spinsolve [25] [45] |
| UPLC-MS System | Delivers high-throughput, sensitive separation, detection, and identification of reaction components. | Waters ACQUITY UPLC with SQ Mass Detector [67] |
| Integrated Software Platform | Unifies instrument control, data analysis, and management; enables drag-and-drop experiment design. | Bruker AUTOSUITE, SciSure Digital Lab Platform (DLP) [25] [65] |
| Dynamic Programming Language | Encodes chemical synthesis procedures for flexible, dynamic, and reproducible execution. | χDL (XDL) [64] |
| Optimization Algorithm Suite | AI/ML algorithms that suggest new experimental conditions to efficiently find optima. | Summit, Olympus [64] |
The integration of UPLC-MS and NMR with LIMS and ELN is a cornerstone of the modern digital laboratory. This application note has detailed the protocols and infrastructure required to establish a closed-loop system that enables autonomous reaction monitoring and self-optimization. By creating a seamless flow of information from analytical instruments to centralized data management systems, research and development teams can achieve unprecedented levels of efficiency, reproducibility, and insight. The resulting acceleration from ideation to commercialization is a critical competitive advantage in fast-paced fields like drug discovery and specialty chemical development.
Maximizing Efficiency: Troubleshooting and AI-Driven Optimization
Common Pitfalls in Automated Sample Preparation and How to Avoid Them
Automated sample preparation is a critical component in modern analytical workflows, particularly for UPLC-MS and NMR-based reaction monitoring in drug development. While automation significantly enhances throughput and reproducibility, improper implementation can introduce systematic errors that compromise data integrity. This application note details common pitfalls encountered during automated sample preparation for UPLC-MS and NMR analyses, providing evidence-based avoidance strategies and detailed protocols to ensure reliable, reproducible results for researchers and scientists in pharmaceutical development.
Common Pitfalls and Strategic Solutions
Incomplete Metabolic Quenching and Metabolite Degradation
A fundamental pitfall in metabolomics sample preparation is incomplete quenching of metabolic activity, which leads to rapid turnover of labile metabolites and misrepresentation of the true metabolic state [69]. For analytes like ATP and glucose 6-phosphate, which can turnover in less than one second, quenching method selection is critical [69].
Experimental Protocol for Effective Quenching:
- Cell Culture Handling: For suspension cultures, use fast filtration followed by immediate placement of the filter into cold quenching solvent. For adherent cultures, aspirate media and directly add cold acidic acetonitrile:methanol:water solvent [69].
- Quenching Solvent Optimization: Prepare quenching solvent with 0.1 M formic acid in cold acetonitrile:methanol:water (recommended ratio: 40:40:20). Acid concentration is critical—0.02 M is insufficient to prevent metabolite interconversion [69].
- Neutralization: After quenching, immediately neutralize with ammonium bicarbonate (NH₄HCO₃) to prevent acid-catalyzed metabolite degradation [69].
- Validation: Spike labeled isotope standards (e.g., 13C or 15N) into quenching solvent to track potential interconversion artifacts, such as 3-phosphoglycerate to phosphoenolpyruvate or ATP to ADP conversion [69].
Liquid Handling Inaccuracies and Cross-Contamination
Automated liquid handling systems, while reducing manual error, can introduce precision issues, particularly with small volumes. A pipetting inaccuracy of just 5% can result in significant variation—for example, causing a 2 ng difference in template DNA, critically impacting NGS library preparation and subsequent sequencing coverage [70].
Mitigation Protocol:
- Regular Calibration: Establish a rigorous calibration schedule for liquid handlers using gravimetric analysis for volumes ≤50 μL and spectrophotometric methods for larger volumes.
- Tip Selection and Conditioning: Use low-retention tips and implement pre-rinsing with the sample solution to minimize surface adsorption effects [71].
- Cross-Contamination Prevention: Incorporate adequate air gaps between aspirations and dispenses, and use disposable tips for critical samples. Include DNA-free control samples in each run to detect contamination events [70].
- Process Verification: Implement dye-based tests to verify liquid dispensing accuracy across all positions in 96- or 384-well plates quarterly.
Sample Preparation Incompatibility with Analytical Platform
Improper sample preparation that doesn't align with the specific requirements of the downstream analytical platform (UPLC-MS vs. NMR) yields suboptimal data. For NMR-based metabolomics, inadequate sample preparation can severely compromise spectral quality and quantitative accuracy [72].
Platform-Specific Optimization:
- NMR Sample Preparation (Blood/Serum): Use methanol extraction protocols, which demonstrate superior performance in terms of repeatability, signal-to-noise ratio, and metabolite extraction efficiency compared to skimming, ultrafiltration, or ultracentrifugation methods [72].
- UPLC-MS Sample Preparation: For mass spectrometry, solid-phase extraction (SPE) provides excellent clean-up and concentration. Select sorbents based on analyte physicochemical properties (e.g., reversed-phase for hydrophobic compounds, ion-exchange for charged analytes) [73].
- Solvent Compatibility: Ensure extraction solvents are compatible with the analytical mobile phases. For UPLC-MS, avoid non-volatile buffers and salts that cause ion suppression and source contamination [69].
Inadequate Process Integration and Error Recovery
Automated systems often function in isolation without robust error recovery processes, leading to process interruptions and sample loss. This is particularly problematic in multi-step workflows such as cell line development for mAb production, where 20-50 samples are processed in parallel [74].
Integration Protocol:
- Error Recovery Design: Implement automated systems with sophisticated error recovery protocols that can address common failures (e.g., clogs, insufficient volume, aspiration errors) without complete workflow termination [74].
- Walkaway System Configuration: Utilize systems that provide full walkaway automation with integrated clarification and purification steps. For example, combined clarification and purification of 24 mAb-expressing cell culture samples can be completed in approximately 2 hours with proper integration [74].
- Real-time Monitoring: Incorporate pressure sensors and liquid level detection to identify process anomalies immediately, allowing for automated corrective actions or operator alerts.
Workflow Visualization
The diagram above illustrates the integrated automated sample preparation workflow with three critical control points where pitfalls commonly occur and their corresponding solutions. Implementing these solutions at the appropriate workflow stages ensures sample integrity throughout the process.
Quantitative Error Reduction Data
Table 1: Error Reduction through Automated Sample Preparation
| Error Category | Manual Process Error Rate | Automated Process Error Rate | Reduction Percentage | Key Mitigation Strategy |
|---|---|---|---|---|
| Pipetting Inaccuracy | 5% volume variation [70] | <1% volume variation | >80% | Regular liquid handler calibration |
| Pre-analytical Errors | 46-68.2% of total errors [75] | 7-13.3% of total errors [75] | ~75% | Integrated sample tracking |
| Cross-Contamination | 19% operator error rate [73] | <2% occurrence rate | ~90% | Disposable tips & air gaps |
| Sample Identification | 30% sample processing errors [73] | <5% misidentification | ~83% | Barcode/RFID integration [76] |
Table 2: Platform-Specific Sample Preparation Recommendations
| Analytical Platform | Optimal Preparation Method | Extraction Efficiency | Repeatability (CV%) | Critical Considerations |
|---|---|---|---|---|
| NMR | Methanol extraction [72] | High (85-95%) | <10% | Avoid multiple preparation steps |
| UPLC-MS | Solid-Phase Extraction [73] | High (>90%) | <15% | Volatile buffers required |
| GC-MS | Chemical derivatization | Moderate (70-85%) | <20% | Complete derivatization critical |
The Scientist's Toolkit: Essential Research Reagent Solutions
Table 3: Essential Reagents for Automated Sample Preparation
| Reagent/Consumable | Function | Application Notes |
|---|---|---|
| Acidic Acetonitrile:MeOH:H₂O | Metabolic quenching | 0.1M formic acid critical for complete enzyme denaturation [69] |
| Ammonium Bicarbonate | Neutralization agent | Prevents acid-catalyzed degradation post-quenching [69] |
| 13C/15N Labeled Standards | Process monitoring | Spiked during quenching to detect metabolite interconversion [69] |
| Methanol (HPLC Grade) | Metabolite extraction | Optimal for NMR-based metabolomics of biofluids [72] |
| SPE Cartridges/Plates | Sample clean-up | Select sorbent chemistry based on analyte properties [73] |
| Magnetic Beads | Automated purification | Compatible with KingFisher systems for nucleic acid/protein extraction [77] |
| Barcode/RFID Labels | Sample tracking | Pre-printed labels prevent identification errors [76] |
Automated Reaction Monitoring Protocol for UPLC-MS/NMR
Automated Metabolite Extraction from Cell Cultures
Purpose: To provide a standardized method for automated metabolite extraction from cell cultures for UPLC-MS and NMR analysis, ensuring quantitative metabolite recovery while preventing degradation.
Materials:
- Automated liquid handling system (e.g., Thermo Scientific KingFisher, Biosero-integrated systems)
- Cold acidic acetonitrile:methanol:water (40:40:20 with 0.1 M formic acid)
- Ammonium bicarbonate solution (1 M)
- 96-well SPE plates (appropriate chemistry for target analytes)
- Internal standard mixture (13C-labeled metabolites)
Procedure:
- Quenching: Transfer 100 μL of cell culture to 400 μL of cold acidic acetonitrile:methanol:water in a 96-well deep well plate using automated liquid handling.
- Mixing: Execute orbital mixing at 4°C for 15 minutes to ensure complete extraction.
- Neutralization: Add 50 μL of ammonium bicarbonate solution to neutralize the extract.
- Clarification: Centrifuge at 4000 × g for 10 minutes at 4°C.
- Supernatant Transfer: Automatically transfer supernatant to a clean 96-well plate using integrated robotics.
- Concentration: Evaporate samples to dryness under nitrogen at 4°C using automated evaporation station.
- Reconstitution: Reconstitute in 100 μL of UPLC-MS compatible solvent or NMR buffer.
- Analysis: Transfer to autosampler vials for immediate UPLC-MS or NMR analysis.
Validation:
- Spike recovery should be 85-115% for target analytes
- Process 6 quality control samples per 96-well plate
- Internal standard peak area CV <15% indicates satisfactory performance
Integrated Sample Tracking and Data Management
Purpose: To ensure sample integrity and data traceability throughout the automated workflow.
Materials:
- Laboratory Information Management System (LIMS)
- Barcode/RFID labels and printer
- Automated sample tracking software (e.g., Green Button Go)
Procedure:
- Pre-labeling: Affix pre-printed barcode labels to all sample containers before processing [76].
- Digital Integration: Integrate barcode scanner with automated liquid handlers and LIMS.
- Process Monitoring: Use orchestration software to track sample location and process completion at each workflow stage [75].
- Data Recording: Automatically record instrument parameters, quality control metrics, and sample handling events in the LIMS.
- Chain of Custody: Maintain digital trail of all sample manipulations from collection to analysis.
Automated sample preparation for UPLC-MS and NMR reaction monitoring offers substantial benefits in throughput and reproducibility but requires careful attention to critical parameters including quenching efficiency, liquid handling accuracy, platform-specific optimization, and process integration. Implementation of the detailed protocols and quality control measures described in this application note will enable researchers to avoid common pitfalls, thereby generating reliable, reproducible data essential for informed decision-making in drug development workflows.
Ultra-Performance Liquid Chromatography coupled with Tandem Mass Spectrometry (UPLC-MS/MS) has become a cornerstone analytical technique in modern drug discovery and development. Its high speed, sensitivity, and specificity make it indispensable for applications ranging from pharmacokinetic studies and therapeutic drug monitoring to synthetic reaction monitoring and metabolomics [78] [79] [80]. This application note is framed within a broader thesis investigating integrated analytical platforms, particularly the synergistic combination of UPLC-MS and Nuclear Magnetic Resonance (NMR) spectroscopy, for automated reaction monitoring and biomarker discovery [81] [82]. NMR provides robust, quantitative data with minimal sample preparation and is highly complementary to the superior sensitivity and specificity of MS [81] [83]. Optimizing the UPLC component—specifically the judicious selection of mobile phase composition and column chemistry—is critical for achieving the high-resolution separations necessary for accurate quantitation, especially in complex biological matrices or reaction mixtures [78] [84]. This note provides detailed protocols and data-driven guidelines for these optimization parameters.
Core Principles & Optimization Strategies
Mobile Phase Selection
The mobile phase acts as the transport medium and significantly influences analyte retention, peak shape, and ionization efficiency in the MS source.
- Organic Modifier: Acetonitrile (ACN) is most commonly preferred over methanol due to its lower viscosity, which enables faster separations at lower backpressures and often improves peak shapes [85] [80]. The gradient steepness (e.g., 5 to 95% B in 0.7 minutes) is a key variable optimized for speed and resolution [85].
- pH and Additives: Volatile acids and buffers are mandatory for MS compatibility. Formic acid (0.1%) is a ubiquitous additive for promoting positive ionization [85] [80]. Ammonium acetate or formate (e.g., 5 mM) are common choices for buffering capacity, aiding in the separation of ionizable compounds [83] [84]. The choice can drastically affect the selectivity for acids, bases, and zwitterions.
- Chemometric Optimization: Advanced method development can employ Design of Experiments (DoE) to systematically optimize multiple interrelated parameters simultaneously, such as gradient steepness, organic solvent percentage, and flow rate, to maximize peak area, resolution, and minimize peak width [78].
Column Chemistry
The stationary phase defines the primary mechanism of separation and is selected based on analyte physicochemical properties.
- Fixed Phase: C18 columns remain the workhorse for reversed-phase separations of small molecules and drugs due to their broad applicability [80]. C8 or phenyl columns offer alternative selectivity for more hydrophobic compounds or those requiring different selectivity [85]. For polar metabolites or nucleoside analogs, HILIC (Hydrophilic Interaction Liquid Chromatography) columns may be necessary.
- Particle Technology: Sub-2µm particles are standard for UPLC, providing high efficiency and narrow peak widths (~1 second), which demands fast MS scan speeds [85] [86].
- Column Dimensions: Shorter columns (e.g., 30-50 mm length) with internal diameters of 2.1 mm are typical for high-speed, high-sensitivity analyses coupled to MS [85] [80].
- Temperature: Elevated column temperature (e.g., 40-45°C) is frequently used to reduce mobile phase viscosity, improving efficiency and lowering backpressure [85] [80].
Detailed Experimental Protocols
Protocol 1: Method Development for Simultaneous Quantitation of Drugs and Metabolites
This protocol is adapted from validated methods for analytes like parsaclisib, anti-HIV NRTIs, and APRT deficiency markers [78] [80] [84].
1. Sample Preparation:
- Use protein precipitation for plasma/serum samples. Add a 3:1 (v/v) ratio of cold acetonitrile (often with 0.1-1% formic acid) to the sample [80] [84].
- Vortex vigorously for 1 minute, then incubate at -20°C for 20 minutes to enhance protein precipitation [83].
- Centrifuge at >13,000 x g for 10-15 minutes at 4°C [80].
- Transfer the clear supernatant to an autosampler vial for analysis. For very low concentrations, the supernatant may be evaporated under nitrogen or vacuum and reconstituted in a smaller volume of initial mobile phase [78] [84].
2. UPLC-MS/MS Conditions:
- System: Waters ACQUITY UPLC I-Class or equivalent coupled to a triple quadrupole mass spectrometer (e.g., Xevo TQ-S) [80].
- Column: ACQUITY UPLC BEH C18, 2.1 x 50 mm, 1.7 µm [80]. For alternative selectivity, test a BEH C8 column (2.1 x 30 mm, 1.7 µm) [85].
- Column Temperature: 40°C [80].
- Mobile Phase: A: 0.1% Formic Acid in Water; B: 0.1% Formic Acid in Acetonitrile [85] [80].
- Flow Rate: 0.3 - 0.8 mL/min [85] [80].
- Gradient: A rapid gradient is typical. Example: 0-0.5 min (10% B), 0.5-1.0 min (10→90% B), 1.0-1.4 min (hold at 90% B), 1.4-1.5 min (90→10% B), re-equilibrate at 10% B until 2.0 min [80].
- Injection Volume: 1-5 µL.
- MS Detection: Electrospray Ionization (ESI) in positive or negative mode, as required. Use Multiple Reaction Monitoring (MRM). Typical source parameters: Capillary Voltage 3.0 kV, Cone Voltage 20-40 V, Source Temp 150°C, Desolvation Temp 400-500°C, Desolvation Gas Flow 500-1000 L/Hr [85] [82].
3. Validation Parameters (Per FDA/EMA Guidelines):
- Linearity: Prepare calibration curves in the relevant matrix (e.g., 2-2000 ng/mL). Assess using correlation coefficient (r² ≥ 0.99) [78] [80].
- Accuracy & Precision: Analyze Quality Control (QC) samples at low, medium, and high concentrations across multiple runs. Acceptable criteria: Accuracy within ±15% of nominal value, Precision (CV) < 15% [78] [84].
- Recovery & Matrix Effect: Evaluate by comparing analyte response in post-extraction spiked samples to neat solutions. Use stable isotope-labeled internal standards (SIL-IS) to correct for matrix effects [84].
- Stability: Assess analyte stability in matrix under storage (e.g., -80°C), freeze-thaw cycles, and in the autosampler [78] [79].
Protocol 2: NMR-Guided MS Quantitation for Metabolomics
This protocol leverages the quantitative strength of NMR to calibrate MS, enhancing absolute quantitation in metabolomics [83] [87].
1. Unified Sample Preparation for NMR and MS:
- Precipitate proteins from serum/plasma using a 1:2 (v/v) ratio of sample:methanol [83].
- Vortex, incubate at -20°C for 20 min, and centrifuge at 13,400 rcf for 30 min.
- Split the supernatant: one part for NMR analysis (dried and reconstituted in D₂O phosphate buffer with TSP reference), another part diluted for direct LC-MS/MS analysis [83].
2. NMR Quantitation:
- Acquire ¹H NMR spectra on a high-field spectrometer (e.g., 800 MHz) using a water-suppressed pulse sequence (e.g., CPMG).
- Quantitate metabolites using software (e.g., Chenomx NMR Suite) by fitting spectral lines against a reference library, using TSP for absolute concentration determination [83] [87].
3. MS Calibration and Analysis:
- Use the absolute concentrations obtained from one representative sample (e.g., a pooled sample) via NMR as the primary calibrants for the LC-MS/MS assay.
- Analyze all samples using a targeted LC-MS/MS method. The NMR-derived concentrations of the calibrant sample replace traditional standard curves for those metabolites.
- Correlate the MS response factors (peak area/concentration) from the NMR-calibrated sample to quantify the same metabolites in all other samples [83].
Table 1: Optimization Parameters from Selected UPLC-MS/MS Method Developments
| Analyte(s) / Application | Fixed Phase | Mobile Phase (A/B) | Key Optimized Parameters & Results | Source |
|---|---|---|---|---|
| APRT Deficiency Markers (DHA, allopurinol, etc.) | Not Specified | Not Specified | DoE used to optimize gradient, flow, temp, cone voltage. Linearity: r²≥0.99 over 50-5000 ng/mL. Accuracy: -10.8 to 8.3%. Precision: CV <15%. | [78] |
| Synthetic Reaction Monitoring (Atenolol synthesis) | BEH C8, 2.1x30mm, 1.7µm | A: 0.1% FA in H₂O; B: 0.1% FA in ACN | Fast Gradient: 5-95% B in 0.7 min. Flow: 0.8 mL/min. Temp: 45°C. Enabled cycle time of 1 min 20 sec. | [85] |
| Parsaclisib (PI3Kδ inhibitor) | BEH C18, 2.1x50mm, 1.7µm | A: 0.1% FA in H₂O; B: ACN | Gradient: 10→90% B in 1 min. Run Time: 2.0 min. Validation: Accuracy 2.0-14.9%, Precision <8.6%. | [80] |
| Anti-HIV NRTIs (TAF, TFV, etc.) | Reversed Phase C18 | Not Specified | Sensitivity: LLOQ as low as 2.00 ng/mL. Specificity: No interference from concomitant drugs. Used SIL-IS to overcome matrix effects. | [84] |
| Saliva Metabolomics (Metabolites & Lipids) | Various for LC-MS/MS | Not Specified | Complementary Platform: NMR quantified 45 soluble metabolites; targeted LC-MS/MS quantified 24 bioactive lipids. Highlights platform-specific coverage. | [87] |
Visualization of Workflows
Diagram 1: UPLC-MS Method Development & Optimization Workflow (Max 760px)
Diagram 2: NMR-Guided MS Synergy for Absolute Quantitation (Max 760px)
The Scientist's Toolkit: Key Research Reagent Solutions
Table 2: Essential Materials for UPLC-MS Method Development and Analysis
| Item | Function & Rationale | Example/Note |
|---|---|---|
| UPLC Chromatography Column | Provides the critical separation. Particle size (<2µm) and stationary phase (C18, C8) dictate efficiency and selectivity. | ACQUITY UPLC BEH C18, 1.7µm, 2.1x50mm [80]. |
| Triple Quadrupole Mass Spectrometer | Enables highly specific and sensitive detection via Multiple Reaction Monitoring (MRM). | Waters Xevo TQ-S, Sciex 7500+ [80] [86]. |
| Mass Spectrometry-Compatible Solvents | High-purity, LC-MS grade solvents minimize background noise and ion suppression. | LC-MS Grade Acetonitrile, Methanol, Water. |
| Volatile Buffers & Additives | Modify mobile phase pH and ion-pairing properties without fouling the MS source. | Formic Acid, Ammonium Acetate, Ammonium Formate. |
| Stable Isotope-Labeled Internal Standards (SIL-IS) | Essential for correcting for variable sample matrix effects and recovery during quantitation. | ¹³C/¹⁵N-labeled analogs of target analytes [84]. |
| Protein Precipitation Reagents | For clean-up of biological samples (plasma, serum). Acetonitrile with acid often gives optimal recovery. | Cold Acetonitrile with 0.1-1% Formic Acid [83] [84]. |
| Filtration Devices | To remove particulates after sample prep, protecting the UPLC column and system. | 0.22µm or 0.45µm PVDF or PTFE syringe filters [83]. |
| Certified Autosampler Vials & Inserts | Ensure consistency in sample injection volume and prevent analyte adsorption or leaching. | Low-volume inserts (e.g., 250µL) in certified vials. |
Optimizing mobile phase composition and column chemistry is fundamental to developing robust, sensitive, and high-throughput UPLC-MS/MS methods. As demonstrated across diverse applications—from therapeutic drug monitoring of anti-HIV drugs [84] to pharmacokinetic studies of novel inhibitors [80]—principled selection of volatile acidic modifiers, acetonitrile gradients, and sub-2µm C18 columns forms a reliable foundation. Furthermore, the integration of this optimized UPLC-MS platform with quantitative NMR spectroscopy, as part of a broader automated analysis thesis, presents a powerful synergistic approach [81] [83]. This combination leverages the absolute quantitation capability of NMR to anchor and validate MS-based assays, ultimately leading to more comprehensive and reliable data for drug development and systems biology research. Future directions include greater automation of method optimization using DoE and AI, and seamless software integration for combined NMR-MS data analysis.
Ensuring NMR Spectral Quality in Flow-Through Systems
Within the framework of advanced analytical methodologies for automated reaction monitoring, the integration of Ultra-Performance Liquid Chromatography-Mass Spectrometry (UPLC-MS) and Nuclear Magnetic Resonance (NMR) spectroscopy represents a powerful synergy. NMR spectroscopy provides unparalleled structural elucidation and inherent quantitative capabilities, making it an indispensable tool for monitoring reaction kinetics, identifying intermediates, and quantifying yields in real-time [8] [88]. However, when NMR is deployed in a flow-through system—where a reaction mixture is continuously pumped from a reactor through an NMR flow cell—maintaining exemplary spectral quality is paramount. High spectral quality, characterized by excellent signal-to-noise ratio (SNR), resolution, and line shape, is the foundation for extracting reliable and actionable data. This application note details the critical parameters and protocols essential for ensuring robust NMR spectral quality in flow-through systems, contextualized within automated reaction monitoring research that couples NMR with UPLC-MS.
Critical Parameters Affecting Flow NMR Spectral Quality
The integrity of NMR data acquired in flow mode is governed by several interconnected experimental parameters. Understanding and optimizing these factors is crucial for achieving data quality comparable to, or even surpassing, traditional static NMR measurements.
Solvent Composition and Signal Locking
The choice of solvent directly impacts both NMR performance and compatibility with downstream MS detection. A primary challenge in flow NMR is maintaining a stable magnetic field lock, traditionally achieved using deuterated solvents.
Table 1: Solvent Selection for LC-MS-NMR Flow Systems
| Solvent System | NMR Locking Capability | LC-MS Compatibility | Key Considerations |
|---|---|---|---|
| Fully Deuterated Solvents (e.g., CD₃OD, ACN-d₃) | Excellent | High | Ideal for NMR lock and shim; higher cost; minimal deuterium isotope effects in LC [4]. |
| Mixed Protonated/Deuterated (e.g., 90% CH₃OH / 10% CD₃OD) | Good | High | Cost-effective; provides sufficient deuterium for lock; a versatile and effective choice for multi-platform analysis [89]. |
| Deuterated Buffer in H₂O (e.g., D₂O buffer) | Good | High | Common for bioanalytical applications; cost-effective for the aqueous phase; ensures pH stability [4] [68]. |
| Fully Protonated Solvents with Solvent Suppression | Not Required | High | Requires advanced solvent suppression sequences (e.g., WET); eliminates deuterated solvent cost; best suited for benchtop NMR without a lock system [13] [88]. |
Modern protocols successfully employ mixed solvents, such as methanol with a 10% addition of deuterated methanol, which provides an excellent compromise, offering a cost-effective deuterium lock for high-field spectrometers while remaining fully compatible with LC-MS analysis [89]. Studies have confirmed that using deuterated solvents for NMR preparation does not lead to significant deuterium incorporation into metabolites, preserving the mass spectrometry data's integrity [68]. For benchtop NMR systems, which do not require deuterated solvents for locking, the use of fully protonated solvents coupled with robust solvent suppression pulse sequences is a viable and economical strategy [13].
Flow Hydrodynamics and Relaxation Effects
The dynamics of the flowing sample introduce specific considerations for the NMR experiment. To minimize line shape distortions and ensure accurate quantification, the flow must be halted during data acquisition (stopped-flow mode) or be sufficiently slow to allow for complete longitudinal (T1) relaxation between scans [8]. In stopped-flow mode, the sample is stationary in the flow cell during acquisition, yielding spectra identical to static conditions. In true on-flow mode, the flow rate must be managed to avoid T1-related quantification errors and signal broadening due to flow-induced turbulence. The relaxation delay (d1) in the pulse sequence must be optimized to be significantly longer than the longitudinal relaxation times (T1) of the nuclei of interest when the sample is in motion.
Experimental Protocols for Optimal Flow NMR
Protocol: System Setup and Calibration for Reaction Monitoring
This protocol outlines the steps for configuring a flow NMR system integrated with a reactor and UPLC-MS.
- Hardware Configuration: Connect the reactor outlet to the inlet of the NMR flow cell using appropriate tubing (e.g., PEEK). The outlet of the flow cell can then be directed to a waste container or, for comprehensive analysis, to an MS instrument via a splitter. Ensure temperature control for the transfer lines to maintain sample integrity [88].
- Flow Cell Preparation: Verify that the NMR flow cell is clean and properly installed in the spectrometer. The flow cell's active volume should be matched to the reactor scale and the sensitivity of the NMR probe.
- System Calibration:
- Shimming: With the chosen solvent flowing through the system at the intended operational rate, perform automated shimming to achieve optimal magnetic field homogeneity. For systems with a stable lock, this may only be required once at the beginning of a series of experiments.
- Pulse Calibration: Precisely calibrate the 90° pulse width for the nucleus of interest (e.g., ¹H) under stopped-flow conditions.
- Spectral Referencing: Use an internal standard (e.g., TMS or TSP) or the residual solvent peak for chemical shift referencing.
Protocol: Quantitative Kinetic Profiling
This protocol describes a method for acquiring quantitative time-course data to monitor reaction progress.
- Initialization: Start the reaction and initiate flow from the reactor to the NMR system. Allow the system to reach a steady state.
- Data Acquisition:
- Pulse Sequence: Use a simple 1D pulse sequence (e.g., zg or with solvent suppression like WET if needed). The ¹H nucleus is typically used due to its high sensitivity [8].
- Acquisition Parameters: Set the acquisition time (aq) to capture the desired spectral width with sufficient digital resolution. A relaxation delay (d1) of 1-3 times the estimated longest T1 of key analytes is critical for quantitative accuracy [8]. The number of scans (ns) should be chosen to balance SNR and temporal resolution.
- Automation: Utilize automated kinetic software (e.g., InsightMR) to acquire sequential spectra over the reaction's duration [88]. For long-term reactions, interleaved experiments or automated locking and shimming can be implemented.
- Data Processing and Analysis:
- Process the series of spectra (e.g., Fourier transformation, phasing, baseline correction). Automated processing software can handle hundreds of spectra efficiently [8].
- Integrate resolved peaks for reactants, products, and/or intermediates in each spectrum.
- Plot the integral values against time to generate kinetic profiles for yield, conversion, and mechanism elucidation.
Diagram 1: Integrated Flow Reactor Monitoring Setup
The Scientist's Toolkit: Essential Research Reagents and Materials
Table 2: Key Research Reagent Solutions for Flow NMR
| Item | Function | Example & Notes |
|---|---|---|
| Deuterated Solvents | Provides signal lock and shim stability for high-field NMR. | CD₃OD, ACN-d₃, D₂O. Use 100% or as an additive (e.g., 10% in protonated solvent) [89] [4]. |
| NMR Flow Cell/Probe | Holds the sample in the magnetic field for analysis in a continuous flow. | Commercial flow probes (e.g., Bruker InsightMR Flow Tube) or custom microcoil probes [90] [88]. |
| Chemical Standards | For quantification (qNMR), chemical shift referencing, and system performance validation. | TSP, TMSP, maleic acid. An internal standard allows for precise concentration measurements [91]. |
| Tubing & Fittings | Transfers reaction mixture from reactor to NMR and to MS. | PEEK tubing is common; chemically resistant but can swell with DMSO/CH₃OH [90]. |
| Solvent Suppression Kit | Pulse sequences and software for suppressing large solvent signals when using protonated solvents. | WET, PRESAT. Essential for benchtop NMR and high-concentration solvents [4] [88]. |
| Process Control Software | Automates data acquisition, processing, and enables feedback control for reaction optimization. | Bruker InsightMR, HiTec Zang LabVision. Integrates NMR data with reactor control [13] [88]. |
Achieving high-quality NMR spectra in flow-through systems is a multifaceted endeavor that hinges on the careful optimization of solvent composition, flow dynamics, and acquisition parameters. The protocols and parameters outlined herein provide a robust foundation for implementing flow NMR within an automated reaction monitoring platform that synergistically includes UPLC-MS. By adhering to these guidelines, researchers can leverage the full quantitative and structural elucidation power of NMR to gain deep insights into reaction pathways, accelerate process optimization, and ensure the highest data quality in their scientific pursuits.
Leveraging AI and Machine Learning for Autonomous Method Development
The integration of Artificial Intelligence (AI) and Machine Learning (ML) is revolutionizing analytical chemistry by enabling autonomous method development for techniques such as Ultra-Performance Liquid Chromatography-Mass Spectrometry (UPLC-MS) and Nuclear Magnetic Resonance (NMR) spectroscopy. This paradigm shift is particularly transformative for automated reaction monitoring in pharmaceutical research and development, where it accelerates the transition from discovery to validation. These technologies facilitate the creation of self-optimizing systems capable of autonomously exploring experimental parameters to maximize performance metrics such as yield, sensitivity, and specificity [13] [92].
The core of this advancement lies in the synergy between intelligent algorithms and advanced analytical hardware. AI-driven systems can process real-time analytical data from inline NMR spectrometers or mass spectrometers, using feedback loops to iteratively refine method parameters with minimal human intervention. This not only enhances laboratory productivity and capacity but also improves the reproducibility and reliability of analytical data, which is crucial for drug development professionals engaged in complex reaction optimization and metabolite identification [13] [92].
AI and ML Foundations for Analytical Chemistry
Core Machine Learning Paradigms
The application of ML in analytical chemistry spans several paradigms, each with distinct strengths for processing complex spectral data. Deep Neural Networks (DNNs), particularly Convolutional Neural Networks (CNNs), have demonstrated remarkable capabilities in deconvoluting highly crowded NMR spectra, rivaling the proficiency of human experts in peak identification tasks [93]. These systems are trained on extensive databases of spectral information, enabling them to recognize patterns and identify peaks even in regions with significant spectral overlap [94] [93].
For optimization tasks, Bayesian algorithms have proven exceptionally effective. These algorithms intelligently balance the trade-off between exploration (testing new parameter spaces) and exploitation (refining known promising conditions) to efficiently navigate multidimensional experimental landscapes. This approach was successfully implemented in a self-optimizing flow reactor system, where it autonomously adjusted flow rates to maximize the yield of a Knoevenagel condensation reaction based on real-time NMR feedback [13].
Other ML approaches like Support Vector Machines (SVM), Principal Component Analysis (PCA), and Partial Least Squares (PLS) regression remain valuable tools for classifying spectral data, reducing dimensionality, and building multivariate regression models for predicting molecular properties [95].
Data Requirements and Challenges
The performance of AI/ML models in analytical chemistry is fundamentally governed by the principle of "garbage in, garbage out." High-quality, well-annotated training data with relevant metadata is essential for developing robust models [92] [96]. For NMR peak picking, training databases can be composed of either experimental spectra or synthetic spectra [93]. Experimental spectra provide real-world complexity but may contain gaps in representing all possible peak overlap scenarios. Synthetic spectra offer precisely known ground truth for all peak parameters (position, width, volume) and can be engineered to comprehensively cover complex overlap situations [93].
In mass spectrometry, the quality of AI-driven method development depends on existing data sources such as compound databases, empirical data, and in silico predictive models [92]. The emergence of large retention time datasets (e.g., METLIN's 80,000-compound Small Molecule RT dataset) has enabled the development of accurate Quantitative Structure-Retention Relationship (QSRR) models that can predict chromatographic behavior based on molecular structure [97].
Application Note: Autonomous Reaction Optimization with Inline NMR Monitoring
Experimental Objective and Setup
This application note demonstrates the autonomous optimization of a Knoevenagel condensation reaction between salicylic aldehyde and ethyl acetoacetate to form 3-acetyl coumarin, utilizing an integrated system of inline NMR monitoring, flow chemistry, and Bayesian optimization algorithms [13].
The experimental setup comprised three main components:
- A modular Ehrfeld microreactor system (MMRS) for conducting the continuous-flow reaction.
- A Magritek Spinsolve 80 ULTRA benchtop NMR spectrometer for real-time reaction monitoring.
- A HiTec Zang LabManager automation system with LabVision software for process control and optimization algorithm implementation [13].
Table 1: Research Reagent Solutions for Knoevenagel Condensation Optimization
| Component Name | Composition | Function in Experiment |
|---|---|---|
| Feed 1 Solution | 104.5 mL (1 mol) Salicylaldehyde, 9.88 mL (10 mol%) Piperidine, in 1 L Ethyl Acetate [13] | Provides aldehyde reactant and catalytic base dissolved in organic solvent. |
| Feed 2 Solution | 126.5 mL (1 mol) Ethyl Acetoacetate in 1 L Ethyl Acetate [13] | Provides β-ketoester reactant dissolved in organic solvent. |
| Dilution Solvent | 8.0 mL (125 mmol) Dichloromethane in 1 L Acetone [13] | Dilutes reactor output to prevent product precipitation before NMR flow cell. |
Autonomous Optimization Protocol
Step 1: System Initialization and Steady-State Determination
- The LabManager controls syringe pumps to set initial flow rates for Feed 1 and Feed 2 (total flow rate range: 0-1 mL/min for each), which determine both reactant stoichiometry and residence time [13].
- The reaction mixture is passed through a temperature-controlled capillary reactor and subsequently diluted with the dilution solvent at twice the combined flow rate of the feeds.
- The Spinsolve NMR spectrometer, operating in external control mode, is triggered by the LabManager to acquire quantitative NMR (qNMR) spectra at set intervals using a 1D EXTENDED+ protocol (4 scans, 6.55 s acquisition time, 15 s repetition time, 90-degree pulse) [13].
- Consecutive NMR measurements are taken until three successive spectra show no significant change in conversion and yield, indicating the system has reached a steady state [13].
Step 2: Real-Time Data Analysis and Yield Calculation
- The qNMR module automatically analyzes the spectra without operator supervision. Key spectral integrals used for calculations are [13]:
- Reference (R): Aromatic region (6.6 - 8.10 ppm), representing 4 protons constant throughout the reaction.
- Aldehyde Proton (S1): Salicylaldehyde signal (9.90 - 10.20 ppm).
- Olefinic Proton (S2): 3-Acetyl coumarin product signal (8.46 - 8.71 ppm).
- Conversion and Yield are calculated using the following equations:
- Conversion (%) = [1 - (S1/2R)] × 100%
- Yield (%) = (S2/R) × 100% [13]
- The calculated yield is automatically recorded and passed to the optimization algorithm in LabVision [13].
Step 3: Iterative Optimization via Bayesian Algorithm
- The Bayesian optimization algorithm uses the yield data to calculate new reaction parameters (flow rates of Feed 1 and Feed 2) for the subsequent experiment [13].
- The algorithm balances exploration (testing new parameter combinations to map the experimental space) and exploitation (refining conditions near the current best yield) [13].
- The new parameters are automatically implemented by the LabManager, which adjusts the syringe pumps, and the feedback loop repeats from Step 1 [13].
This autonomous cycle continues for a predefined number of iterations (e.g., 30) or until a convergence criterion is met.
Results and Performance
The system successfully conducted 30 autonomous optimization iterations, achieving a maximum yield of 59.9% for 3-acetyl coumarin [13]. The trajectory of the optimization process, shown in the figure below, illustrates the algorithm's strategic balance between exploration and exploitation. Initial iterations showed larger yield variations as the algorithm explored the parameter space, followed by periods of local refinement (exploitation) and further exploration to escape local optima [13].
Table 2: Key Experimental Results from Autonomous NMR-Optimized Flow Reactor
| Experiment Iteration | Key Observation | Maximum Yield Achieved |
|---|---|---|
| ~20-30 iterations | Algorithm demonstrates trade-off between exploration (large yield changes) and exploitation (small yield refinements) [13]. | 59.9% [13] |
| Post-optimization | Bayesian optimization efficiently navigated parameter space (flow rates affecting stoichiometry and residence time) [13]. | N/A |
Application Note: AI-Driven Method Development for LC-MS
Automated PRM Method Creation with Stellar Mass Spectrometer
AI-driven "automated intelligence" is transforming targeted quantitation workflows in mass spectrometry, particularly for verification-class experiments in translational research [92]. The Thermo Scientific Stellar mass spectrometer exemplifies this advancement, integrating AI to streamline method creation, data acquisition, and processing [92].
Protocol: Automated Parallel Reaction Monitoring (PRM) Method Generation
Data Input: The workflow begins with discovery-phase data acquired from Orbitrap-based MS systems or the Stellar MS itself. The software tool PRM Conductor within Skyline software uses this empirical data for automated method building [92].
Transition Filtering: Skyline metadata describing precursor-to-product transitions is filtered against user-defined thresholds. Filters are based on integrated peak area, relative area, signal-to-background, correlation to median transition, LC base peak width, and retention time. Precursors are retained if they have a minimum number of qualifying transitions (typically three for peptides, two for small molecules) [92].
Assay Feasibility Visualization: The software creates a visualization showing the concurrency of the assay—how long the instrument would take to acquire data for all precursors across the chromatographic run. The user can interactively adjust experimental parameters (e.g., linear ion trap scan rate, acquisition window width) to ensure the method is feasible given the desired number of data points per LC peak and the corresponding cycle time [92].
Method Generation: The user finalizes the assay, choosing to create either multiple assays for all qualifying precursors or a single assay with a "balanced load" that selects the best N peptides per protein. Instrument methods for the final assay are then exported based on a user-defined template method [92].
Intelligent Data Acquisition Management
The Stellar MS incorporates AI not only in method building but also in real-time data acquisition to maximize data quality and instrument efficiency [92].
- Dynamic Automated Gain Control (AGC): A hyper-fast ion gate manages ion accumulation to maintain a constant number of ions per spectrum, expanding the dynamic range of quantitation and ensuring high data quality regardless of ion flux [92].
- Adaptive Retention Time (Adaptive RT): This feature dynamically manages PRM acquisition during the run. It updates the method to adjust for unexpected LC perturbations (e.g., retention time shifts) and manages data acquisition across multi-channel UHPLC systems. This nearly eliminates the risk of missing data due to scheduling conflicts, maximizing target capacity and avoiding costly re-runs [92].
- Automated Collision Energy Optimization: The system uses Normalized Collision Energy (NCE), a well-established principle that automatically compensates for mass dependency by estimating optimal collision energies for all precursor-to-product ion transitions. This bypasses the need for lengthy, manual per-transition optimization required on triple quadrupole instruments, saving significant time and resources [92].
Implementation Guidelines and Future Perspectives
The Indispensable Role of Human Expertise
Despite the power of automation, human expertise remains critical in AI-driven analytical workflows. Experts are integral in two key areas: reasoning and data labeling [98]. AI systems must be built to allow humans to verify their reasoning and conclusions. Furthermore, the quality of the data fed to AI models is paramount; scientists play a crucial role in the collection, curation, and labeling of the high-quality data required to train and maintain these systems [98]. This human-in-the-loop model ensures that AI serves as a powerful tool for enhancing, rather than replacing, scientific judgment.
Emerging Trends: AI in Chromatography and Exposomics
The future of autonomous method development extends beyond reaction monitoring and targeted quantitation. In chromatography, automated sample preparation systems are now capable of performing dilution, filtration, solid-phase extraction, and derivatization, which can be integrated online with analytical separation to create seamless, hands-off workflows [99]. These systems are increasingly being paired with AI tools for analysis, reducing user-induced variability [99].
In the field of exposomics, which aims to comprehensively characterize all environmental exposures and their biological effects, AI is tackling the immense challenge of identifying unknown chemicals in complex biological samples [97]. Here, AI-enhanced retention time prediction models, particularly those using graph neural networks and transformer architectures, are being integrated into untargeted LC-HRMS workflows. These models use Quantitative Structure-Retention Relationship (QSRR) principles to predict a compound's chromatographic behavior based on its structure, providing an orthogonal parameter to mass spectrometry data that significantly improves annotation confidence and helps prioritize unknown features for identification [97]. This approach is vital for ambitious projects like the Human Exposome Project, which seeks to map environmental influences on human health with a scale and rigor similar to the Human Genome Project [97].
Tips for Robust Data Processing and Quality Control (QC)
The integration of Ultra-Performance Liquid Chromatography–Mass Spectrometry (UPLC-MS) and Nuclear Magnetic Resonance (NMR) has become a cornerstone for high-throughput, automated reaction monitoring in modern drug discovery [38] [36]. This paradigm is central to accelerating Design-Make-Test-Analyze (DMTA) cycles [38]. However, the volume and complexity of data generated demand robust, automated data processing and stringent Quality Control (QC) protocols. This article provides detailed application notes and protocols to ensure data integrity, reproducibility, and actionable insights from UPLC-MS and NMR-based automated workflows, framed within ongoing thesis research on autonomous analytical laboratories.
Foundational Protocols for Integrated Analysis
Protocol: Automated High-Throughput Purification (HTP) and QC Workflow
Objective: To purify and quality-check compound libraries from medicinal chemistry projects using integrated RP-HPLC-MS/SFC-MS and NMR. Methodology:
- Compound Submission & PreQC: Samples are submitted via a customized Laboratory Information Management System (LIMS) [38]. An automated PreQC analysis is performed using reversed-phase (RP) UPLC-MS or SFC-MS with generic gradients to assess crude sample composition [38].
- Method Transfer & Purification: Based on PreQC data, method parameters are transferred to preparative-scale RP-HPLC or SFC systems. Robotic platforms handle sample injection and fraction collection [38].
- Post-Purification QC (PostQC): All collected fractions undergo immediate UPLC-MS analysis for purity assessment. Data is processed using specialized software (e.g., Analytical Studio) for rapid peak identification and quantification [38].
- High-Throughput NMR (HT-NMR) QC: Purified compounds are analyzed via automated (^1)H NMR. In-house Python scripts automate data collection and analysis, confirming identity and quantifying residual solvents [38].
- Final Registration & Delivery: QC-passed compounds are redissolved in DMSO at a specified concentration, registered in the LIMS, and delivered as solutions ready for biological assays [38]. Key Data Processing Tip: Implement a unified LIMS to track samples across all stages—from submission to analytical screening, purification, and final QC—ensuring data lineage and consistency across global sites [38].
Protocol: Comparative Metabolome Mapping for QC and Classification
Objective: To employ a multi-platform metabolomics approach for robust classification and QC of natural products or reaction outcomes. Methodology:
- Sample Preparation: Extract samples (e.g., plant material or reaction aliquots) using standardized solvents. For volatile analysis, employ Solid-Phase Microextraction (SPME) [100].
- Multi-Instrumental Analysis:
- UPLC-MS: Perform untargeted profiling using a C18 column with a water-acetonitrile gradient (both acidified). Use high-resolution MS (e.g., Q-TOF) in positive and negative ionization modes [100].
- NMR: Prepare samples in deuterated solvents (e.g., DMSO-(d_6)). Acquire 1D (^1)H NMR spectra and 2D experiments (COSY, HSQC, HMBC) for structural elucidation [100].
- SPME-GC/MS: For volatile component QC, use a fiber-coated station and separate volatiles on a mid-polarity GC column coupled to MS [100].
- Data Processing & Multivariate Analysis:
- Process UPLC-MS data: perform peak picking, alignment, and deconvolution.
- Process NMR data: apply phase and baseline correction, reference chemical shifts, and bin data.
- Integrate datasets from all platforms and analyze using Principal Component Analysis (PCA) and Orthogonal Projections to Latent Structures-Discriminant Analysis (OPLS-DA) to identify discriminant markers and classify samples [100]. Key QC Tip: Using orthogonal techniques (MS and NMR) provides cross-validation of compound identity and purity, significantly reducing the chance of misidentification [100] [101].
Data Presentation: QC Thresholds and Metrics
Table 1: Key Quantitative QC Thresholds for Automated Reaction Monitoring
| QC Parameter | Analytical Technique | Target Threshold | Purpose & Rationale |
|---|---|---|---|
| Chromatographic Purity | UPLC-MS (DAD/CAD) | ≥ 95% [38] | Ensures isolated compound is suitable for biological testing and downstream analysis. |
| Mass Accuracy | HRMS (Q-TOF, Orbitrap) | ≤ 5 ppm | Confirms molecular formula and identity of the target compound and major impurities. |
| NMR Purity/Identity | (^1)H NMR | Consistent shift, integration, and J-couplings; residual solvents within limits. | Provides structural confirmation and detects impurities not visible by LC-MS (e.g., isomers, diastereomers) [38] [100]. |
| Signal-to-Noise Ratio (S/N) | NMR | ≥ 150:1 (for key peaks) | Ensures data quality sufficient for accurate integration and interpretation. |
| Process Efficiency | LIMS Tracking | Cycle time reduction in DMTA [38] | Measures the impact of automation and robust workflows on project acceleration. |
Table 2: Research Reagent Solutions for UPLC-MS/NMR Workflows
| Reagent/Material | Function | Application Note |
|---|---|---|
| Ammonium Formate / Formic Acid Buffers | Mobile phase modifiers for RP-UPLC-MS. | Provides consistent ionization in positive ESI mode and modulates selectivity [38]. |
| Ammonium Hydroxide Buffers | Mobile phase for high-pH RP-UPLC-MS. | Useful for analyzing basic compounds, offering orthogonal selectivity to acidic methods [38]. |
| Deuterated Solvents (DMSO-(d6), CD(3)OD) | NMR sample preparation. | Provides a locking signal for the spectrometer and minimizes interfering solvent peaks in the (^1)H spectrum [100]. |
| SPME Fibers (e.g., DVB/CAR/PDMS) | Extraction of volatile organic compounds (VOCs). | Enables headspace sampling for GC-MS-based QC of volatile reaction components or natural products [100]. |
| Lanthanide Shift Reagents (e.g., Eu(fod)(_3)) | NMR analysis. | Can be used to resolve overlapping signals or induce pseudo-contact shifts for advanced applications like 19F-NMR mapping [62]. |
| Silica-based & Chiral Stationary Phases | Columns for (S)FC. | Critical for method screening to achieve orthogonal separations for chiral and achiral compounds [38]. |
Visualization of Workflows and Relationships
Diagram 1: Automated HTP and QC Workflow for Compound Purification
Diagram 2: Multi-Platform Metabolomics Data Processing Pipeline
Managing Complex Matrices and Overcoming Ion Suppression in LC-MS
Ion suppression represents a significant challenge in liquid chromatography-mass spectrometry (LC-MS) and ultra-performance liquid chromatography-mass spectrometry (UPLC-MS), particularly when analyzing complex biological matrices in automated reaction monitoring and drug development. This phenomenon occurs when co-eluting matrix components interfere with the ionization efficiency of target analytes, leading to reduced signal intensity and compromised quantification accuracy [102] [103]. In pharmaceutical research and metabolomic studies, where precise quantification is paramount, ion suppression can adversely affect detection capability, precision, accuracy, and reproducibility, potentially resulting in both false negatives and false positives [102] [104].
The mechanisms underlying ion suppression differ between the two primary atmospheric-pressure ionization (API) techniques. In electrospray ionization (ESI), ionization occurs in the liquid phase, and suppression often results from competition for limited charge or space on the surface of ESI droplets, particularly when analyte concentrations exceed approximately 10⁻⁵ M [102]. Compounds with high surface activity or basicity may outcompete target analytes, while increased viscosity from interfering compounds can reduce solvent evaporation rates [102]. In contrast, atmospheric-pressure chemical ionization (APCI) typically experiences less ion suppression because vaporized neutral analytes are ionized in the gas phase, where competition effects are reduced [102]. Understanding these fundamental mechanisms is crucial for developing effective strategies to overcome matrix effects in bioanalytical applications.
Detection and Assessment of Ion Suppression
Experimental Protocols for Ion Suppression Evaluation
Post-Column Infusion Method: This qualitative approach identifies chromatographic regions susceptible to ion suppression or enhancement [102] [104]. The experimental setup involves connecting a syringe pump containing a standard solution of the analyte (typically 10-100 nM) to a T-piece between the LC column outlet and the MS interface. A blank sample extract is injected into the LC system while the analyte solution is continuously infused post-column at a constant flow rate (typically 5-20 μL/min). The resulting chromatogram reveals regions of ion suppression as dips in the baseline or areas where the constant analyte signal decreases due to co-eluting matrix components [102]. This method provides a visual map of suppression zones throughout the chromatographic run but does not yield quantitative data [104].
Post-Extraction Spike Method: This quantitative approach compares the MS response of an analyte in a pure standard solution to its response when spiked into a blank matrix extract after the sample preparation process [104]. Prepare a calibration standard in neat solvent at a concentration within the analytical range. Process a blank matrix sample through the entire sample preparation procedure, then spike the same concentration of analyte into the prepared extract. Analyze both solutions by LC-MS and calculate the matrix effect (ME) using the formula: ME (%) = (B/A) × 100, where A is the peak area of the standard solution and B is the peak area of the post-extraction spiked sample [102] [104]. Values significantly less than 100% indicate ion suppression, while values greater than 100% indicate ion enhancement.
Slope Ratio Analysis: This semi-quantitative method evaluates matrix effects across a concentration range rather than at a single level [104]. Prepare matrix-matched calibration standards by spiking analytes at multiple concentrations (typically 5-8 levels) into a blank matrix and processing through the entire sample preparation procedure. Prepare solvent-based calibration standards at identical concentrations. Analyze both sets and plot peak areas versus concentration. Calculate the slope ratio (matrix-matched calibration slope/solvent calibration slope). A ratio significantly different from 1.0 indicates substantial matrix effects, with values <1 suggesting suppression and values >1 indicating enhancement [104].
Table 1: Comparison of Ion Suppression Assessment Methods
| Method | Type of Data | Key Information Provided | Limitations | Implementation Complexity |
|---|---|---|---|---|
| Post-Column Infusion | Qualitative | Identifies suppression zones in chromatogram | Does not provide quantitative ME values; laborious for multiresidue analysis | Moderate |
| Post-Extraction Spike | Quantitative | Provides precise ME percentage at specific concentration(s) | Requires blank matrix; single concentration assessment | Low |
| Slope Ratio Analysis | Semi-quantitative | Evaluates ME across concentration range | Requires blank matrix; does not provide precise ME values | Moderate |
Visualization of Ion Suppression Assessment Workflow
The following diagram illustrates the logical relationship between the different experimental approaches for assessing ion suppression in LC-MS:
Strategies to Overcome Ion Suppression
Sample Preparation Optimization
Effective sample preparation is the first line of defense against ion suppression. Protein precipitation with organic solvents (acetonitrile, methanol) effectively removes proteins but may leave phospholipids that cause suppression [103]. Solid-phase extraction (SPE) provides superior clean-up by selectively retaining analytes while removing interfering compounds; reversed-phase, mixed-mode, and selective sorbents can be tailored to specific analyte classes [103]. Recent advances in molecularly imprinted polymers (MIPs) offer highly selective extraction capabilities, though commercial availability remains limited [104]. For high-throughput applications, dilution-and-shoot approaches may be effective when sensitivity requirements permit, as dilution reduces the concentration of interfering compounds [104].
Chromatographic Separation Enhancement
Chromatographic optimization represents one of the most powerful approaches for mitigating ion suppression. Extending chromatographic run times improves separation of analytes from matrix components, while gradient optimization can shift analyte retention away from suppression zones identified by post-column infusion [102] [103]. Microflow LC-MS/MS setups have demonstrated up to sixfold sensitivity improvements by optimizing chromatographic flow rates and enhancing ionization efficiency [103]. Selecting appropriate stationary phases (e.g., polar-embedded, HILIC, or specialized reversed-phase columns) can alter selectivity to separate analytes from isobaric interferences. Scheduling multiple reaction monitoring (MRM) transitions to specific retention time windows increases dwell times and improves signal-to-noise ratios [105].
Mass Spectrometric and Ion Source Strategies
Instrumental parameter optimization can significantly reduce ion suppression effects. Switching ionization modes from ESI to APCI often reduces suppression because APCI is less susceptible to liquid-phase competition effects [102]. Source parameter optimization (gas flows, desolvation temperature, capillary voltage) tuned for specific analyte classes improves ionization efficiency [103]. Employing hybrid surface technologies and inert materials in the LC flow path minimizes analyte loss and improves signal stability [103]. Using a divert valve to switch eluent to waste during early and late chromatographic regions prevents non-volatile materials from entering the ion source [104]. High-resolution mass spectrometry (HRMS) provides superior selectivity through accurate mass measurement, reducing chemical background interference [49].
Table 2: Comprehensive Strategies for Overcoming Ion Suppression
| Strategy Category | Specific Techniques | Mechanism of Action | Application Context |
|---|---|---|---|
| Sample Preparation | Solid-phase extraction (SPE), Protein precipitation, Phospholipid removal plates | Removes interfering compounds from sample matrix | Essential for complex matrices like plasma, tissue homogenates |
| Chromatographic | Gradient optimization, Microflow LC, HILIC chromatography, Extended run times | Separates analytes from matrix interference components | Critical when isobaric interferences co-elute with analytes |
| Ion Source | Ionization mode switching (ESI to APCI), Source parameter optimization, Divert valve implementation | Improves ionization efficiency and reduces source contamination | Effective when sample clean-up is insufficient |
| Mass Analyzer | High-resolution MS, MRM optimization, Sum of MRM (SMRM) | Enhances selectivity and signal-to-noise ratio | Beneficial for trace analysis in complex backgrounds |
| Calibration | Isotope-labeled internal standards, Matrix-matched calibration, Standard addition | Compensates for residual matrix effects | Necessary when elimination of ME is incomplete |
Internal Standardization and Calibration Approaches
Effective calibration strategies compensate for residual ion suppression that cannot be eliminated through sample preparation or chromatography. Stable isotope-labeled internal standards (SIL-IS) represent the gold standard because they exhibit nearly identical chemical properties and retention times as their corresponding analytes, experiencing similar matrix effects [104]. Matrix-matched calibration prepares standards in blank matrix to mimic the sample environment, though obtaining truly blank matrix can be challenging for endogenous compounds [104]. For situations where blank matrix is unavailable, surrogate matrices (e.g., bovine serum albumin solution for plasma, artificial urine) or standard addition methods can be employed, though each has limitations in accuracy and precision [104].
Application in UPLC-MS for Automated Reaction Monitoring
In the context of UPLC-MS for automated reaction monitoring, managing ion suppression is crucial for obtaining accurate kinetic data and reaction endpoints. The high throughput requirements of reaction monitoring necessitate robust, reproducible methods that maintain sensitivity across numerous samples. UPLC-MS/MS with multiple reaction monitoring (MRM) has been successfully applied for high-throughput quantitation of complex mixtures, with analysis times as short as 15 minutes for 23 analytes while maintaining good sensitivity, recovery, and reproducibility [105].
Comparative studies between UPLC-HRMS and direct infusion-nanoelectrospray HRMS (DI-nESI-HRMS) for metabolic profiling demonstrate that although DI-nESI-HRMS offers significantly faster analysis (9 hours versus 5 days for 132 samples), UPLC-HRMS provides superior separation and identification capabilities, particularly for isomeric compounds [49]. This highlights the importance of chromatographic separation in managing matrix effects, especially when isobaric interferences are present.
For automated reaction monitoring systems, implementing regular system suitability tests with quality control samples containing target analytes at low, medium, and high concentrations ensures continuous system performance verification. Internal standard tracking throughout analytical batches monitors for retention time shifts or signal suppression that might indicate system contamination or performance degradation [103].
The Scientist's Toolkit: Essential Research Reagent Solutions
Table 3: Key Research Reagent Solutions for Managing Matrix Effects
| Reagent/ Material | Function | Application Notes | References |
|---|---|---|---|
| Stable Isotope-Labeled Internal Standards | Compensates for matrix effects; normalizes extraction efficiency | Ideally (^{13}\mathrm{C}), (^{15}\mathrm{N})-labeled; should be added before sample preparation | [104] |
| Phospholipid Removal Plates | Selectively removes phospholipids from biological samples | Reduces major source of ion suppression in plasma/serum analysis | [103] |
| Mixed-mode SPE Sorbents | Combines reversed-phase and ion-exchange mechanisms | Effective for diverse analyte polarities; superior clean-up | [103] |
| Molecularly Imprinted Polymers | Highly selective extraction based on molecular recognition | Limited commercial availability; promising for specific analyte classes | [104] |
| Volatile Buffers (ammonium formate/acetate) | MS-compatible mobile phase additives | Enhances spray stability; avoids source contamination | [103] |
Effective management of complex matrices and ion suppression is fundamental to obtaining reliable LC-MS data in pharmaceutical research, metabolomics, and automated reaction monitoring. A systematic approach combining appropriate sample preparation, chromatographic optimization, instrumental parameter tuning, and effective internal standardization provides the most robust solution. The strategies outlined in this application note enable researchers to develop methods with enhanced sensitivity, reproducibility, and accuracy, supporting confident scientific and regulatory decisions in drug development and reaction monitoring applications.
For UPLC-MS systems dedicated to automated reaction monitoring, implementing continuous quality control measures and regular system maintenance ensures long-term robustness in bioanalysis. As LC-MS technology continues to evolve, emerging approaches such as microflow LC, advanced stationary phases, and selective sample preparation techniques will further enhance our ability to overcome the challenges posed by complex matrices.
Strategies for High-Throughput Experimentation and Resource Efficiency
The increasing demand for faster and more efficient research outcomes in drug discovery and development has made high-throughput experimentation (HTE) and resource efficiency critical components of the modern laboratory. Automation and smart workflows are transforming analytical operations across sample preparation, analysis, and data processing, enabling unprecedented throughput and reproducibility [36]. These strategies are particularly vital within the context of automated reaction monitoring using Ultra Performance Liquid Chromatography–Tandem Mass Spectrometry (UPLC-MS) and Nuclear Magnetic Resonance (NMR) spectroscopy, where they significantly accelerate research timelines while reducing operational costs and resource consumption.
This document outlines detailed application notes and protocols for implementing these strategies, specifically framed within advanced UPLC-MS and NMR methodologies. The global laboratory automation market, valued at $5.2 billion in 2022, is projected to grow to $8.4 billion by 2027, driven by sectors including pharmaceuticals, biotech, and environmental monitoring [36]. This growth underscores the strategic importance of the protocols discussed herein for researchers, scientists, and drug development professionals aiming to enhance their operational efficiency and analytical capabilities.
The push toward high-throughput and resource-efficient workflows is driven by several convergent needs. Higher throughput demands in drug discovery and environmental monitoring require methods that can process hundreds of samples reliably and rapidly. The need for improved data accuracy and reproducibility is met by automated systems that minimize human error. Furthermore, growing sustainability concerns are pushing laboratories to adopt greener analytical principles that reduce solvent consumption and hazardous waste [106] [36].
Strategic implementation focuses on two primary areas: the integration of automation and the development of synergistic techniques. Automation spans from robotic liquid handling and automated sample preparation to sophisticated software for data acquisition and analysis [36] [107]. Synergistic techniques involve coupling complementary technologies like UPLC-MS and NMR to create workflows that are greater than the sum of their parts, such as using NMR for direct, non-destructive mixture analysis to guide subsequent targeted UPLC-MS quantification [108].
Table 1: Quantitative Benefits of Automated High-Throughput Workflows
| Metric | Conventional Method | Automated High-Throughput Method | Improvement/Reference |
|---|---|---|---|
| Sample Preparation Time | Extensive, often 24 hours for Soxhlet extraction [106] | Drastically reduced via robotic SPE (e.g., Biomek i7 Workstation) [106] | >50% reduction |
| Solvent Consumption | 100–350 mL per sample [106] | Significantly lower volumes via miniaturization | >70% reduction [106] |
| Sample Throughput | Low, limited by manual steps | High, enabled by batch processing and automation [107] | Multi-fold increase |
| Data Acquisition & Optimization | Manual, iterative, time-consuming | Autonomous, using AI/ML and Bayesian optimization [36] [13] | Rapid, autonomous optimization |
| Analytical Greenness (Complex GAPI) | Poor score [106] | Improved score [106] | Enhanced sustainability |
Application Note: A High-Throughput, Green Workflow for UPLC-MS/MS Analysis
Background and Objective
Conventional methods for analyzing complex mixtures, such as steroids and hormones (SHs) in wastewater, are often exhaustive, complex, and score poorly on sustainability metrics [106]. This application note details the development of a high-throughput, green robotic SPE-UPLC-MS/MS workflow for the simultaneous monitoring of 27 steroids and hormones, demonstrating a strategy that balances efficiency, accuracy, and environmental responsibility.
Experimental Protocol
Materials and Instrumentation
- Automated Workstation: Biomek i7 modular robotic workstation for solid-phase extraction (SPE) [106].
- Chromatography System: Ultra Performance Liquid Chromatography (UPLC) system.
- Mass Spectrometer: Tandem mass spectrometer (MS/MS) with electrospray ionization (ESI) source.
- SPE Cartridges: Hydrophilic-Lipophilic Balance (HLB), Mixed-Mode Cation Exchange (MCX), and Mixed-Mode Anion Exchange (MAX) cartridges. Optimization results indicated the order of suitability was HLB > MCX > MAX [106].
- Solvents: HPLC-grade methanol, acetonitrile, and water.
Detailed Procedure
Sample Preparation:
- Automated SPE: Load samples onto the Biomek i7 workstation.
- Conditioning: Condition the selected HLB SPE cartridges with methanol followed by water.
- Loading: Load the wastewater samples onto the conditioned cartridges.
- Washing: Wash with a water-methanol mixture to remove interfering matrix components.
- Elution: Elute the target analytes using a suitable organic solvent (e.g., methanol).
- Concentration: Gently evaporate the eluate under a stream of nitrogen and reconstitute in the initial mobile phase for UPLC-MS/MS analysis.
UPLC-MS/MS Analysis:
- Column: Use a suitable reverse-phase UPLC column (e.g., C18).
- Mobile Phase: (A) Water with 0.1% formic acid and (B) Acetonitrile with 0.1% formic acid.
- Gradient: Employ an optimized gradient elution, for example:
- 0-1 min: 5% B
- 1-10 min: 5-95% B
- 10-12 min: 95% B
- 12-12.1 min: 95-5% B
- 12.1-15 min: 5% B (re-equilibration)
- Flow Rate: 0.3 - 0.4 mL/min.
- Column Temperature: 40 °C.
- Injection Volume: 5-10 µL.
- MS Detection: Operate the mass spectrometer in selected reaction monitoring (SRM) mode. Optimize MS parameters for each of the 27 steroids and hormones.
Data Analysis:
- Use the instrument's software to integrate chromatographic peaks.
- Quantify analytes using an 8-point calibration curve with acceptable linearity [106].
Diagram 1: UPLC-MS/MS automated analysis workflow.
Key Results and Performance
The developed method demonstrated excellent performance, meeting validation criteria for specificity, linearity, precision, and accuracy [106]. The automated approach showed significant advantages over conventional methods in both greenness and practicality assessments.
Table 2: Method Validation Data for the Automated SPE-UPLC-MS/MS Workflow
| Validation Parameter | Result | Acceptance Criteria |
|---|---|---|
| Specificity | No significant interference for 26/27 SHs; Cholesterol interference was 17.71% of LOQ | Interference < 20% of LOQ [106] |
| Matrix Effect | Within ±20% for 26/27 SHs | Tolerance of ±20% [106] |
| Calibration Linearity | Acceptable linearity across 8-point range | R² > 0.99 |
| Precision (% RSD) | Within 20% at LQC, MQC, HQC levels (n=6) | % RSD ≤ 20% [106] |
| Accuracy (Recovery %) | 71.54% to 115.00% | Typically 70-120% [106] |
| Greenness (Complex GAPI) | Improved score vs. conventional | N/A [106] |
| Practicality (BAGI) | Improved score vs. conventional | N/A [106] |
Application Note: Automated Reaction Optimization with Inline NMR Monitoring
Background and Objective
The integration of real-time analytics with intelligent process control enables self-optimizing reactor systems, which are capable of autonomously exploring reaction conditions to maximize performance [13]. This application note describes a protocol for a fully automated flow reactor system that uses inline benchtop NMR monitoring coupled with a Bayesian optimization algorithm to optimize a chemical reaction without human intervention.
Experimental Protocol
Materials and Instrumentation
- NMR Spectrometer: Magritek Spinsolve 80 ULTRA benchtop NMR spectrometer [13].
- Automation and Control System: HiTec Zang LabManager and LabVision software [13].
- Flow Reactor System: Ehrfeld Micro Reaction System (MMRS) with syringe pumps (e.g., SyrDos) and micromixers [13].
- Reagents: Salicylaldehyde, Ethyl acetoacetate, Piperidine (catalyst), Ethyl acetate, Acetone.
- Software: System configured for Bayesian optimization algorithm.
Detailed Procedure
System Setup:
- Configure the flow reactor system as illustrated in the flow chart. Feed lines for the reactants (dissolved in ethyl acetate) are combined in a micromixer and transferred into a capillary reactor.
- Integrate the Spinsolve NMR spectrometer into the flow path after the reactor. A dilution line is added post-reactor to prevent product precipitation before NMR analysis.
- Connect the entire setup (pumps, reactor, NMR) to the LabManager automation system.
Reaction Optimization Workflow:
- Parameter Initialization: The Bayesian algorithm sets initial flow rates for the reactant feeds, which control the reactant ratio and residence time.
- Reaction and Monitoring: The reaction mixture flows through the reactor and is directed into the NMR flow cell for analysis.
- Automated qNMR Analysis: The LabManager triggers the Spinsolve to run a pre-configured quantitative NMR (qNMR) method. A 1D EXTENDED+ protocol with 4 scans is typical.
- Yield Calculation: The software automatically calculates conversion and yield using defined integrals (e.g., aromatic protons as a reference, aldehyde proton from starting material, and a product-specific proton).
- Feedback Loop: The calculated yield is fed back to the optimization algorithm. The algorithm then suggests the next set of reaction parameters (flow rates) to improve the yield.
- Iteration: This process repeats automatically until a maximum yield is achieved or a set number of iterations are completed.
Diagram 2: Self-optimizing reactor feedback loop.
Key Results and Performance
The system successfully optimized a Knoevenagel condensation reaction, achieving a final yield of 59.9% over 30 autonomous iterations [13]. The Bayesian algorithm effectively balanced exploration of the parameter space and exploitation of promising regions, as shown by the fluctuation and upward trend in yield over successive experiments. This setup demonstrates a robust and generalizable strategy for rapid reaction optimization with minimal human intervention and resource consumption.
The Scientist's Toolkit: Essential Research Reagent Solutions
The successful implementation of the protocols above relies on a set of key reagents, materials, and software. The following table details these essential components and their functions.
Table 3: Key Research Reagent Solutions for High-Throughput UPLC-MS and NMR
| Item | Function/Application | Example/Note |
|---|---|---|
| Hydrophilic-Lipophilic Balance (HLB) SPE Cartridges | Extraction and clean-up of a wide range of analytes from aqueous samples. | Demonstrated superior extraction efficiency for 27 steroids and hormones in wastewater vs. MCX and MAX [106]. |
| UPLC-MS/MS Grade Solvents | Serve as the mobile phase for chromatographic separation and ionization medium in the MS. | Low UV-absorbance acetonitrile/methanol and high-purity water with 0.1% formic acid are standard. |
| Bayesian Optimization Software | An AI algorithm that autonomously directs experiments toward optimal conditions by balancing exploration and exploitation. | Used to maximize chemical reaction yield in a self-optimizing flow reactor [13]. |
| Quantitative NMR (qNMR) Module | Software tool for the automated, direct quantification of compounds in a mixture without the need for pure standards. | Enabled real-time yield calculation in the automated reaction optimization platform [13]. |
| Automated Liquid Handling Workstation | Performs repetitive sample preparation tasks (like SPE) with high precision and throughput, reducing manual labor and error. | The Biomek i7 workstation was central to the high-throughput green robotic SPE protocol [106]. |
| Benchtop NMR Spectrometer | Provides real-time, non-destructive analysis of reaction mixtures; its compact size allows for easy integration into automated flow systems. | The Magritek Spinsolve Ultra was used for inline monitoring in a fume hood [13]. |
Technique Comparison and Workflow Validation: Ensuring Data Integrity
For researchers in drug development and automated reaction monitoring, selecting the appropriate analytical technique is crucial for efficient and accurate results. This application note provides a direct comparison of Nuclear Magnetic Resonance (NMR) spectroscopy and Mass Spectrometry (MS) within the context of automated reaction monitoring research, focusing on the critical parameters of sensitivity, reproducibility, and metabolite coverage. The integration of these techniques, particularly Ultra-Performance Liquid Chromatography-MS (UPLC-MS) and benchtop NMR, into automated workflows is transforming modern laboratories by enabling real-time, data-driven decision-making [45] [25]. We present standardized protocols and a clear comparative analysis to guide scientists in selecting and implementing the optimal analytical strategy for their specific research challenges.
Comparative Analysis: NMR vs. MS
The choice between NMR and MS involves significant trade-offs. The table below summarizes the key analytical differences between the two techniques, providing a foundation for decision-making.
Table 1: Key Analytical Differences Between NMR and MS
| Parameter | Nuclear Magnetic Resonance (NMR) | Mass Spectrometry (MS) |
|---|---|---|
| Sensitivity | Low [109] | High [109] |
| Reproducibility | Very High [109] | Average [109] |
| Detectable Metabolites | 30 - 100 [109] | 300 - 1000+ [109] |
| Quantitative Nature | Excellent; absolute quantitation possible with a single standard [110] | Requires isotope-labeled standards for absolute quantitation [110] |
| Sample Preparation | Minimal; tissues can be analysed directly [109] | Complex; requires tissue extraction and often pre-fractionation [109] [111] |
| Analysis Time | Fast; entire sample analysed in one measurement [109] | Longer; requires chromatography separation [109] |
| Key Strength | Excellent for structure elucidation, non-destructive, ideal for reaction kinetics [112] [45] | Superior for detecting low-abundance species, high multiplexing capability [111] [113] |
Experimental Protocols
Protocol for Automated Reaction Monitoring via Benchtop NMR
This protocol is adapted for integration with automated flow chemistry systems, such as those using the Spinsolve benchtop NMR spectrometer [45].
- System Setup and Calibration: Install the benchtop NMR spectrometer (e.g., Magritek Spinsolve, Bruker Fourier Rxn Lite) in close proximity to or integrated with the flow reactor within a fume hood [45] [25]. Connect the reactor outlet to the NMR flow cell using PTFE or PFA tubing. Calibrate the magnetic field following the manufacturer's instructions.
- Reaction Initiation and Flow Configuration: Start the chemical reaction within the reactor. Initiate the peristaltic or HPLC pump to circulate the reaction mixture through the NMR flow cell at a constant flow rate. A typical flow rate ranges from 0.5 to 2 mL/min, which can be optimized to balance temporal resolution and signal-to-noise ratio.
- Data Acquisition with Real-Time Monitoring: Configure the NMR software for kinetic series acquisition. Set the following parameters for each time-point spectrum:
- Pulse Sequence: 1D NOESY or 1D proton experiment with water suppression [112].
- Scans: 4-16 scans (depending on required signal-to-noise) [45].
- Relaxation Delay: 1-5 seconds [45].
- Total Experiment Time per Spectrum: 30 seconds to 5 minutes.
- Program the software to acquire spectra sequentially at regular intervals (e.g., every 2 minutes) for the duration of the reaction.
- Data Processing and Quantitative Analysis: Process the acquired Free Induction Decays (FIDs) by applying Fourier transformation, phase correction, and baseline correction. For quantitative analysis, integrate resolved peaks corresponding to reactants and products in each spectrum. The absolute concentration can be determined by referencing the integral of a product peak to the integral of an internal standard of known concentration or by using the initial concentration of a reactant that is being consumed [110]. Plot the integral values versus time to generate reaction kinetic curves.
The workflow for this automated NMR process is as follows:
Protocol for Targeted Metabolite Quantification using LC-SRM/MS
This protocol is designed for the sensitive and specific quantification of target metabolites or reaction products, utilizing Selected Reaction Monitoring (SRM) also known as Multiple Reaction Monitoring (MRM) [111] [114].
Sample Preparation and Extraction:
- If analyzing complex matrices like blood plasma, perform immunoaffinity depletion of high-abundance proteins or fractionation to enhance sensitivity for low-abundance targets [111].
- Precipitate proteins by adding cold methanol (1:2 sample:methanol ratio) to the sample, vortex, and incubate at -20°C for 20 minutes [115].
- Centrifuge at 13,400 g for 30 minutes to pellet debris.
- Transfer the supernatant to a fresh vial and dry using a vacuum concentrator.
- Reconstitute the dried extract in a solvent compatible with the LC mobile phase (e.g., water or 2% acetonitrile with 0.1% formic acid).
Liquid Chromatography (LC):
- Inject the reconstituted sample onto the UPLC system.
- Use a reversed-phase C18 column (e.g., 2.1 x 100 mm, 1.7 µm) for separation.
- Employ a binary gradient with a flow rate of 0.3-0.4 mL/min. A typical gradient runs from 2% to 95% organic solvent (acetonitrile or methanol) with 0.1% formic acid over 10-20 minutes.
Mass Spectrometry - SRM/MRM Acquisition:
- Utilize a triple quadrupole mass spectrometer.
- For each target metabolite, define its precursor ion (Q1) and at least two characteristic product ions (Q3) to create SRM transitions [114].
- Incorporate stable isotope-labeled internal standards (SID) for each target analyte to correct for ionization suppression and variability [114] [110].
- Optimize collision energies for each transition for maximum sensitivity.
- Operate the mass spectrometer in positive or negative electrospray ionization (ESI) mode, with source parameters tuned for optimal ion transmission.
Data Analysis and Quantification:
- Process the SRM data using instrument software (e.g., Skyline).
- Integrate the peak areas for each transition of the analyte and its corresponding internal standard.
- Calculate the peak area ratio (analyte / internal standard).
- Generate a calibration curve using known concentrations of analyte spiked into a representative matrix. The concentration of the analyte in the unknown sample is determined by interpolating its peak area ratio from this calibration curve.
The workflow for this LC-SRM/MS process is as follows:
The Scientist's Toolkit: Essential Research Reagents and Materials
Successful implementation of the above protocols requires specific reagents and materials. The following table lists key solutions for setting up these experiments.
Table 2: Key Research Reagent Solutions for NMR and MS Experiments
| Item | Function/Application | Example & Notes |
|---|---|---|
| Deuterated Solvents | Provides a field-frequency lock for NMR spectrometers; allows for solvent signal suppression. | Deuterium Oxide (D₂O), Acetonitrile-d³, Chloroform-d. Essential for high-resolution NMR [112]. |
| Chemical Shift Reference | Internal standard for chemical shift calibration and absolute quantitation in NMR. | TSP (trimethylsilylpropionic acid) or DSS (4,4-dimethyl-4-silapentane-1-sulfonic acid) for pre-processed samples [110]. |
| Stable Isotope-Labeled Internal Standards (SID) | Enables absolute quantitation in MS by correcting for ion suppression and sample loss. | ¹³C/¹⁵N-labeled peptide or metabolite analogues. Critical for accurate SRM/MRM assays [114] [110]. |
| Volatile LC Buffers | Compatible with ESI-MS; prevent ion source contamination and signal suppression. | Ammonium acetate, ammonium formate, acetic acid, formic acid. Required for LC-MS mobile phases [113]. |
| NMR Flow Cell Kit | Enables online reaction monitoring by flowing the reaction mixture through the NMR detector. | Magritek's PTFE tubing kit or glass flow cell with 4 mm ID [45]. |
| Protein Precipitation Solvents | Removes proteins from complex biological samples prior to MS or NMR analysis. | Cold Methanol, Acetonitrile. A 1:2 sample-to-solvent ratio is commonly used [115]. |
NMR and MS are powerful yet distinct techniques that serve complementary roles in automated reaction monitoring and metabolomics. NMR excels in providing highly reproducible, non-destructive, and quantitative data with minimal sample preparation, making it ideal for monitoring reaction kinetics and identifying structures in real-time [45] [110]. In contrast, MS offers superior sensitivity and a broader coverage of metabolites, which is indispensable for targeted quantification of low-abundance species, albeit with more complex sample preparation and a need for specific standards for absolute quantitation [109] [111] [113]. The emerging trend of integrating benchtop NMR directly into automated flow reactor systems [25], combined with the high-throughput capabilities of UPLC-SRM/MS, provides a powerful dual approach for accelerating research and development in pharmaceutical and chemical sciences.
Statistical Heterospectroscopy (SHY) is a powerful statistical paradigm for the co-analysis of multi-spectroscopic data sets acquired on multiple samples. This innovative approach operates by analyzing the intrinsic covariance between signal intensities from the same and related molecules measured by different analytical techniques across sample cohorts. The primary strength of SHY lies in its ability to perform direct cross-correlation of spectral parameters from different platforms, such as chemical shifts from Nuclear Magnetic Resonance (NMR) and m/z data from Mass Spectrometry (MS), leading to significantly improved efficiency in molecular biomarker identification [116] [117].
Originally developed for metabonomic toxicology studies, the SHY approach has demonstrated substantial value in systems biology as a robust tool for biomarker recovery [116]. While its initial application involved analyzing 600-MHz ¹H NMR and UPLC-TOFMS data from control and hydrazine-treated rat urine samples, the methodology has proven to be generally applicable to complex mixture analysis wherever two or more independent spectroscopic data sets are available for any sample cohort [116]. The technique enables researchers to extract not only structural information but also higher-level biological insights into metabolic pathway activity and connectivities by examining different levels of correlation and anti-correlation matrices between NMR and MS data [117].
The integration of SHY within modern automated reaction monitoring platforms represents a significant advancement for pharmaceutical research and development. By providing a statistical framework for data fusion, SHY bridges the complementary strengths of NMR and UPLC-MS, allowing researchers to overcome the inherent limitations of each individual technique while capitalizing on their combined strengths for more comprehensive reaction understanding and optimization [118] [59].
Theoretical Foundation and Principles
Core Mathematical Framework
The SHY methodology is built upon the analysis of covariance matrices that capture the relationships between spectroscopic variables across multiple analytical platforms. The fundamental mathematical operation involves calculating the covariance between signal intensities in the same and related molecules measured by different techniques across a cohort of samples [116]. This covariance structure enables the direct cross-correlation of spectral parameters, specifically chemical shifts from NMR and m/z data from MS, creating a powerful statistical bridge between the two analytical domains.
The SHY algorithm generates correlation matrices that reveal both positive and negative relationships between NMR and MS features, with these correlations occurring at different levels of significance [117]. The implementation typically employs a strict confidence level cutoff (such as 99.9%) for rejecting spurious correlations, ensuring reliable data interpretation in the context of physiological responses or reaction pathways [117]. This rigorous statistical foundation allows researchers to move beyond simple visual comparison of spectra to a quantitative assessment of relationships between molecular features detected across platforms.
Complementarity of NMR and UPLC-MS Data
The power of SHY stems from the fundamental complementarity between NMR and UPLC-MS, two techniques with orthogonal strengths and weaknesses as summarized in Table 1.
Table 1: Complementary Characteristics of NMR and MS in Metabolomics and Reaction Monitoring
| Characteristic | NMR | UPLC-MS |
|---|---|---|
| Quantitation | Highly quantitative with single internal reference; excellent reproducibility [119] | Requires multiple standards for absolute quantitation; less reproducible [119] |
| Sensitivity | Limited sensitivity (LOD ~1 μM) [119] | Highly sensitive [119] |
| Structural Information | Powerful for unknown structure determination; atomic connectivity [119] | Accurate mass for empirical formula; tandem MS for fragmentation patterns [119] |
| Sample Requirements | Non-destructive; minimal preparation; analyzes intact specimens [119] | Often requires separation; destructive to samples [119] |
| Throughput | Suitable for high-throughput measurements [119] | Enables high-throughput measurements [119] |
| Metabolite Coverage | 20-60 metabolites typically detected in biological samples [119] | Hundreds to thousands of metabolites detectable [119] |
This complementarity creates an ideal environment for SHY implementation, as the technique leverages the quantitative robustness of NMR with the sensitivity and coverage of UPLC-MS to provide a more complete picture of complex reaction mixtures or biological samples [119]. The combination of atomic connectivity information from NMR with accurate mass measurements from MS creates a powerful framework for unambiguous compound identification, particularly for unknown metabolites or reaction intermediates [118].
SHY Experimental Design and Workflow
Sample Preparation and Experimental Considerations
Proper experimental design is crucial for successful SHY implementation. The methodology requires the analysis of the same set of samples by both NMR and UPLC-MS platforms, emphasizing the importance of sample integrity and consistency across measurements [118]. For automated reaction monitoring applications, this typically involves collecting time-point samples throughout the reaction progression that are subsequently analyzed by both techniques.
Sample preparation must balance the requirements of both analytical platforms. For NMR analysis, this often involves using deuterated solvents to provide a lock signal, while UPLC-MS compatibility must be considered for solvent selection and additive compatibility [2]. Recent advances in automated platforms have enabled more streamlined sample handling, with integrated workflows that facilitate parallel preparation of samples for both NMR and MS analysis from the same source material [25] [2]. For quantitative applications, particularly in blood-based metabolomics, protein precipitation using organic solvents like methanol or acetonitrile has shown superior performance for metabolite recovery compared to ultrafiltration methods [119].
Data Acquisition Parameters
Optimal data acquisition parameters for SHY depend on the specific application and instrumentation available. For NMR, standard ¹H NMR experiments at 600 MHz or higher provide sufficient resolution for most metabolomic applications, with careful attention to water suppression and relaxation delays for quantitative accuracy [116] [119]. For UPLC-MS, high-resolution mass analyzers (TOF or Orbitrap) are preferred to provide accurate mass measurements for elemental composition determination, with UPLC separation optimized to maximize metabolite separation within reasonable run times [118].
The acquisition of MS/MS data is highly recommended to facilitate structural elucidation, particularly for unknown compounds or reaction intermediates [118]. For complex mixtures, the use of untargeted data acquisition approaches ensures comprehensive coverage of the metabolome or reactome, with subsequent multivariate analysis to identify features of interest [118]. In automated reaction monitoring platforms, these acquisition parameters can be standardized and automated to ensure reproducibility across large sample sets [25] [2].
Integrated SHY Data Analysis Workflow
The SHY data analysis workflow involves multiple stages of data processing, integration, and interpretation, as visualized in the following workflow diagram:
Figure 1: SHY Data Analysis Workflow
The workflow begins with parallel preprocessing of both NMR and MS data sets. For NMR, this typically includes phase and baseline correction, chemical shift alignment, and spectral bucketing or normalization [116] [59]. For MS data, preprocessing involves peak picking and alignment, retention time correction, and intensity normalization [118]. Both data sets are then subjected to multivariate statistical analysis (such as PCA or OPLS-DA) to identify significant features contributing to class separation or reaction progression [118].
The core SHY analysis involves calculating the covariance matrix between NMR chemical shifts and MS m/z features, with significant correlations indicating molecular relationships between features detected by both platforms [116] [117]. These correlations can be visualized in heterospectroscopy correlation maps, facilitating the identification of molecular families and connected metabolic pathways [116]. The final stage involves structural elucidation of significant features, combining information from both platforms to confidently identify biomarkers or reaction components [118].
Application in Automated Reaction Monitoring
Integration with Automated Platforms
The implementation of SHY within automated reaction monitoring environments represents a significant advancement in high-throughput chemical synthesis and analysis. Modern automated platforms, such as the Chemspeed FLEX AUTOPLANT system, combine state-of-the-art benchtop NMR with fully automated solutions to enhance efficiency, optimize reactions, and address complex challenges in industrial applications [25]. These systems integrate automated reaction preparation, synthesis, work-up, analysis, and output to storage vials for both solid- and liquid-phase library synthesis and reaction screening [25].
A key innovation enabling SHY in automated environments is the development of integrated purification and analysis workflows that couple automated purification to both MS and NMR analysis across synthetic scales (∼3.0–75.0 μmol) [2]. These platforms generate and acquire 1.7 mm NMR samples as part of a high-throughput automated workflow, processing up to 36,000 compounds yearly while utilizing "dead volume" that would be inaccessible in conventional liquid handling [2]. This approach allows NMR sample generation from as little as 10 μg without consuming material prioritized for biological assays, making NMR analysis feasible for high-throughput applications [2].
Real-Time Reaction Monitoring
SHY enhances real-time reaction monitoring by providing comprehensive molecular understanding through the correlation of NMR and LC-MS data. Software platforms like Mnova enhance reaction monitoring by integrating NMR and LC-MS data analysis, allowing chemists to collect detailed spectroscopic, chromatographic, and kinetic data throughout reactions [59]. This integrated approach provides insights into reaction progression, intermediate formation, and byproduct generation that would be difficult to obtain from either technique alone.
The application of SHY in reaction monitoring enables researchers to streamline reaction optimization by automating the tracking and quantification of reaction participants across multiple reactions [59]. By leveraging molecular information from both NMR and MS platforms, these tools accurately identify and quantify reaction compounds, generating a range of outputs to facilitate decision-making and reduce cycle times in the design-make-test-analyze (DMTA) cycle [2]. The combined approach is particularly valuable for distinguishing between isomeric compounds (epimers, regioisomers, or atropisomers) that cannot be discriminated by MS alone [2].
Detailed Experimental Protocol
Sample Preparation Protocol
Table 2: Sample Preparation Steps for SHY Analysis
| Step | Procedure | Parameters | Notes |
|---|---|---|---|
| 1. Reaction Sampling | Collect time-point samples throughout reaction progression | 50-100 μL aliquots; multiple time points | Quench reaction if necessary to preserve metabolic profile [118] |
| 2. Protein Precipitation | Add 3 volumes cold methanol or acetonitrile | 1:3 sample:solvent ratio; vortex 60s; centrifuge 15min, 4°C, 14000g | Superior metabolite recovery vs. ultrafiltration [119] |
| 3. Sample Division | Split supernatant for NMR and MS analysis | 60% for NMR, 40% for MS (adjust based on sensitivity requirements) | Maintain same source material for both analyses [118] |
| 4. NMR Sample Prep | Transfer to NMR tube with D₂O containing TSP reference | 500 μL final volume; 3 mm NMR tubes for limited samples | TSP (0.5 mM) for chemical shift reference (δ 0.0 ppm) and quantitation [119] |
| 5. MS Sample Prep | Dilute with LC-compatible solvent if necessary | Typically 1:1 with water containing 0.1% formic acid | Compatibility with UPLC mobile phase system [118] |
Instrumental Analysis Parameters
Table 3: Instrumental Parameters for NMR and UPLC-MS Analysis
| Parameter | NMR Acquisition | UPLC-MS Acquisition |
|---|---|---|
| Instrument | 600 MHz or higher with automated sample changer | UPLC system coupled to HRMS (TOF or Orbitrap) |
| Temperature | 25°C | 40°C column temperature |
| Acquisition Time | 3-4 minutes per sample | 10-15 minutes gradient per sample |
| Key Settings | Noesy-presat water suppression; 64 transients; 4s relaxation delay | C18 column (100 × 2.1 mm, 1.7-1.9 μm); 0.4 mL/min flow rate |
| Data Collection | 64k data points; spectral width 20 ppm | ESI positive/negative mode; 50-1500 m/z range |
| Quality Control | Pooled quality control sample every 10 injections | Pooled QC sample; solvent blanks [118] |
Data Processing and SHY Analysis Protocol
NMR Data Processing:
- Apply exponential line broadening (0.3 Hz) before Fourier transformation
- Perform phase and baseline correction manually or automatically
- Reference to TSP signal at δ 0.0 ppm
- Perform spectral alignment using recursive segment-wise peak alignment
- Reduce data to integrated spectral regions (buckets) of 0.04 ppm width
- Normalize to total spectral area or specific reference signal
MS Data Processing:
- Perform peak picking, alignment, and retention time correction
- Apply mass accuracy calibration using reference compounds
- Perform peak integration and extract ion chromatogram generation
- Normalize to total ion current or specific internal standards
- Annotate features using accurate mass databases (±5 ppm tolerance)
SHY Statistical Integration:
- Combine NMR and MS data matrices with sample-matched order
- Perform Pareto scaling or unit variance scaling to both data sets
- Calculate correlation matrix between NMR buckets and MS features
- Apply false discovery rate correction for multiple comparisons
- Extract significant correlations above confidence threshold (typically p<0.001)
- Visualize in heterospectroscopy correlation plots
Structural Elucidation:
- Identify correlated NMR-MS feature pairs
- Propose molecular formulas from accurate mass measurements
- Interpret NMR chemical shifts and coupling patterns for structural information
- Consult databases (HMDB, PubChem, in-house libraries) for candidate matches
- Verify identities with authentic standards when available
Research Reagent Solutions and Essential Materials
Table 4: Essential Research Reagents and Materials for SHY Implementation
| Category | Item | Specifications | Application/Function |
|---|---|---|---|
| NMR Consumables | NMR tubes | 3mm or 5mm depending on sample volume | Sample containment for NMR analysis |
| Deuterated solvents | D₂O, CD₃OD, DMSO-d₆ | NMR solvent providing lock signal | |
| Chemical shift reference | TSP (sodium trimethylsilylpropanesulfonate) | Chemical shift reference (δ 0.0 ppm) and quantitation | |
| MS Consumables | UPLC columns | C18 (100 × 2.1 mm, 1.7-1.9 μm) | Compound separation prior to MS detection |
| Mobile phase additives | Formic acid, ammonium acetate, ammonium formate | Modify pH and promote ionization | |
| Calibration standards | ESI-L Low Concentration Tuning Mix (Agilent) | Mass accuracy calibration | |
| Automation Platforms | Automated synthesis | Chemspeed FLEX AUTOPLANT, iChemFoundry | High-throughput parallel synthesis [25] [1] |
| Liquid handlers | Tecan Evo-200, BioMicroLab XL100 | Automated sample preparation and reformatting [2] | |
| Purification systems | Preparative HPLC/SFC with fraction collection | Automated compound purification [2] | |
| Software Solutions | NMR processing | Mnova, TopSpin | NMR data processing and analysis [59] |
| MS processing | Progenesis QI, MarkerView, XCMS | MS data processing and metabolomic analysis | |
| Statistical analysis | SIMCA, MATLAB, R packages | Multivariate statistics and SHY implementation |
Case Study: SHY Application in Table Olives Quality Assessment
A recent innovative application of SHY methodology demonstrates its power in foodomics, specifically for the quality assessment of table olives [118]. This study implemented a multilevel LC-HRMS and NMR correlation workflow to characterize table olives' metabolome in search of quality markers considering geographical origin, botanical origin, and processing parameters [118].
The research applied untargeted UPLC-HRMS/MS-based analysis at different stages within a metabolomics workflow alongside NMR-based study, evaluating the complementarity of the two platforms [118]. The SHY approach, employed for the first time in table olives analysis, successfully identified different biomarkers belonging to phenyl alcohols, phenylpropanoids, flavonoids, secoiridoids, and triterpenoids as responsible for observed classifications [118]. This application highlights how SHY can increase confidence in biomarker annotation in complex matrices where reference standards are often unavailable.
The study established a binary pipeline focusing on biomarkers' identification confidence that can be applied not only to olive-based products but also to food quality control and foodomics in general [118]. This represents a significant expansion of SHY beyond its original applications in metabolomic toxicology, demonstrating its versatility across different fields requiring complex mixture analysis.
Advanced Applications and Future Perspectives
The integration of SHY with emerging technologies promises to further enhance its capabilities in automated reaction monitoring and biomarker discovery. The combination of AI/ML-driven experimentation with automated platforms ensures end-to-end optimization and reproducibility for complex chemical processes [25]. These systems leverage automated, parallel synthesis to achieve up to 100x productivity improvement over manual methods while maintaining consistent and reproducible results [25].
Future developments in SHY applications will likely focus on several key areas:
Enhanced Sensitivity and Throughput: Continued development of automated platforms that minimize sample requirements while maintaining data quality, such as the use of 1.7 mm NMR tubes for high-throughput analysis [2].
Real-Time Data Integration: Advancement in software platforms that enable real-time correlation of NMR and MS data during reaction monitoring, providing immediate feedback for reaction optimization [59].
Expanded Application Domains: Application of SHY to emerging areas such as polymer development, advanced composites, and specialty chemical development with precise reaction optimization and scale-up [25].
Standardized Workflows: Development of standardized protocols for SHY implementation across different instrument platforms and application domains, facilitating broader adoption in both academic and industrial settings.
The ongoing innovation in automated platforms and data integration tools ensures that SHY will continue to evolve as a powerful framework for multi-platform data correlation, enabling researchers to extract maximum information from complex mixtures while streamlining analytical workflows in pharmaceutical development, chemical synthesis, and metabolomics research.
Validating Automated Workflows for Regulatory Compliance
The integration of Ultra-Performance Liquid Chromatography-Mass Spectrometry (UPLC-MS) and Nuclear Magnetic Resonance (NMR) spectroscopy represents a transformative advancement in automated analytical workflows for pharmaceutical development. These techniques provide complementary data that are critical for reaction monitoring, structural elucidation, and impurity profiling [68]. As regulatory bodies like the FDA and EMA increasingly mandate rigorous quality-by-design principles, validating these automated workflows becomes paramount for ensuring data integrity, regulatory compliance, and patient safety [120] [121]. This document outlines application notes and detailed protocols for validating UPLC-MS and NMR workflows within a regulatory framework, supporting the broader thesis research on automated reaction monitoring.
Application Note: Validation of an Automated UPLC-MS/MS Method for Metabolic Stability
Background and Objective
A validated, green UPLC-MS/MS method was developed for the quantification of revumenib (SNDX-5613), a menin-KMT2A interaction inhibitor, in human liver microsomes (HLMs) [122]. The primary objective was to create a rapid, sensitive, and environmentally sustainable analytical approach to assess the compound's metabolic stability and intrinsic clearance, crucial parameters in drug development [122].
Experimental Protocol
2.2.1 Materials and Reagents
- Analytes: Revumenib (purity ≥99.88%) and encorafenib (Internal Standard, purity ≥99.63%) were obtained from MedChem Express (Princeton, NJ, USA) [122].
- Biological Matrix: Pooled Human Liver Microsomes (HLMs, 20 mg/mL) from Sigma-Aldrich (St. Louis, MI, USA) [122].
- Chemicals: Ammonium formate, formic acid, HPLC-grade acetonitrile, and methanol [122].
- Equipment: UPLC system coupled with a triple quadrupole mass spectrometer equipped with an Electrospray Ionization (ESI) source [122].
2.2.2 Instrumentation and Conditions
- Chromatography: A C8 column (50 mm x 2.1 mm, 3.5 µm) was used with an isocratic mobile phase consisting of 10 mM ammonium formate (pH 3.0) and acetonitrile (55:45, v/v) at a flow rate of 0.6 mL/min. The total runtime was 1.0 minute [122].
- Mass Spectrometry: Detection was performed in positive ESI mode with Multiple Reaction Monitoring (MRM). The parent ion of revumenib and its two characteristic product ions were monitored [122].
2.2.3 Sample Preparation
- Incubation: Revumenib was incubated with HLMs in the presence of NADPH-regenerating system.
- Reaction Termination: Aliquots were taken at predetermined time intervals (0, 5, 15, 30, and 60 minutes), and the reaction was stopped by adding ice-cold acetonitrile containing the internal standard (encorafenib).
- Protein Precipitation: Samples were vortex-mixed and centrifuged at 14,000 rpm for 10 minutes.
- Analysis: The clear supernatant was injected into the UPLC-MS/MS system [122].
2.2.4 Validation Parameters The method was validated per US FDA bioanalytical method validation guidelines, assessing the following parameters [122]:
- Linearity and Calibration Curve: A linear range of 1–3000 ng/mL with a coefficient of determination (R²) of 0.9945.
- Precision and Accuracy: Intra-day and inter-day precision (Relative Standard Deviation, RSD) were ≤11.67%, and accuracy ranged from -0.88% to 11.33%.
- Sensitivity: The Limit of Quantification (LOQ) was determined to be 0.96 ng/mL.
- Greenness Assessment: The method's environmental impact was evaluated using the Analytical Greenness (AGREE) metric, yielding a score of 0.77, confirming its green credentials [122].
Results and Discussion
The validated method successfully applied to determine the in vitro half-life (t₁/₂) and intrinsic clearance (Clᵢₙₜ) of revumenib. The low in vitro t₁/₂ (14.93 min) and high Clint (54.31 mL/min/kg) indicated that revumenib resembles drugs with a high extraction ratio, a key finding for predicting its in vivo pharmacokinetic behavior [122]. The AGREE score of 0.77 demonstrates a commitment to Green Analytical Chemistry (GAC) principles, reducing hazardous waste and energy consumption [122].
Application Note: Integrating NMR for Comprehensive Structural Elucidation in an Automated Workflow
Background and Objective
NMR spectroscopy is a non-destructive technique providing unparalleled insight into molecular structure, stereochemistry, and dynamics [22] [121]. This note details the use of NMR within a GMP-compliant, automated workflow for the structural verification of a novel small molecule drug candidate, focusing on chiral center analysis and impurity identification that may be missed by LC-MS alone [22].
Experimental Protocol
3.2.1 Sample Preparation
- The analyte (~2-5 mg) was dissolved in 0.6 mL of an appropriate deuterated solvent (e.g., DMSO-d6, CDCl3) [68].
- The solution was transferred to a standard 5 mm NMR tube for analysis.
3.2.2 NMR Instrumentation and Data Acquisition
- Instrument: A high-field NMR spectrometer (e.g., 600 MHz) equipped with a cryoprobe for enhanced sensitivity [22].
- Standard 1D and 2D Experiments:
- ¹H NMR: For proton environment identification and quantification.
- ¹³C NMR (with DEPT): For carbon environment identification (CH₃, CH₂, CH, C).
- COSY (Correlation Spectroscopy): For identifying proton-proton coupling networks.
- HSQC (Heteronuclear Single Quantum Coherence): For direct ¹H-¹³C correlations.
- HMBC (Heteronuclear Multiple Bond Correlation): For long-range ¹H-¹³C correlations (2-3 bonds).
- NOESY/ROESY (Nuclear Overhauser Effect Spectroscopy): For determining spatial proximity and stereochemistry [22].
3.2.3 Data Processing and Analysis
- Raw data were processed (Fourier transformation, phasing, baseline correction) using vendor software.
- Structural elucidation was performed by expert analysts, with support from Graph Convolutional Neural Networks (GCNNs) for predicting chemical shifts and assisting in spectral assignment [123].
Results and Discussion
The integrated 2D-NMR approach successfully confirmed the molecular structure and assigned the absolute configuration of chiral centers for the drug candidate. In a case study, this methodology identified a critical stereochemical inversion that was not detectable by LC-MS, leading to a 30% reduction in development time and cost savings [22]. NMR's ability to detect isomeric impurities and non-ionizable compounds makes it an orthogonal and essential technique to MS in an automated workflow, ensuring comprehensive quality control [22].
Unified Protocol: Validation of a Combined UPLC-MS/NMR Workflow for Automated Reaction Monitoring
The following diagram illustrates the integrated, automated workflow for reaction monitoring and validation, from sample preparation to regulatory submission.
Detailed Validation Methodology
This protocol validates the entire automated workflow, ensuring data integrity and regulatory compliance from sample to submission [68] [121].
4.2.1 Sample Preparation for Multi-Technique Analysis A unified sample preparation protocol enables sequential analysis by both NMR and UPLC-MS from a single aliquot, minimizing sample volume and variability [68].
- Protein Removal: For biofluids, use solvent precipitation (e.g., with acetonitrile) followed by molecular weight cut-off (MWCO) filtration.
- Buffer Compatibility: Reconstitute the sample pellet in a deuterated buffer (e.g., D₂O phosphate buffer) compatible with both NMR and LC-MS. Studies show no significant deuterium incorporation into metabolites and minimal impact on LC-MS feature abundance [68].
- Aliquot Division: The prepared sample is first analyzed by NMR and then transferred for UPLC-MS analysis.
4.2.2 Automated System Configuration
- UPLC-MS System: Configured for high-throughput analysis with automated sample injection.
- NMR System: Equipped with a sample changer for unattended operation.
- Data Handling: An integrated Laboratory Information Management System (LIMS) and automated data pipelines to transfer, process, and archive data from both instruments.
4.2.3 Validation Parameters for the Integrated Workflow The validation must demonstrate that the combined workflow is specific, accurate, precise, and robust [122] [121].
Table 1: Key Validation Parameters for the UPLC-MS/NMR Workflow
| Parameter | Procedure for UPLC-MS | Procedure for NMR | Acceptance Criteria |
|---|---|---|---|
| Specificity | No interference at analyte retention time; resolution >1.5 [122]. | No spectral overlap from buffer or impurities; clear identification of target nuclei [121]. | Peak purity >99%; unambiguous structural assignment. |
| Linearity | Minimum of 5 concentrations analyzed in triplicate; R² ≥ 0.995 [122]. | Preparation of standard solutions for quantification; linearity of integration [121]. | R² ≥ 0.990 for both techniques. |
| Accuracy | Spike recovery of 85-115% at LOQ, LQC, MQC, HQC levels [122]. | Comparison with reference standard; recovery of 90-110% [121]. | Mean recovery within 85-115% for MS, 90-110% for NMR. |
| Precision | Intra-day & inter-day RSD ≤15% for LLOQ and ≤10% for other QCs [122]. | Repeatability of integration and chemical shift; RSD ≤5% for quantitative NMR (qNMR) [121]. | RSD ≤15% for all levels. |
| Robustness | Deliberate variation in flow rate, mobile phase pH, column temperature [122]. | Variation in temperature, shimming, and pulse calibration [121]. | RSD of retention time/chemical shift <2%. |
The Scientist's Toolkit: Essential Research Reagents and Materials
Table 2: Key Reagents and Materials for UPLC-MS/NMR Workflow Validation
| Item | Function/Application | Example/Specification |
|---|---|---|
| Deuterated Solvents | NMR analysis providing the magnetic field lock signal. | DMSO-d6, D₂O, CDCl₃ (99.8% atom D) [68]. |
| HLMs / S9 Fraction | In vitro study of drug metabolic stability and clearance [122]. | Pooled human liver microsomes (20 mg/mL) [122]. |
| NADPH Regenerating System | Cofactor for cytochrome P450 enzymes in metabolic incubations [122]. | Solution A: NADP+, Glucose-6-phosphate. Solution B: Glucose-6-phosphate dehydrogenase. |
| Analytical UPLC Columns | High-resolution chromatographic separation. | C8 or C18 column (50-100mm x 2.1mm, sub-2µm) [122]. |
| Mass Spectrometry Standards | Calibration and tuning for accurate mass measurement. | Vendor-specific calibration solution for ESI positive/negative mode. |
| qNMR Reference Standards | For quantitative NMR, providing a known concentration for calibration. | High-purity maleic acid or dimethyl sulfone [121]. |
| GMP-Compliant NMR Service | Outsourced, regulatory-ready structural elucidation. | Providers offering GLP/GMP-compliant reporting for submissions [22] [121]. |
Regulatory Intelligence and Automated Compliance
Validated workflows must operate within a modern regulatory framework. AI-powered regulatory intelligence tools are critical for maintaining compliance by automating the monitoring of global regulatory changes (e.g., from FDA, EMA) and providing impact analysis on validated methods [124]. Furthermore, automation in pharmacovigilance (PV) ensures compliance through automated case intake, duplicate detection, and reporting, which enhances accuracy, consistency, and audit readiness [120]. The following diagram outlines the automated compliance and submission process.
The validation of automated workflows integrating UPLC-MS and NMR is a cornerstone of modern, compliant drug development. By implementing the detailed application notes and protocols outlined above—encompassing rigorous method validation, a unified sample preparation strategy, and leveraging AI for regulatory intelligence—research organizations can significantly enhance the reliability, efficiency, and compliance of their analytical operations. This structured approach not only accelerates development timelines but also ensures that products meet the stringent standards required for regulatory approval, ultimately safeguarding public health.
Automated reaction monitoring represents a critical frontier in modern chemical research and drug development, enabling high-throughput, data-rich investigations into reaction mechanisms and kinetics. Within this domain, Ultra-Performance Liquid Chromatography–Mass Spectrometry (UPLC-MS) and Nuclear Magnetic Resonance (NMR) spectroscopy have emerged as powerful complementary analytical platforms [49] [125]. This application note details rigorous benchmarking studies that quantify the performance gains and error reduction achieved through methodological and computational advances in these technologies. We present structured quantitative data, detailed experimental protocols, and visual workflows to guide researchers in implementing these optimized approaches for enhanced experimental productivity and data reliability in automated reaction monitoring systems.
Benchmarking UPLC-MS Versus Direct Infusion MS Approaches
Performance Comparison and Quantitative Analysis
UPLC-MS and Direct Infusion–nanoelectrospray High-Resolution Mass Spectrometry (DI–nESI–HRMS) were systematically compared for metabolic profiling of human urine samples from a large epidemiological cohort. Both methods were optimized for simultaneous collection of high-resolution metabolic profiles and quantitative data for a panel of 35 metabolites [49]. The key benchmarking results are summarized in Table 1.
Table 1: Performance Benchmarking of UPLC-HRMS vs. DI-nESI-HRMS for Metabolic Profiling
| Performance Metric | UPLC-HRMS | DI-nESI-HRMS |
|---|---|---|
| Total Run Time | 5 days (for 132 samples in both polarities) | 9 hours (for 132 samples in both polarities) |
| Metabolite Identification Specificity | High | Less Specific |
| Correlation of Quantitative Results | Reference Method | 10 metabolites with strong correlation (Pearson’s r > 0.9)20 metabolites with acceptable correlation5 metabolites with weak correlation (Pearson’s r < 0.4) |
| Discriminatory Power | Detected sex-related biochemical differences | Detected largely the same significant features for sex discrimination |
Experimental Protocol for UPLC-HRMS and DI-nESI-HRMS Analysis
Sample Preparation Protocol:
- Urine Dilution: Thawed urine samples were pipetted in randomized order into deep-well plates.
- Dilution Optimization: For DI–nESI–HRMS, samples were diluted 50-fold with ultrapure water. For UPLC–HRMS, different dilution factors were optimized and applied [49].
- Internal Standard Addition: 25 μL of a multianalyte mixture of labeled internal standards prepared in methanol was added to 50 μL of diluted sample.
- Volume Adjustment: The total volume was adjusted to 150 μL with methanol, achieving a final water–methanol proportion of 1:2.
- Pooled Sample Creation: 10 μL of each thawed urine sample were mixed to create a pooled urine sample for preparing study reference, quality control, and calibration series.
Instrumental Analysis Protocol - DI–nESI–HRMS:
- Platform: TriVersa Advion NanoMate system in infusion mode coupled to HRMS QTOF Synapt G2-S (Waters, Manchester, U.K.).
- Measurement: Direct measurement of m/z values in full-scan mode.
- Quantification: Based on the ratio of intensities of each analyte to its corresponding isotopically labeled internal standard [49].
Instrumental Analysis Protocol - UPLC–HRMS:
- Platform: Ultra-performance liquid chromatography system coupled to high-resolution mass spectrometer.
- Chromatography: Reversed-phase chromatography with optimized gradient elution.
- Data Acquisition: Simultaneous global metabolic profiling in full-scan mode and quantitative analysis of targeted analytes [49].
Advanced NMR Methodologies for Enhanced throughput
Ultrafast 2D NMR for Complex Mixture Analysis
Ultrafast (UF) 2D NMR represents a significant methodological advancement for analyzing complex biochemical mixtures where data acquisition time is a crucial limitation, such as in monitoring ongoing chemical reactions or processing large sample collections [126]. This approach enables the acquisition of entire 2D NMR correlation spectra in a single scan or a small number of scans, dramatically reducing experiment time from hours to seconds or minutes while maintaining both structural and quantitative information content.
Table 2: Key Research Reagent Solutions for UPLC-MS and NMR Metabolomics
| Reagent/Material | Function/Application |
|---|---|
| Labeled Internal Standards | Isotopically labeled compounds for quantitative MS; correct for matrix effects and ionization efficiency variations [49]. |
| Methanol (MS Grade) | Sample preparation solvent for protein precipitation and metabolite extraction [49]. |
| Ultrapure Water | Diluent for urine and biofluid samples to reduce ionic suppression in MS analysis [49]. |
| Boric Acid | Urine preservative; stabilizes metabolite composition during sample storage [49]. |
| Deuterated Solvents | NMR spectroscopy; provides field frequency lock and minimizes solvent signal interference [125]. |
| Reference Compounds | Chemical shift referencing for NMR (e.g., TSP, DSS); quantitative calibration [125]. |
| pH Buffer Solutions | Standardize sample pH for NMR to minimize chemical shift variation; crucial for quantitative reproducibility [125]. |
Protocol for Quantitative NMR Metabolomics
Sample Preparation for Urine Metabolomics:
- Collection: Collect urine with boric acid added as a preservative.
- Centrifugation: Centrifuge samples to remove particulate matter.
- pH Standardization: Adjust pH using buffer solutions to minimize chemical shift variations.
- Referencing: Add internal reference compounds (e.g., TSP, DSS) for chemical shift referencing and quantification [125].
Data Acquisition and Processing:
- Pulse Sequence Selection: Employ standardized pulse sequences optimized for quantitative analysis.
- Acquisition Parameters: Use consistent acquisition parameter ranges across samples.
- Relaxation Considerations: Account for relaxation effects on quantitation, particularly for metabolites with varying T1 relaxation times.
- Spectral Processing: Apply consistent line-broadening, phasing, and baseline correction protocols [125].
Computational Advances for Automated Workflows
SmartState: Automated Protocol Adherence System
SmartState represents an automated state-based system designed to act as a personal agent for each participant in research studies, continuously managing and tracking unique interactions. This system addresses the limitations of traditional rule-based systems by providing real-time, automated data collection with minimal oversight [127]. The core architecture integrates four components:
- Messaging Service: Handles communication with participants via texting, emailing, or calling.
- State Machine: Utilizes finite state machines (FSMs) to track participant progress through defined study protocols.
- Conversational AI: Employs large language models (LLMs) to distill participant conversations into structured data.
- Web Platform: Provides researchers with access to participant logs, reports, and messaging utilities [127].
Asari: Trackable LC-MS Data Processing
Asari is an open-source software tool designed to address reproducibility challenges in LC-MS metabolomics data processing. Its algorithmic framework implements:
- Mass Track Concept: Defined as a series of LC-MS data points of the same consensus m/z value spanning full retention time, enabling robust mass alignment before elution peak detection.
- mSelectivity Function: Ensures distinguished m/z features comply with instrument mass resolution capabilities.
- Explicit Trackability: All processing steps are explicitly trackable to enhance reproducibility and transparency [19].
LLM-Guided Chemical Logic for Reaction Exploration
The ARplorer program demonstrates the integration of large language models for automated reaction pathway exploration. This approach combines:
- General Chemical Logic: Pre-generated from literature sources, books, and databases.
- System-Specific Chemical Logic: Generated by specialized LLMs based on SMILES representations of reaction systems.
- Quantum Mechanics Integration: Uses GFN2-xTB and Gaussian 09 algorithms for potential energy surface exploration and transition state identification [128].
Workflow Visualization
UPLC-MS versus DI-MS Benchmarking Workflow
Automated Reaction Monitoring System Architecture
This benchmarking analysis demonstrates significant productivity improvements and error reduction achievable through strategic implementation of advanced UPLC-MS and NMR methodologies within automated reaction monitoring systems. The quantitative comparison reveals a clear trade-off between analysis speed (favoring DI–nESI–HRMS) and metabolite identification specificity (favoring UPLC–HRMS). When integrated with automated systems like SmartState for protocol adherence and specialized software like Asari for data processing, researchers can achieve substantial gains in experimental throughput while maintaining data integrity. These protocols and workflows provide a validated foundation for deploying robust, automated reaction monitoring systems in drug development and chemical research environments.
The structural elucidation of unknown compounds and the analysis of complex reaction mixtures represent a significant challenge in modern drug discovery and development. Individually, Ultra-Performance Liquid Chromatography–Mass Spectrometry (UPLC-MS) and Nuclear Magnetic Resonance (NMR) spectroscopy provide powerful analytical capabilities, but each has distinct limitations that can be overcome through strategic integration. UPLC-MS offers exceptional sensitivity, with limits of detection in the femtomole range for analytes with high ionization efficiency, and provides molecular weight information from which elemental composition can be deduced [4]. Tandem mass spectrometry (MS/MS) further yields structural information based on characteristic fragmentation patterns [4]. However, MS alone cannot reliably distinguish isobaric compounds and positional isomers, and its data are heavily dependent on instrumentation and ionization conditions [4].
NMR spectroscopy, in contrast, provides definitive structural characterization through atomic connectivity information derived from chemical shifts, splitting patterns, and multi-dimensional experiments [4]. It is non-destructive, intrinsically quantitative, and produces data that are constant and reproducible across different instruments [4]. The primary limitation of NMR is its inherently low sensitivity, requiring microgram quantities of material and acquisition times ranging from minutes to days, compared to the seconds or minutes required for thorough MS analysis [4]. The integration of UPLC-MS and NMR creates a synergistic analytical platform that leverages the complementary strengths of both techniques, enabling comprehensive molecular characterization that would be impossible with either technique alone [4] [68]. This application note details practical protocols and workflows for implementing this combined approach, particularly within the context of automated reaction monitoring for drug development.
Experimental Protocols and Workflows
A Unified Workflow for Integrated Analysis
The following diagram illustrates a streamlined workflow that integrates sample preparation, separation, and analysis by both UPLC-MS and NMR, facilitating comprehensive characterization of complex reaction mixtures.
Detailed Methodologies
Sample Preparation Protocol for Combined UPLC-MS and NMR Analysis
A critical initial step involves preparing samples in a manner compatible with both analytical techniques. For biofluids like blood serum, a unified preparation protocol has been validated [68].
- Protein Removal: Treat the sample (e.g., 100 µL of human serum) with 300 µL of deuterated methanol (MeOD) or acetonitrile (ACN-d3). Vortex mix vigorously for 60 seconds.
- Precipitation and Centrifugation: Incubate the mixture at -20°C for 30 minutes to precipitate proteins. Subsequently, centrifuge at 14,000 × g for 15 minutes at 4°C.
- Supernatant Collection and Evaporation: Carefully transfer the supernatant to a new vial. Evaporate the solvent to dryness under a gentle stream of nitrogen gas at room temperature.
- Reconstitution for Analysis: Reconstitute the dried extract in 600 µL of a deuterated phosphate buffer (e.g., 100 mM potassium phosphate in D2O, pD 7.4). Centrifuge again at 14,000 × g for 10 minutes to remove any residual particulates. The final supernatant is now suitable for both NMR analysis and subsequent injection into the UPLC-MS system [68].
Significance: This protocol demonstrates that deuterated solvents required for NMR are well-tolerated by LC-MS, and no significant deuterium exchange into metabolites is observed, ensuring data compatibility [68].
Automated High-Throughput Purification and NMR Sampling
For the analysis of compounds synthesized via Parallel Medicinal Chemistry (PMC), an automated workflow bridges the gap between purification and characterization [2].
- Purification and Reformating: Crude reaction mixtures are purified using a UPLC-MS system with mass-triggered or UV-triggered fraction collection. The purified compound is automatically reformatted into DMSO at specified concentrations (e.g., 4-30 mM) for biological testing.
- NMR Sample Generation from "Dead Volume": Instead of discarding the inaccessible "dead volume" (10-25 µL) from the liquid handler, this workflow rescues it. A liquid handling robot automatically adds 250 µL of DMSO to the vial containing the dead volume, effectively diluting the sample to a volume suitable for a 1.7 mm NMR tube.
- Automated NMR Acquisition: The prepared 1.7 mm NMR tube is transferred to an NMR spectrometer equipped with an automated sample changer. A standard 1D proton (1H) NMR experiment is run, with the possibility of 2D experiments for challenging structural problems. This platform can process over 36,000 compounds annually, making NMR a routine high-throughput technique [2].
Data Acquisition Parameters
Table 1: Typical UPLC-MS Operating Conditions
| Parameter | Specification |
|---|---|
| Column | C18 (e.g., 100 x 2.1 mm, 1.7 µm) |
| Mobile Phase | A: 0.1% Formic acid in H2O; B: 0.1% Formic acid in ACN [49] |
| Gradient | 3.0 min or 8.5 min, depending on scale (1-90% B) [2] |
| Flow Rate | 0.3 - 0.6 mL/min |
| Ionization | Electrospray Ionization (ESI), positive/negative mode |
| Mass Analyzer | High-Resolution Time-of-Flight (HR-ToF) or Q-ToF |
Table 2: Standard NMR Acquisition Parameters
| Parameter | Specification |
|---|---|
| Magnetic Field | 400 - 900 MHz |
| Probe Type | Cryoprobe or room-temperature 1.7 mm probe [2] |
| Temperature | 298 K |
| 1D ¹H Experiment | |
| - Spectral Width | 16 - 20 ppm |
| - Relaxation Delay | 1-2 seconds [4] |
| - Number of Scans | 16 - 128 |
| - Acquisition Time | 2-4 minutes |
| 2D Experiments (e.g., COSY, HSQC) | |
| - Acquisition Time | 30 minutes to several hours [4] |
The Scientist's Toolkit: Essential Research Reagents and Materials
Table 3: Key Reagents and Materials for Integrated UPLC-MS/NMR Analysis
| Item | Function/Benefit |
|---|---|
| Deuterated Methanol (MeOD) | Protein precipitation solvent compatible with both NMR and MS; avoids intense protonated solvent peaks in NMR [68]. |
| Deuterated Buffer (e.g., D2O with phosphate) | Provides a stable pH for metabolomic studies and a deuterium lock signal for NMR without causing significant MS ion suppression [68]. |
| Deuterated Acetonitrile (ACN-d3) | Organic mobile phase modifier for LC-MS-NMR; reduces solvent interference in NMR spectra [4]. |
| Solid-Phase Extraction (SPE) Cartridges | Post-LC concentration of analytes and exchange into fully deuterated solvents for low-abundance compounds, enhancing NMR sensitivity [4]. |
| 1.7 mm NMR Tubes | Miniaturized NMR sample format ideal for high-throughput analysis of limited material (as low as 10 µg) from automated purification platforms [2]. |
| Molecular Weight Cut-Off (MWCO) Filters | Alternative protein removal method for sample preparation, minimizing analyte loss and ensuring cleaner spectra [68]. |
Comparative Analysis of Techniques
Table 4: Quantitative Comparison of UPLC-MS and NMR Performance Characteristics
| Characteristic | UPLC-MS | NMR (LC-NMR) |
|---|---|---|
| Limit of Detection (LOD) | Femtomole (10⁻¹³ mol) [4] | Nanomole (10⁻⁹ mol) [4] |
| Analytical Speed | Seconds to minutes per sample [4] | Minutes to hours for 1D; hours for 2D [4] |
| Isomer Differentiation | Limited capability [4] | Excellent for positional isomers, stereoisomers [4] [2] |
| Quantitation | Semi-quantitative; suffers from matrix effects [4] | Inherently quantitative; no matrix effects [4] |
| Structural Information | Molecular formula, fragmentation pattern [4] | Atomic connectivity, functional groups [4] |
| Sample Throughput | Very high | Moderate (improved with automation and cryoprobes) [2] |
| Technique Complementarity | Provides molecular formula and guides fraction collection for further NMR analysis. | Delivers definitive structural confirmation, distinguishing between isobars and isomers. |
Within drug discovery and development, the design–make–test–analyze (DMTA) cycle is a foundational concept for rapidly iterating and optimizing potential therapeutic compounds. A significant bottleneck in this cycle has traditionally been the purification and characterization of newly synthesized molecules [2]. The adoption of automated, high-throughput analytical techniques, specifically UPLC-MS and NMR spectroscopy, is critical for accelerating this process. This application note provides a detailed cost-benefit analysis of these technologies, focusing on the trade-offs between instrument capital costs and achievable sample throughput in automated reaction monitoring. We present structured experimental protocols and quantitative data to guide research scientists and drug development professionals in making informed platform decisions.
Quantitative Cost and Throughput Comparison
A direct comparison of operational costs and throughput highlights the complementary strengths of NMR and UPLC-MS. The table below summarizes key metrics for integrating these technologies into an automated workflow.
Table 1: Comparative Analysis of NMR Service Costs and UPLC-MS Throughput
| Parameter | NMR Analytical Service | High-Throughput UPLC-MS |
|---|---|---|
| Standard 1H Experiment Cost | $95 (no interpretation) [129] | N/A |
| Quantitative 1H NMR (qNMR) Cost | $250 - $600 [129] | N/A |
| Professional Interpretation Fee | $275 /hr [129] | N/A |
| Analysis Time per Sample | ~5 minutes for a basic 1H spectrum [130] | ~4 minutes for a validated LC-MS/MS method [131] |
| Theoretical Daily Throughput (24h) | ~288 samples | ~360 samples |
| Best For | Structure verification, isomer distinction, quantification without standards | High-throughput quantification, metabolite identification, trace analysis |
The data shows that while NMR services incur significant per-sample costs, modern UPLC-MS methods achieve exceptional throughput with cycle times under 5 minutes [131]. However, the techniques are orthogonal; NMR provides definitive structural information that MS cannot, such as distinguishing between isomers [2].
High-Throughput Automated Workflow for Combined Analysis
To maximize efficiency, leading pharmaceutical companies have developed integrated platforms that couple automated purification with immediate UPLC-MS and NMR analysis. The following workflow diagram illustrates this process, which can handle tens of thousands of compounds annually [2].
Figure 1: Integrated automated workflow for purification and analysis. The process rescues "dead volume" from purification for NMR analysis, enabling full characterization without impacting material for biological assays [2].
Workflow Protocol: Integrated Purification and Analysis
This protocol is adapted from a high-throughput platform capable of processing over 36,000 compounds yearly [2].
- Step 1: High-Throughput Purification. Samples submitted from chemistry are purified using a Waters UPLC system coupled to UV, ELSD, and MS detectors. A 3.0-minute gradient is used for analytical and microscale workflows. Target compounds are isolated via mass-triggered fraction collection.
- Step 2: Automated Reformating and Sample Splitting. Isolated fractions are evaporated in vacuo. The purified compound is then reformatted in DMSO to standardized concentrations (e.g., 4-30 mM) using a Tecan liquid handling robot. At this stage, the workflow splits.
- Step 3A: Biological Assay Preparation. The majority of the purified material is diluted to the required concentration for biological testing and transferred to assay plates.
- Step 3B: NMR Sample Generation from "Dead Volume". Instead of discarding the inaccessible liquid handler dead volume (~10-25 µL), this volume is recovered. The Tecan robot adds DMSO to the vial, and this solution is used to generate 1.7 mm NMR samples automatically. This innovative step rescues material otherwise lost.
- Step 4: Parallel Analysis. The NMR sample is loaded onto an automated Bruker AvanceCore spectrometer for data acquisition. Simultaneously, a 5 µL aliquot of the assay stock is analyzed by UPLC-MS for purity and identity confirmation.
- Step 5: Data Processing and Verification. NMR and UPLC-MS data are processed automatically. Automated structure verification software analyzes the NMR data to confirm the target structure and identity of any isomers.
The Scientist's Toolkit: Essential Research Reagents and Materials
Successful implementation of high-throughput analysis requires specific reagents and hardware. The following table details the key components of this integrated workflow.
Table 2: Essential Research Reagent Solutions for Automated Analysis
| Item | Function / Application | Key Specifications |
|---|---|---|
| DMSO-d6 | Primary deuterated solvent for automated NMR sample preparation. | High isotopic purity (>99.8% D) for stable lock signal. |
| 1.7 mm NMR Tubes | Sample containment for micro-scale NMR. | Enables data acquisition on as little as 10 µg of compound [2]. |
| Ostro Plate | One-step extraction for plasma sample preparation in LC-MS/MS. | Removes phospholipids and proteins; used for high-throughput bioanalysis [131]. |
| Liquid Handling Robot (e.g., Tecan) | Core automation unit for reformatting and NMR sample generation. | Handles sub-25 µL "dead volumes" accurately; integrates with LIMS. |
| Bruker AvanceCore NMR | 400 MHz spectrometer for automated, high-throughput NMR. | Two-channel console; 5 mm probe or 1.7 mm microprobe; 24-position sample changer available [132]. |
| Waters UPLC System | Core chromatography system for purification and analysis. | Capable of operating at 1300 bar; coupled to MS, UV, and CAD/ELSD detectors. |
Detailed Experimental Protocols
Protocol 1: High-Throughput LC-MS/MS for Metabolite Monitoring
This protocol details a simultaneous quantification method for a drug and its metabolites, representative of high-throughput bioanalysis [131].
Figure 2: Workflow for high-throughput LC-MS/MS bioanalysis. The method uses a one-step extraction and a short run time to achieve high throughput for therapeutic drug monitoring [131].
- Sample Preparation: Piper 50 µL of human plasma into a well plate. Add a suitable internal standard. Perform a one-step protein precipitation and phospholipid removal using an Ostro plate according to the manufacturer's instructions.
- LC Conditions:
- Column: C18 (e.g., 2.1 x 50 mm, 1.7 µm)
- Mobile Phase: A: 0.1% Formic acid in water; B: 0.1% Formic acid in acetonitrile
- Gradient: Optimized for 4.0-minute total run time.
- Flow Rate: 0.4 - 0.6 mL/min
- MS Conditions:
- Ionization: Electrospray Ionization (ESI) in positive mode.
- Detection: Multiple Reaction Monitoring (MRM).
- Source Temperature: 150 °C
- Desolvation Temperature: 500 °C
- Validation: The method was validated per ICH M10 guidelines, demonstrating linearity (e.g., 0.25–200 ng/mL for albendazole), accuracy, precision, and stability [131].
Protocol 2: Automated NMR Structure Verification
This protocol is for acquiring NMR data in an automated high-throughput workflow, as implemented in integrated purification platforms [2].
- Sample Preparation: Automated preparation from "dead volume" rescue into 1.7 mm NMR tubes using a Tecan liquid handling robot. Typical sample concentration is 4-10 mM in DMSO-d6.
- NMR Acquisition:
- Instrument: Bruker AvanceCore 400 MHz NMR spectrometer with a 1.7 mm microprobe [132].
- Experiment: Standard 1D 1H NMR experiment.
- Parameters: Number of scans (NS) = 16, Steady-state scans (DS) = 4, Acquisition time = ~4 minutes.
- Data Processing and Analysis:
- Processing: Automatic Fourier transformation and phasing.
- Analysis: Data is processed using automated structure verification software, which compares the observed spectrum to the predicted spectrum of the target compound. This confirms structure and flags potential isomers or impurities.
The strategic implementation of automated UPLC-MS and NMR platforms presents a compelling cost-benefit case for modern drug development. While the initial capital investment is significant, the dramatic increase in sample throughput and the ability to obtain rich, orthogonal data for every compound fundamentally accelerates the DMTA cycle. The integrated workflow demonstrated here, which cleverly rescues "dead volume" for NMR analysis, exemplifies the next generation of analytical science. It moves NMR from a manual, low-throughput technique to a core, automated pillar of high-throughput characterization. This enables research teams to make faster, more informed decisions based on comprehensive structural data, ultimately reducing the time and cost of bringing new therapeutics to patients.
Conclusion
The integration of UPLC-MS and NMR within automated platforms represents a fundamental shift in chemical research, moving from discrete, manual analyses to continuous, intelligent reaction monitoring. This synergy leverages the high sensitivity and broad metabolite coverage of UPLC-MS with the unparalleled structural elucidation and reproducibility of NMR, creating a comprehensive analytical picture. As demonstrated, successful implementation hinges on robust hardware integration, intelligent software, and AI-driven optimization, leading to dramatic gains in productivity and data quality. The future points towards fully autonomous 'self-driving laboratories,' where these validated, automated workflows will not only accelerate discovery in drug development and materials science but also redefine the very pace of chemical innovation. Embracing this integrated approach is no longer optional but essential for researchers aiming to remain at the forefront of scientific discovery.
References
- 1. Automated Intelligent Platforms for High‐Throughput ... [https://www.sciencedirect.com/science/article/pii/S2949747724000150]
- 2. An Automated Purification Workflow Coupled with Material ... [https://pmc.ncbi.nlm.nih.gov/articles/PMC11403749/]
- 3. 4.4. UPLC-MS Analysis [https://bio-protocol.org/exchange/minidetail?id=9973593&type=30]
- 4. The integration of LC-MS and NMR for the analysis of low ... [https://pmc.ncbi.nlm.nih.gov/articles/PMC6339611/]
- 5. UPLC–MS for metabolomics: a giant step forward in ... [https://pmc.ncbi.nlm.nih.gov/articles/PMC5721520/]
- 6. Synthetic Reaction Monitoring Using UPLC-MS [https://www.waters.com/nextgen/us/en/library/application-notes/2007/synthetic-reaction-monitoring-using-uplc-ms.html?srsltid=AfmBOopALku2rcmqyPWACCxwr3U9SvXKIzOHsOC8RNp_ooSAoJuDbcqv]
- 7. The Advantages of Reaction Monitoring by NMR at Pfizer [https://www.selectscience.net/article/the-advantages-of-reaction-monitoring-by-nmr-at-pfizer]
- 8. NMR Reaction-Monitoring as a Process Analytical Technique [https://www.pharmtech.com/view/nmr-reaction-monitoring-process-analytical-technique]
- 9. Integrating NMR and MS for Improved Metabolomic Analysis [https://www.mdpi.com/1420-3049/30/12/2624]
- 10. LC-NMR-MS in drug discovery [https://pubmed.ncbi.nlm.nih.gov/12867148/]
- 11. Reaction Monitoring Market Size, Share & Forecast to 2032 [https://www.researchandmarkets.com/report/reaction-monitoring?srsltid=AfmBOooLdsNONdC1thYDV1WiHX1KCY6kifKECdXwnFYduEHacMZojP8y]
- 12. Selected Reaction Monitoring Charting Growth Trajectories [https://www.archivemarketresearch.com/reports/selected-reaction-monitoring-780389]
- 13. Automated optimization of a flow reactor by using Bayesian ... [https://magritek.com/2025/06/13/automated-optimization-of-a-flow-reactor-by-using-bayesian-algorithms-and-inline-nmr-monitoring/]
- 14. Optimization of Extraction Methods for NMR and LC-MS ... [https://www.mdpi.com/1420-3049/30/16/3379]
- 15. Ultra-Performance Liquid Chromatography–Tandem Mass ... [https://www.mdpi.com/1424-8247/18/10/1474]
- 16. Fourier RXN Lite Synthesis [https://www.bruker.com/en/products-and-solutions/automation-digitalization/fourier-rxn-lite-synthesis.html]
- 17. Mass spectrometry-based metabolomic as a powerful tool to ... [https://pmc.ncbi.nlm.nih.gov/articles/PMC12067679/]
- 18. Advances in high throughput LC/MS based metabolomics [https://www.sciencedirect.com/science/article/pii/S0165993623000419]
- 19. Trackable and scalable LC-MS metabolomics data ... [https://www.nature.com/articles/s41467-023-39889-1]
- 20. An open-source toolkit to visualize mass spectrometer data [https://pmc.ncbi.nlm.nih.gov/articles/PMC8739458/]
- 21. An Automated, Highly Selective Reaction Monitoring ... [https://pmc.ncbi.nlm.nih.gov/articles/PMC11504610/]
- 22. 2025 Pharma Trends: Structure elucidation services by NMR [https://resolvemass.ca/structure-elucidation-services-by-nmr/]
- 23. 4.7: NMR Spectroscopy [https://chem.libretexts.org/Bookshelves/Analytical_Chemistry/Physical_Methods_in_Chemistry_and_Nano_Science_(Barron)/04%3A_Chemical_Speciation/4.07%3A_NMR_Spectroscopy]
- 24. High-Accuracy Quantitative Nuclear Magnetic Resonance ... [https://pmc.ncbi.nlm.nih.gov/articles/PMC12509184/]
- 25. Process Research and Benchtop Online NMR [https://www.bruker.com/en/products-and-solutions/automation-digitalization/process-research-and-benchtop-online-nmr.html]
- 26. Workflow Automation - Mestrelab Research Analytical ... [https://mestrelab.com/workflow-automation]
- 27. Higher Contrast in 1H-Observed NMR Ligand Screening ... [https://pubmed.ncbi.nlm.nih.gov/39950359/]
- 28. Dissemination of Original NMR Data Enhances ... [https://pmc.ncbi.nlm.nih.gov/articles/PMC5001890/]
- 29. Solubility Screening by UPLC-MS/MS [https://www.waters.com/nextgen/pt/pt/library/application-notes/2008/solubility-screening-by-uplc-ms-ms.html?srsltid=AfmBOoohd_9IWvyDv5RCz73DxkXjfaS7mQfdZyf-LKc__Hx4UMJtZa3r]
- 30. LC/MS applications in drug development [https://pubmed.ncbi.nlm.nih.gov/10568041/]
- 31. NMR spectroscopy in drug discovery and development [https://pmc.ncbi.nlm.nih.gov/articles/PMC8963582/]
- 32. Representation of selected-reaction monitoring data in the ... [https://pmc.ncbi.nlm.nih.gov/articles/PMC4692094/]
- 33. Recommended Software for NMR Data Process [https://sites.gatech.edu/nmr-center/recommended-software/]
- 34. Exploring the Frontiers of Computational NMR: Methods ... [https://pmc.ncbi.nlm.nih.gov/articles/PMC12530207/]
- 35. Automated selected reaction monitoring data analysis ... [https://pubmed.ncbi.nlm.nih.gov/23887179/]
- 36. HPLC 2025 Day 1: Automating The Analytical Laboratory [https://www.chromatographyonline.com/view/hplc-2025-day-1-automation]
- 37. Autonomous mobile robots for exploratory synthetic chemistry [https://www.nature.com/articles/s41586-024-08173-7]
- 38. Automated high-throughput RP-HPLC-MS and SFC- ... [https://www.sciencedirect.com/science/article/abs/pii/S0021967324010215]
- 39. Artificial intelligence-driven autonomous laboratory for ... [https://www.oaepublish.com/articles/cs.2025.66]
- 40. The Future of Analytical Labs: Data, Automation, and AI [https://www.labmanager.com/the-future-of-analytical-labs-data-automation-and-ai-34418]
- 41. Machine learning in NMR spectroscopy [https://www.sciencedirect.com/science/article/pii/S0079656525000196]
- 42. Advancing Organic Chemistry Using High‐Throughput ... [https://pmc.ncbi.nlm.nih.gov/articles/PMC12462754/]
- 43. End-to-End Automated NMR and LCMS Sample Preparation [https://www.chemspeed.com/example-solutions/end-to-end-nmr-and-lcms-sample-preparation/]
- 44. Investigation of automated gravimetric sample preparation ... [https://www.sciencedirect.com/science/article/pii/S2772577425000758]
- 45. Reaction Monitoring [https://magritek.com/applications/reaction-monitoring/]
- 46. InsightMR for High-Field [https://www.bruker.com/en/products-and-solutions/mr/nmr-pharma-solutions/InsightMR.html]
- 47. Real-time NMR monitoring of intermediates and labile ... [https://pmc.ncbi.nlm.nih.gov/articles/PMC4000172/]
- 48. Reaction Monitoring [https://mestrelab.com/main-product/rm-reaction-monitoring]
- 49. Ultra-Performance Liquid Chromatography–High-Resolution ... [https://pmc.ncbi.nlm.nih.gov/articles/PMC6184476/]
- 50. NMR Chemical Shift Values Table [https://www.chemistrysteps.com/nmr-chemical-shift-values-table/]
- 51. Applying pretrained molecular representation for reaction ... [https://www.sciencedirect.com/science/article/pii/S2666386425005302]
- 52. Catalyst Optimization [https://www.virscidian.com/resource/catalyst-optimization]
- 53. A Database of Reaction Monitoring Mass Spectrometry ... [https://pmc.ncbi.nlm.nih.gov/articles/PMC3530891/]
- 54. Improving Organic Synthesis Reaction Monitoring with ... [https://www.waters.com/nextgen/us/en/library/application-notes/2010/improving-organic-synthesis-reaction-monitoring-rapid-ambient-sampling-mass-spectrometry.html?srsltid=AfmBOoo9z4Vwt16W52tJ2NX5IEVQYbiWx8mzm-BLC7sh26VY3XQVqmqJ]
- 55. Seven Essential Steps for In Situ Reaction Monitoring [https://www.spectroscopyonline.com/view/seven-essential-steps-situ-reaction-monitoring]
- 56. Drag & Drop UX Design Best Practices [https://www.pencilandpaper.io/articles/ux-pattern-drag-and-drop]
- 57. Building a Drag and Drop UI [https://blog.prototypr.io/building-a-responsive-drag-and-drop-ui-5761fd5281d5]
- 58. HTML Drag and Drop API - MDN Web Docs [https://developer.mozilla.org/en-US/docs/Web/API/HTML_Drag_and_Drop_API]
- 59. Reaction Monitoring & Optimization [https://mestrelab.com/applications/reaction-monitoring]
- 60. A Protocol for Untargeted Metabolomic Analysis: From Sample ... [https://pmc.ncbi.nlm.nih.gov/articles/PMC9284939/]
- 61. JEOL USA blog | Optimizing NMR Processing: Techniques and Best Pr [https://www.jeolusa.com/NEWS-EVENTS/Blog/optimizing-nmr-processing-techniques-and-best-practices]
- 62. Versatile non-luminescent color palette based on guest ... [https://www.nature.com/articles/s41467-021-23179-9]
- 63. Automated Multiple Reaction Monitoring (MRM) Method ... [https://www.waters.com/nextgen/us/en/library/application-notes/2025/automated-multiple-reaction-monitoring-mrm-method-development-for-peptide-drugs-using-waters_connect-for-quantitation-software.html?srsltid=AfmBOorGfjt3DSUjekoxwF4YmIubgiWWhW_ZYAoY9SnZIhbC4DyNjmF9]
- 64. An integrated self-optimizing programmable chemical ... [https://pmc.ncbi.nlm.nih.gov/articles/PMC10858227/]
- 65. ELN and LIMS: The power of integrating both systems into ... [https://www.scisure.com/blog/eln-and-lims-the-power-of-integrating-both-systems-into-your-lab]
- 66. ELN and LIMS Integration | Fast-Track Product Development [https://www.starlims.com/resources/the-potent-combination-of-eln-and-lims/]
- 67. Synthetic Reaction Monitoring Using UPLC-MS [https://www.waters.com/nextgen/us/en/library/application-notes/2007/synthetic-reaction-monitoring-using-uplc-ms.html?srsltid=AfmBOooPj-qLhFEvNWvNWq3N_FJFhIAXh52FgoALR6QqZx7rPFT1f_Ic]
- 68. Integrating NMR and multi-LC-MS-based untargeted ... [https://www.sciencedirect.com/science/article/pii/S0003267025003733]
- 69. Metabolite Measurement: Pitfalls to Avoid and Practices to ... [https://pmc.ncbi.nlm.nih.gov/articles/PMC5734093/]
- 70. Avoid Costly Errors in NGS Sample Handling and Library ... [https://seqwell.com/avoid-costly-errors-in-ngs-sample-handling-and-library-prep/]
- 71. Help for Your New Lab Techs: Avoiding Sample Prep ... [https://blog.omni-inc.com/blog/help-for-your-new-lab-techs-avoiding-sample-prep-mistakes]
- 72. Evaluation of sample preparation methods for NMR-based ... [https://www.sciencedirect.com/science/article/pii/S2405844018315706]
- 73. The Benefits of Automating Sample Preparation [https://www.biotage.com/automating-sample-preparation]
- 74. Optimizing Cell Line Development With Automated mAb ... [https://www.sartorius.com/en/knowledge/science-snippets/optimizing-cld-with-automated-sample-preparation-1412516]
- 75. How to reduce laboratory errors with automation [https://biosero.com/blog/how-to-reduce-laboratory-errors-with-automation/]
- 76. Common Errors During Sample Preparation & How to Avoid ... [https://blog.labtag.com/common-errors-during-sample-preparation-how-to-avoid-them/]
- 77. 6 reasons to automate your sample preparation workflows [https://www.thermofisher.com/blog/life-in-the-lab/6-reasons-to-automate-your-sample-preparation-workflows/]
- 78. Optimization and validation of a UPLC-MS/MS assay for ... [https://www.sciencedirect.com/science/article/pii/S1570023224000497]
- 79. Development, validation and application of a UPLC-MS ... [https://pubmed.ncbi.nlm.nih.gov/38909567/]
- 80. Development and validation of a UPLC-MS/MS method for the ... [https://bmcchem.biomedcentral.com/articles/10.1186/s13065-025-01569-0]
- 81. Beyond the Paradigm: Combining Mass Spectrometry and ... [https://pmc.ncbi.nlm.nih.gov/articles/PMC5448308/]
- 82. Improving Organic Synthesis Reaction Monitoring with ... [https://www.waters.com/nextgen/us/en/library/application-notes/2010/improving-organic-synthesis-reaction-monitoring-rapid-ambient-sampling-mass-spectrometry.html?srsltid=AfmBOoqJgpCL_zaPzLJ3atlikG_BYgyumWfCZQVuarz4ek_pt7dUwohH]
- 83. NMR-Guided Mass Spectrometry for Absolute Quantitation ... [https://pmc.ncbi.nlm.nih.gov/articles/PMC6260976/]
- 84. Development and Validation of an Up-to-Date Highly ... [https://www.mdpi.com/1424-8247/14/5/460]
- 85. Synthetic Reaction Monitoring Using UPLC-MS [https://www.waters.com/nextgen/us/en/library/application-notes/2007/synthetic-reaction-monitoring-using-uplc-ms.html?srsltid=AfmBOoplaRVQnwvoY4WEhFdIhsriaOyOakaPTdWx44OQEx50lWS6pk59]
- 86. New HPLC, MS, and CDS Products from 2024–2025 [https://www.chromatographyonline.com/view/new-hplc-ms-and-cds-products-from-2024-2025-a-brief-review]
- 87. Metabolite quantification by NMR and LC-MS/MS reveals ... [https://www.sciencedirect.com/science/article/abs/pii/S0731708516313085]
- 88. InsightMR [https://www.bruker.com/en/products-and-solutions/mr/nmr-software/insight-mr.html]
- 89. Optimization of Extraction Methods for NMR and LC-MS ... [https://pmc.ncbi.nlm.nih.gov/articles/PMC12388471/]
- 90. NMR reaction monitoring in flow synthesis - PMC [https://pmc.ncbi.nlm.nih.gov/articles/PMC5331343/]
- 91. Applications of Solution NMR Spectroscopy in Quality ... [https://www.mdpi.com/2304-8158/12/17/3240]
- 92. Using Artificial Intelligence to Drive MS Workflow Productivity [https://www.thermofisher.com/blog/analyteguru/using-artificial-intelligence-to-drive-ms-workflow-productivity/]
- 93. Fundamental and practical aspects of machine for the peak... learning [https://link.springer.com/article/10.1007/s10858-022-00393-1]
- 94. Fundamental and practical aspects of machine for the peak... learning [https://pubmed.ncbi.nlm.nih.gov/35389128/]
- 95. Review and Prospect: Applications of... | Spectroscopy Online [https://www.spectroscopyonline.com/view/review-and-prospect-applications-of-exponential-signals-with-machine-learning-in-nuclear-magnetic-resonance]
- 96. Rethinking Chromatography Workflows with AI and ... [https://www.genedata.com/company/news/details/news-article/rethinking-chromatography-workflows-with-ai-ml]
- 97. AI redefines mass spectrometry chemicals identification [https://pmc.ncbi.nlm.nih.gov/articles/PMC12647117/]
- 98. AI in Chromatography Workflows: Why Human Expertise ... [https://www.chromatographyonline.com/view/ai-chromatography-human-expertise-critical]
- 99. Chromatography 2025: Sample Preparation Goes Automated [https://www.sepscience.com/chromatography-2025-sample-preparation-goes-automated-11259]
- 100. Comparative MS- and NMR-Based Metabolome Mapping ... [https://www.mdpi.com/2223-7747/12/11/2078]
- 101. Comparison of 19F NMR and 14C Measurements for the ... [https://www.sciencedirect.com/science/article/pii/S0090955624053820]
- 102. Ion Suppression: A Major Concern in Mass Spectrometry [https://www.chromatographyonline.com/view/ion-suppression-major-concern-mass-spectrometry]
- 103. Optimizing LC‑MS/MS Sensitivity: Strategies to Overcome ... [https://biotech-spain.com/en/articles/optimizing-lc-ms-ms-sensitivity-strategies-to-overcome-ion-suppression-and-boost-robustness-in-bioanalysis/]
- 104. Compensate for or Minimize Matrix Effects? Strategies ... [https://pmc.ncbi.nlm.nih.gov/articles/PMC7412464/]
- 105. Development of high-throughput UPLC-MS/MS using multiple reaction monitoring for quantitation of complex human milk oligosaccharides and application to large population survey of secretor status and Lewis blood group - PubMed [https://pubmed.ncbi.nlm.nih.gov/35882165/]
- 106. Development of High-Throughput Green Robotic SPE ... [https://www.mdpi.com/2076-3417/15/18/10012]
- 107. Mass spectrometry-based high-throughput sample ... [https://www.sciencedirect.com/science/article/pii/S2772582025000361]
- 108. Advanced NMR Screening: Unveiling Bioactive ... [https://pmc.ncbi.nlm.nih.gov/articles/PMC12444534/]
- 109. Comparison of NMR and MS | Metabolomics [https://www.ebi.ac.uk/training/online/courses/metabolomics-introduction/designing-a-metabolomics-study/comparison-of-nmr-and-ms/]
- 110. Quantitative NMR Methods in Metabolomics - PMC [https://pmc.ncbi.nlm.nih.gov/articles/PMC9992124/]
- 111. Advancing the sensitivity of selected reaction monitoring ... [https://pmc.ncbi.nlm.nih.gov/articles/PMC3375056/]
- 112. NMR Reaction Monitoring Robust to Spectral Distortions [https://pmc.ncbi.nlm.nih.gov/articles/PMC12311900/]
- 113. Overview of Mass Spectrometry-Based Metabolomics [https://pmc.ncbi.nlm.nih.gov/articles/PMC4336784/]
- 114. Multi-site assessment of the precision and reproducibility of ... [https://pmc.ncbi.nlm.nih.gov/articles/PMC2855883/]
- 115. A new limit for blood metabolite analysis using 1H NMR ... [https://pmc.ncbi.nlm.nih.gov/articles/PMC9757760/]
- 116. Statistical heterospectroscopy, an approach to the ... [https://pubmed.ncbi.nlm.nih.gov/16408915/]
- 117. Application in Metabonomic Toxicology Studies [https://www.academia.edu/100234789/Statistical_Heterospectroscopy_an_Approach_to_the_Integrated_Analysis_of_NMR_and_UPLC_MS_Data_Sets_Application_in_Metabonomic_Toxicology_Studies]
- 118. A multilevel LC-HRMS and NMR correlation workflow ... [https://www.sciencedirect.com/science/article/abs/pii/S0039914024010208]
- 119. Can NMR solve some significant challenges in metabolomics? [https://pmc.ncbi.nlm.nih.gov/articles/PMC4646661/]
- 120. The Role of Automation in Enhancing Regulatory ... [https://www.vitrana.com/the-role-of-automation-in-enhancing-regulatory-compliance-in-pharmacovigilance/]
- 121. Unlocking Quality: The Ultimate Guide to GMP NMR ... [https://emerypharma.com/blog/unlocking-quality-the-ultimate-guide-to-gmp-nmr-testing-and-analytical-method-development-validation-services-for-reliable-release-testing/]
- 122. An Ultra-Fast Validated Green UPLC-MS/MS Approach for ... [https://pmc.ncbi.nlm.nih.gov/articles/PMC11679331/]
- 123. Graph Convolutional Neural Networks (GCNNs) for ... [https://mestrelab.com/articles/graph-convolutional-neural-networks.html]
- 124. Best AI Regulatory Intelligence Tools in 2025 [https://ioni.ai/post/best-ai-regulatory-intelligence-tool]
- 125. Recommendations and Standardization of Biomarker ... [https://pmc.ncbi.nlm.nih.gov/articles/PMC4865177/]
- 126. Ultrafast 2D NMR for the analysis of complex mixtures [https://www.sciencedirect.com/science/article/pii/S0079656522000085]
- 127. SmartState: An Automated Research Protocol Adherence ... [https://pmc.ncbi.nlm.nih.gov/articles/PMC12150725/]
- 128. Large language model guided automated reaction ... [https://www.nature.com/articles/s42004-025-01630-y]
- 129. Price List - NMR Testing Laboratory [https://process-nmr.com/services/price-list/]
- 130. UPLC–MS for metabolomics: a giant step forward in ... [https://www.sciencedirect.com/science/article/abs/pii/S1359644616304482]
- 131. A high-throughput LC-MS/MS method for simultaneous ... [https://www.sciencedirect.com/science/article/pii/S1570023225002958]
- 132. AvanceCore [https://www.bruker.com/en/products-and-solutions/mr/nmr/avancecore.html]