Batch vs Flow Chemistry: A Strategic Guide for Drug Development Research and Process Optimization
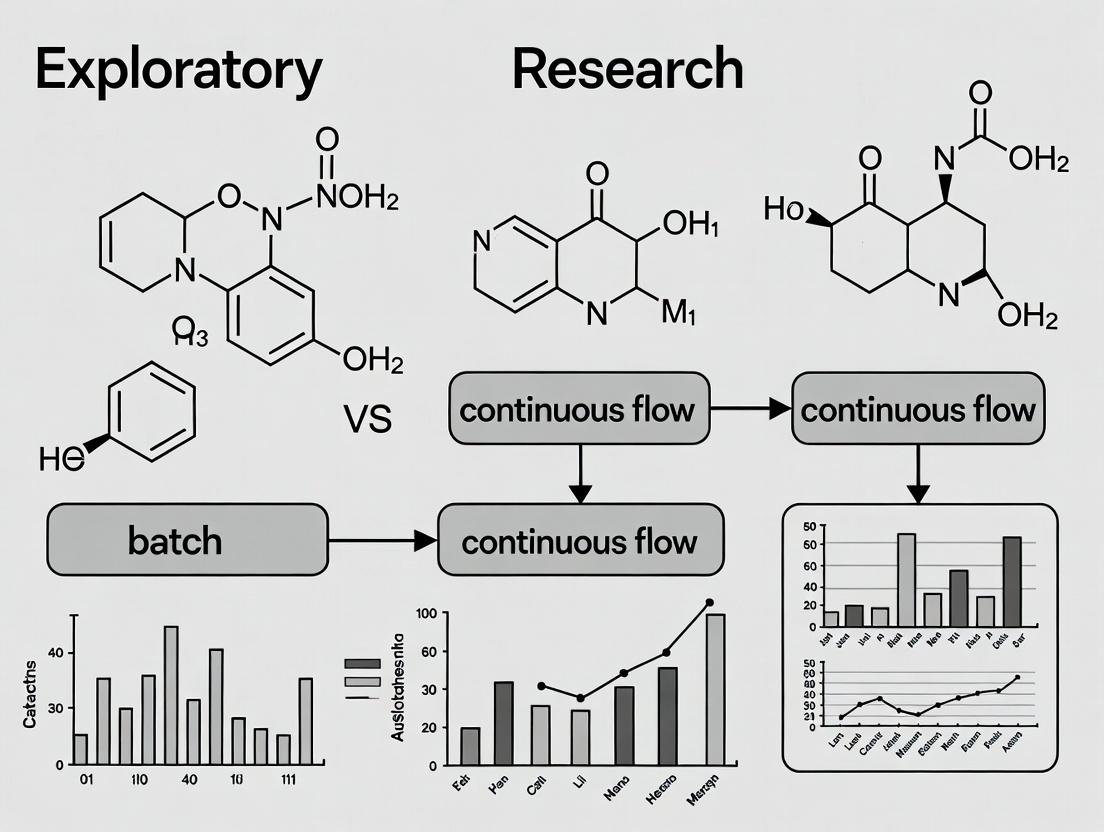
This article provides a comprehensive analysis of exploratory research methodologies in batch and continuous flow systems for drug development.
Batch vs Flow Chemistry: A Strategic Guide for Drug Development Research and Process Optimization
Abstract
This article provides a comprehensive analysis of exploratory research methodologies in batch and continuous flow systems for drug development. It covers foundational principles, application strategies in reaction scouting and process chemistry, practical troubleshooting, and rigorous comparative validation. Tailored for researchers and scientists, it synthesizes current trends and data to guide strategic platform selection and implementation for accelerated pharmaceutical R&D.
Understanding the Core Paradigms: When to Use Batch and Flow Chemistry in Early Discovery
This whitepaper provides an in-depth technical guide to the core definitions, historical evolution, and fundamental principles of batch and continuous flow systems. Framed within a broader thesis on exploratory research in chemical and pharmaceutical manufacturing, it delineates the operational, economic, and scientific distinctions between these paradigms. The content is tailored for researchers and drug development professionals, emphasizing current methodologies, quantitative comparisons, and experimental protocols.
Core Definitions and Foundational Principles
Batch Processing is a manufacturing technique where a finite quantity of output material (a batch) is produced by subjecting measured quantities of input materials to a defined sequence of processing activities over a finite period within a single contained vessel or workspace. The system is inherently transient, with composition and state variables changing over time.
Continuous Flow Processing is a manufacturing technique where input materials are fed into and output materials are simultaneously withdrawn from a system of interconnected operational units. The process operates at a steady state, with state variables constant at any given point in the system over time.
The historical context is defined by a shift from artisanal batch methods, dominant since pre-industrial times, to continuous paradigms spurred by the Industrial Revolution. Key milestones include the continuous distillation of shale oil (1850s), the Haber-Bosch process (1910s), and the advent of continuous pharmaceutical production with the FDA's PAT (Process Analytical Technology) initiative in the 21st century.
Quantitative Comparison of System Characteristics
Quantitative data summarizing key performance indicators and attributes are presented below.
Table 1: Comparative Performance Metrics for Batch vs. Continuous Flow Systems
| Metric | Batch Processing | Continuous Flow Processing | Notes / Source |
|---|---|---|---|
| Typical Campaign Duration | 2 days - 2 weeks | 2 weeks - 12+ months (continuous) | Campaign length varies by product. |
| Scale-up Factor (Lab to Plant) | 1,000 - 10,000x | ~1x (Numbering-up) | Flow uses parallel reactors, not larger ones. |
| Footprint (Relative Area) | 100% (Baseline) | 40-60% | Due to smaller, integrated equipment. |
| Typical Volumetric Productivity | 0.01 - 0.1 kg/L/h | 0.1 - 10 kg/L/h | Orders of magnitude higher for flow. |
| Mass & Heat Transfer Rates | Low | Very High | Enhanced by small diameters in flow reactors. |
| Solvent Usage (Relative) | 100% (Baseline) | 30-50% | Reduced holdup and integrated recovery. |
| Process Development Timeline | 24-36 months | 12-18 months | Accelerated by automation and modeling. |
| Overall Cost Reduction (Reported) | Baseline | 20-50% | Includes capex, opex, and material savings. |
Table 2: Applicability and Technical Feasibility
| Characteristic | Batch Reactor | Continuous Flow Reactor |
|---|---|---|
| Reaction Time Scale | Minutes to Days | Milliseconds to Hours |
| Exotherm Management | Challenging | Excellent |
| Handling of Solids | Straightforward | Challenging (clogging risk) |
| Multiphase Reactions | Good (with agitation) | Excellent (controlled mixing) |
| Process Flexibility | High (changeover easy) | Lower (dedicated lines) |
| Real-time Analytics (PAT) | Possible, but periodic | Inherent, always online |
| Safety Profile | Moderate (large inventory) | High (small inventory) |
Experimental Protocols for Comparative Research
To empirically compare these systems within an exploratory research framework, the following detailed protocols are prescribed.
Protocol: Direct Comparison of Reaction Yield and Selectivity
Objective: To compare the yield and product selectivity of a model reaction (e.g., a nucleophilic substitution) in batch and continuous flow modes under nominally identical conditions (temperature, molar ratio, concentration). Materials: Substrates, solvent, reagents, batch reactor (round-bottom flask with condenser), syringe pumps, tubular flow reactor (PFA coil), back-pressure regulator, in-line IR spectrometer, fraction collector. Method:
- Batch: Charge reactants and solvent into flask. Heat to setpoint with stirring. Monitor by offline sampling (TLC/HPLC). Quench after predetermined time.
- Flow: Load reactant solutions into separate syringe pumps. Connect via T-mixer to PFA coil reactor immersed in a heated oil bath. Set total flow rate to achieve desired residence time (Reactor Volume / Flow Rate). Use back-pressure regulator to prevent solvent vaporization. Collect steady-state output.
- Analysis: Quantify yield and byproducts for both outputs using calibrated HPLC.
Protocol: Characterization of Heat Transfer Dynamics
Objective: To measure temperature gradients during a highly exothermic reaction. Materials: Exothermic reaction reagents, batch reactor with internal temperature probe, multi-zone jacketed flow reactor with embedded thermocouples, data logger. Method:
- Batch: Initiate reaction in batch vessel. Record internal temperature at high frequency (10 Hz). Note maximum temperature (T_max) and time to reach it.
- Flow: Pump reagents through the temperature-controlled flow reactor. Record temperature at 3-5 points along the reactor length under steady-state conditions.
- Analysis: Compare temperature rise (ΔT) and spatial/temporal uniformity. Calculate heat removal efficiency.
Protocol: Residence Time Distribution (RTD) Analysis
Objective: To determine the degree of mixing and flow behavior (plug flow vs. mixed flow). Materials: Tracer dye (e.g., inert, detectable), UV-Vis flow cell or in-line spectrometer, data acquisition software. Method:
- System Calibration: Establish baseline flow with solvent.
- Tracer Injection: Introduce a sharp pulse of tracer at the reactor inlet.
- Detection: Measure tracer concentration (C) at the outlet over time (t).
- Analysis: Plot C(t) vs. t. Calculate mean residence time (τ) and variance (σ²). A narrow, symmetric distribution indicates plug flow behavior (ideal for continuous flow), while a broad, tailing distribution indicates significant axial dispersion or mixing.
Visualization of System Architectures and Workflows
Diagram 1: High-Level Process Workflow Comparison
Title: Batch vs. Continuous Process Flow Diagram
Diagram 2: Typical Laboratory Continuous Flow Setup
Title: Lab-Scale Continuous Flow System Schematic
The Scientist's Toolkit: Essential Research Reagent Solutions
Table 3: Key Reagents and Materials for Flow Chemistry Research
| Item | Function & Application in Research | Key Consideration |
|---|---|---|
| Perfluoroalkoxy (PFA) Tubing | Inert, transparent reactor coil for organic synthesis. Allows visual monitoring. | Chemical compatibility, pressure/temperature rating, inner diameter controls residence time. |
| Microfluidic Chip Reactors | Silicon/glass chips with etched channels for ultra-fast, highly controlled reactions. | Excellent for rapid screening and photochemistry. Prone to clogging with solids. |
| Syringe Pumps (Multi-channel) | Provide precise, pulseless delivery of reagents at μL/min to mL/min flow rates. | Accuracy, pulsation, chemical compatibility of fluid paths, and ability to handle suspensions. |
| Diaphragm or HPLC Pumps | For higher pressure (>100 bar) and longer-term continuous feeding from bulk reservoirs. | Pulse dampening required. Suitable for scale-up and process intensification studies. |
| Static Mixer Elements | Engineered internals (e.g., Kenics) ensuring rapid radial mixing within a flow stream. | Essential for fast, homogeneous mixing prior to reactions. |
| Back-Pressure Regulator (BPR) | Maintains system pressure to prevent degassing and control boiling points of solvents. | Set pressure range, diaphragm material compatibility, and response time. |
| In-line IR/UV Analyzer | Real-time monitoring of reaction conversion and intermediate formation (PAT). | Flow cell volume (should be small to avoid lag), spectral range, and data integration software. |
| Solid-Supported Reagents/Catalysts | Packed-bed columns integrated into flow streams for purification or catalysis. | Particle size (to avoid high backpressure), stability under flow, and loading capacity. |
| Gas-Liquid Flow Contactor (e.g., T-piece) | Enables safe and efficient introduction of gases (H₂, O₂, CO) into liquid streams. | Gas solubility, mass transfer efficiency, and safety controls for explosive mixtures. |
| Automated Sampling/Fraction Collector | Collects time- or volume-based samples of reactor effluent for offline analysis. | Critical for Residence Time Distribution (RTD) studies and reaction optimization. |
Within the paradigm of modern process chemistry, exploratory research aims to rapidly identify the optimal synthetic route for a target molecule. A fundamental decision at this stage is the selection of reaction platform: traditional batch or continuous flow systems. This choice is not arbitrary but is governed by four interdependent key drivers: Volume, Time, Safety, and Molecular Complexity. This guide provides a technical framework for researchers and development professionals to evaluate these drivers quantitatively, facilitating data-driven platform selection during early-phase investigational drug development.
Quantitative Driver Analysis and Platform Implications
The decision matrix between batch and flow is multi-factorial. The following tables synthesize current data from recent literature and industrial case studies (2023-2024).
Table 1: Platform Selection Drivers and Quantitative Benchmarks
| Driver | Metric | Batch System Typical Range | Continuous Flow System Typical Range | Implication for Flow Advantage |
|---|---|---|---|---|
| Volume | Optimal Scale for Development | 1 mL - 100 L | 10 µL - 100 mL/day | Flow enables extreme miniaturization and efficient material use in exploration. |
| Time | Reaction Kinetics (t1/2) | Seconds to Days | Milliseconds to Minutes (< 10 min optimal) | Flow excels for fast, exothermic reactions; batch preferred for very slow reactions. |
| Safety | Reaction Exothermicity (ΔH) | Low to Moderate | High (managed via micro-mixing & heat transfer) | Flow's high surface-area-to-volume ratio safely handles highly exothermic transformations. |
| Molecular Complexity | Number of Synthetic Steps | High (convergent routes) | Moderate (linear or modular routes) | Flow favors linear sequences with inline workup; batch retains edge for complex, multi-step convergent synthesis. |
Table 2: Platform Suitability Scoring Based on Driver Profile
| Driver Profile | Recommended Platform | Key Rationale | Typical API Phase |
|---|---|---|---|
| Low Volume (<10 mg), Fast Kinetics, High Hazard | Continuous Flow | Safety & material efficiency in route scouting. | Discovery / Pre-clinical |
| High Volume (>1 kg), Slow Kinetics, Low Hazard | Batch | Proven scale-up, minimal technical risk. | Commercial |
| Moderate Volume, Thermally Sensitive, Multi-step | Hybrid (Flow-Batch) | Use flow for critical steps (e.g., nitration, lithiation), batch for others. | Phase I/II |
Experimental Protocols for Platform Evaluation
To generate the data required for the above analysis, standardized experimental protocols are essential.
Protocol 1: Kinetic Profiling for Platform Suitability
- Objective: Determine the intrinsic reaction rate to assess suitability for flow.
- Materials: Automated syringe pump system, inline IR or UV-Vis flow cell, temperature-controlled microreactor chip (e.g., glass or stainless steel), back-pressure regulator.
- Methodology:
- Prepare reagent solutions at precise concentrations.
- Using syringe pumps, mix reagents at a T-junction and immediately direct the mixture through a temperature-controlled reactor loop.
- Vary the total flow rate to modulate residence time (τ) from 0.1 to 600 seconds.
- Use inline analytics to measure conversion at each residence time.
- Plot conversion vs. τ. Reactions reaching >90% conversion in under 10 minutes are prime flow candidates.
Protocol 2: Exothermic Hazard Assessment in Batch vs. Flow
- Objective: Quantify heat release and compare temperature control in both platforms.
- Materials: Batch: RC1e calorimeter. Flow: Flow calorimeter (e.g., Chemtrix Plantrix) with integrated temperature sensors.
- Methodology:
- Batch: Conduct the reaction in the RC1e, recording adiabatic temperature rise (ΔTad) and time to maximum rate (TMR).
- Flow: Pump reagents through the flow calorimeter at varying rates. Measure steady-state temperature profile along the reactor channel.
- Analysis: Calculate heat flux (W/mL reactor volume). Flow systems typically dissipate heat 2-3 orders of magnitude faster than batch, allowing safe operation in more explosive regimes.
Visualizing the Decision Logic and Workflow
The following diagrams, generated using DOT language, illustrate the core decision pathways and experimental setups.
Title: Decision Logic for Batch vs. Flow Selection
Title: Continuous Flow Screening Platform Setup
The Scientist's Toolkit: Essential Research Reagent Solutions
Table 3: Key Materials for Platform Selection Experiments
| Item / Reagent Solution | Function in Experiment | Example Vendor/Product |
|---|---|---|
| Silicon-based Microreactor Chips | Provide excellent heat transfer and chemical resistance for rapid screening of hazardous reactions. | Chemtrix (Labtrix, Plantrix) |
| PFA or PTFE Tubing (0.5-1.0 mm ID) | Inert fluidic connections for constructing modular flow setups. | IDEX Health & Science |
| Automated Syringe Pump Modules | Provide precise, pulseless delivery of reagents at µL/min to mL/min flow rates. | Cetoni (neMESYS) |
| In-line Fourier Transform Infrared (FTIR) Flow Cell | Real-time monitoring of reaction conversion and intermediate detection. | Mettler Toledo (ReactIR) with flow cell |
| Solid-Supported Reagents & Scavengers | Enable inline purification in flow, simplifying workup and driving linear complexity. | Biotage (SiliaCat, Snap) cartridges |
| Back-Pressure Regulators (BPR) | Maintain liquid phase for reactions above solvent boiling point by applying constant pressure. | Zaiput Flow Technologies |
| Reaction Calorimeter (Batch) | Quantify heat flow and accumulation potential in traditional batch mode. | Mettler Toledo (RC1e) |
| Flow Chemistry Process Development Kits | Integrated kits containing reactors, mixers, and fittings for fast prototyping. | Corning (Advanced-Flow Reactor G1 Kit) |
The Role of Exploratory Research in De-risking Synthetic Routes
Exploratory research serves as the critical, pre-development phase where synthetic route candidates are generated, evaluated, and de-risked. Within the broader thesis of pharmaceutical process research, a fundamental dichotomy exists between traditional batch processing and emerging continuous flow systems. The choice between these paradigms significantly influences the objectives and execution of exploratory research. Batch systems, characterized by discrete unit operations, offer simplicity and flexibility for rapid route scouting. In contrast, continuous flow systems, with their enhanced heat and mass transfer, precise residence time control, and inherent safety for hazardous chemistries, demand a distinct exploratory approach focused on parameter space mapping and system stability. This guide details how targeted exploratory research is employed to identify and mitigate risks—such as impurity formation, scalability limitations, and safety hazards—early in the development lifecycle, thereby informing the strategic selection of batch or continuous production modes.
Core Risk Factors in Synthetic Route Development
Exploratory research systematically addresses key risk factors that can derail later-stage development. Quantitative data from recent studies (2023-2024) highlight common challenges.
Table 1: Prevalence and Impact of Key Synthetic Route Risks
| Risk Factor | Prevalence in Early Routes (%) | Primary Impact Area | Typical Exploratory Mitigation Tactic |
|---|---|---|---|
| Genotoxic Impurity (GTI) Formation | ~35% | Safety & Regulatory | Identification of structural alerts; forced degradation studies; alternative reagent/scaffold screening. |
| Poor Scalability of Critical Steps | ~45% | Cost & Robustness | Reaction calorimetry; mixing sensitivity studies; particle engineering. |
| Unstable Intermediates | ~25% | Yield & Robustness | Low-temperature spectroscopy (in-situ FTIR, NMR); stabilization screening (solvents, additives). |
| High-Potency Compound Handling | ~30% | Operator Safety | Containment strategies; in-situ quenching studies; continuous flow microreactor evaluation. |
| Catalyst Deactivation/Leaching | ~20% (Metal-catalyzed) | Cost & Yield | Catalyst loading/screening DOE; analysis of reaction profile for decline; metal trapping studies. |
Exploratory Methodologies for Risk Assessment
Protocol: High-Throughput Reaction Screening and Analysis
Objective: Rapidly assess multiple route variants, reagents, and conditions to identify leads with minimal impurity burden.
- Setup: Utilize automated liquid handling platforms in an inert atmosphere glovebox.
- Reaction Array: Design a matrix varying solvent (e.g., 6 types), base (e.g., 4 types), and temperature (e.g., 3 levels) for a key transformation.
- Execution: Conduct reactions in 0.5-2 mL scale in microtiter plates.
- Quenching & Dilution: Automatically quench using a standard protocol and dilute for analysis.
- Analysis: Employ UPLC-MS with rapid gradients (<3 min). Use UV (210-254 nm) and MS detection for conversion, yield (via internal standard), and impurity identification.
- Data Processing: Software-aided peak integration and analysis to rank conditions by key metrics (yield, purity, simplicity).
Protocol: Reaction Calorimetry in Miniaturized Format (RC1e/Microreactor)
Objective: Quantify heat flow and accumulation to assess thermal risks and scalability.
- Setup: Load reagents into syringe pumps for controlled addition to a 10-100 mL reactor equipped with precise temperature control and heat flow sensor.
- Isothermal Experiment: Maintain target temperature. Start addition of key reagent (e.g., limiting agent, initiator).
- Data Collection: Continuously record temperature, heat flow (W), and cumulative heat (J).
- Analysis: Calculate adiabatic temperature rise (ΔTad), Maximum Temperature of the Synthesis Reaction (MTSR), and time to maximum rate (TMR). Compare to safety thresholds.
- Modeling: Use data to model heat removal requirements for scale-up in both batch and continuous (flow calorimetry) systems.
Protocol: In-situ Fourier Transform Infrared (FTIR) Spectroscopy for Intermediate Stability
Objective: Monitor the formation and decay of unstable intermediates in real-time.
- Setup: Equip a jacketed reaction vessel with a diamond-tip ATR (Attenuated Total Reflection) FTIR probe connected to a real-time spectrometer.
- Background Collection: Collect spectrum of starting materials in solvent at reaction temperature.
- Reaction Initiation: Add reagent or begin heating. Start continuous spectral collection (e.g., every 30 seconds).
- Spectral Analysis: Track characteristic vibrational peaks for starting material, intermediate, and product.
- Kinetics Modeling: Apply multivariate analysis or peak height tracking to generate concentration-time profiles, identifying the stability window for the intermediate.
Protocol: Continuous Flow Exploratory Parameter Mapping
Objective: Define the stable operating space for a transformation in a flow system.
- System Assembly: Construct a flow system comprising HPLC pumps, a temperature-controlled microreactor (e.g., chip, tubular), and a back-pressure regulator.
- DOE Design: Create a Design of Experiment (DOE) plan varying residence time (flow rate), temperature, and stoichiometry.
- Automated Operation: Use automated controllers to step through DOE conditions, allowing adequate time for equilibration at each point.
- Sampling: Collect steady-state effluent for offline analysis (UPLC, NMR).
- Response Surface Modeling: Plot responses (yield, selectivity) against parameters to identify a robust "sweet spot" for continuous operation.
The Scientist's Toolkit: Key Research Reagent Solutions
Table 2: Essential Materials for Exploratory Route De-risking
| Item | Function in Exploratory Research |
|---|---|
| Automated Synthesis/Screening Platform (e.g., Chemspeed, Unchained Labs) | Enables high-throughput, reproducible experimentation across hundreds of conditions for rapid route/condition scouting. |
| In-situ Analytical Probes (ReactIR, ReactRaman, ParticleTrack) | Provides real-time kinetic and mechanistic data without sampling, crucial for identifying unstable species and understanding reaction pathways. |
| Microscale Calorimeter (RC1e, Simular) | Measures heat flow and accumulation at small scale to predict thermal hazards and mixing limitations for scale-up. |
| Continuous Flow Microreactor Kit (Chemtrix, Vapourtec, Syrris) | Allows safe exploration of hazardous chemistries (azides, nitrations) and precise parameter mapping for continuous processing. |
| Advanced Catalyst Libraries (e.g., diverse ligand sets, immobilized metals) | Facilitates rapid screening for improved selectivity and activity while assessing risks of metal leaching. |
| Forced Degradation Reagents (Peroxide, Acid/Base, Light chambers) | Systematically stresses drug substance to reveal potential degradation pathways and impurity formation risks. |
Decision Framework: Informing Batch vs. Continuous Flow Development
The data gathered from exploratory research feeds into a structured decision logic to recommend a production mode.
Diagram Title: Decision Logic for Process Mode Selection
Experimental Workflow for Comprehensive Route De-risking
The integration of various exploratory techniques follows a systematic workflow.
Diagram Title: Exploratory Research De-risking Workflow
Exploratory research is the indispensable foundation for de-risking synthetic routes, transforming empirical art into predictive science. By systematically applying high-throughput screening, real-time analytics, and calorimetric safety assessment, researchers can identify critical vulnerabilities in a synthesis path long before scale-up. This knowledge directly informs the strategic choice between batch and continuous flow processing, guiding development toward the safest, most robust, and most economical manufacturing process. As the industry moves towards more complex molecules and sustainable manufacturing, the role of rigorous, data-rich exploratory research will only become more central to successful drug development.
Advantages of Flow Chemistry for High-Pressure, High-Temperature, and Hazardous Intermediates
Exploratory research in chemical synthesis has historically been dominated by batch methodologies. While suitable for early-stage discovery, batch reactors present significant limitations when scaling processes involving extreme conditions or unstable species. The broader thesis of batch versus continuous flow systems research posits that flow chemistry represents a paradigm shift, not merely an incremental improvement. This technical guide examines how the intrinsic advantages of continuous flow systems—enhanced heat/mass transfer, precise residence time control, and small reactor volumes—directly address the formidable challenges of high-pressure (HP), high-temperature (HT), and hazardous intermediate synthesis. The transition from batch to flow is particularly transformative in this domain, enabling safer, more efficient, and more reproducible exploratory research and development.
Core Technical Advantages and Quantitative Comparisons
The fundamental engineering principles of flow chemistry confer distinct benefits for challenging syntheses. The following table summarizes key quantitative advantages derived from recent literature and experimental studies.
Table 1: Quantitative Comparison of Batch vs. Flow for HP/HT/Hazardous Chemistry
| Parameter | Batch Reactor (Conventional) | Continuous Flow Reactor | Technical Implication for HP/HT/Hazardous Chemistry |
|---|---|---|---|
| Pressure Handling | Limited by vessel integrity; large volume under pressure. | Easily achieved with small-diameter tubing and back-pressure regulators (BPR). Typical operational range: 1-200 bar. | Enables use of supercritical fluids (e.g., scCO₂) and suppresses boiling of solvents at high temperatures. |
| Heat Transfer | Poor due to low surface area-to-volume ratio. Heating/cooling rates are slow. | Excellent due to high surface area-to-volume ratio. Heating/cooling is near-instantaneous. | Prevents thermal runaway with exothermic reactions; enables precise, rapid heating to HT (often 300-400°C). |
| Reaction Volume | Large (mL to L scale). | Extremely small (µL to mL scale in the active zone). | Inherent safety: Minimal inventory of hazardous material at any given time. |
| Residence Time Control | Poor; determined by slow heating/cooling cycles. | Precise (seconds to minutes) via pump flow rate and reactor volume. | Allows precise "quenching" of reactive intermediates by rapid mixing with a second stream, preventing decomposition. |
| Mixing Efficiency | Scale-dependent; inefficient at lab scale without specialized equipment. | Highly efficient, diffusion-limited mixing at T-junctions or micromixers. | Ensures uniform reaction conditions critical for fast, highly exothermic reactions or gas-liquid transformations. |
| Reproducibility & Screening | Low; variations between runs due to scaling factors. | High; parameters (T, P, t) are precisely controlled and easily varied for rapid optimization. | Accelerates exploratory research for HT/HP reactions via automated, high-throughput experimentation platforms. |
Detailed Experimental Protocols for Key Transformations
The following protocols exemplify the application of flow chemistry to demanding synthetic challenges.
Protocol 1: High-Temperature Methylation using Supercritical Methanol
- Objective: Perform O-methylation of a sensitive phenol using supercritical methanol (scMeOH, Tc = 239°C, Pc = 80.9 bar).
- Reagents: Phenol substrate (0.1 M in anhydrous DMSO), Potassium carbonate (powder, packed bed), Anhydrous Methanol.
- Setup:
- A high-pressure HPLC pump delivers the substrate solution.
- A second pump delivers anhydrous methanol.
- Streams are combined via a high-pressure T-mixer and passed through a 10 mL tubular reactor (coiled stainless steel, 1/16" OD).
- The reactor is housed inside a gas chromatograph (GC) oven set at 260°C.
- A back-pressure regulator (BPR) downstream maintains system pressure at 100 bar.
- The output passes through a heat exchanger and into a cooled collection vial.
- Procedure: Set BPR to 100 bar. Start methanol flow (0.5 mL/min) and heat oven to 260°C. Once stable, start substrate flow (0.5 mL/min). Collect effluent after 10 min (10 min residence time). Analyze by LC-MS. The small volume and contained pressure make this severe condition practical and safe.
Protocol 2: Safe Generation and Consumption of an Azide Intermediate
- Objective: Generate hydrazoic acid (HN₃) in situ and react it in a [3+2] cycloaddition without isolating the explosive intermediate.
- Reagents: Stream A: Sodium azide (1.0 M in water), Stream B: Dilute HCl (1.05 M in water), Stream C: Alkyne substrate (0.2 M in tert-butanol).
- Setup:
- Use three syringe pumps.
- Stream A and B are combined in a PFA T-mixer (Mixer 1) to generate HN₃ in situ.
- The combined stream immediately meets Stream C in a second T-mixer (Mixer 2).
- The mixture flows through a 5 mL PFA coil reactor at 90°C (residence time: 5 min).
- The output flows directly into a quench solution (sodium ascorbate).
- Procedure: Start all pumps simultaneously. The total volume of potentially explosive HN₃ in the system is kept below 100 µL at any moment, mitigating risk. The immediate consumption by the alkyne in Mixer 2 further reduces hazard.
Visualization of Workflows and Concepts
Diagram 1: Generic Flow System for Hazardous Intermediates (76 chars)
Diagram 2: Safety Logic: Batch Hazard vs. Flow Control (68 chars)
The Scientist's Toolkit: Essential Research Reagent Solutions
Table 2: Key Materials and Equipment for HP/HT Flow Chemistry
| Item | Function & Rationale |
|---|---|
| Back-Pressure Regulator (BPR) | Maintains consistent system pressure above the solvent boiling point, enabling high-temperature reactions in liquid phase. Critical for using supercritical fluids. |
| High-Pressure Syringe or HPLC Pumps | Provide precise, pulse-free delivery of reagents against significant back-pressure (up to 200-300 bar). |
| PFA or Stainless Steel Tubing/Reactors | PFA: Chemically inert for most applications. Stainless Steel: Required for very high pressure/temperature or specific solvents. |
| In-line Micro-Mixer (T-type, Y-type) | Ensures rapid, efficient mixing of streams before entering the reaction coil, critical for fast reactions and in situ quenching. |
| Solid-Supported Reagents/Catalysts | Packed bed columns can be integrated into flow systems to introduce reagents, scavenge impurities, or catalyze reactions without contaminating the product stream. |
| In-line IR or UV-Vis Spectrometer | Provides real-time reaction monitoring, allowing for immediate adjustment of parameters and detection of unstable intermediates. |
| Heat Exchanger (Cooling Loop) | Rapidly quenches the reaction effluent immediately after the reactor, stabilizing products and preventing decomposition. |
| Dedicated Pressure-Rated Connectors & Fittings | Ensure leak-free connections at high pressure. Using inappropriate fittings is a major failure point. |
The debate between batch and continuous flow systems is central to modern process research, particularly in pharmaceutical development. This whitepaper focuses on the enduring role of batch reactors within this paradigm. While continuous flow offers advantages in mass and heat transfer for specific, optimized reactions, the batch reactor remains indispensable during exploratory research phases. Its strengths—operational simplicity, deep-seated familiarity across scientific disciplines, and unmatched flexibility in handling intricate, multi-step synthetic sequences—make it the cornerstone of early-stage molecule discovery, route scouting, and process understanding.
Core Strengths: A Quantitative & Qualitative Analysis
Simplicity and Low-Capital Entry
The mechanical and operational simplicity of batch reactors lowers the barrier to experimentation. This is critical for exploratory work where reaction parameters are unknown.
Table 1: Comparative Initial Setup Complexity & Cost (Exploratory Phase)
| Parameter | Standard Laboratory Batch Reactor (100 mL - 1 L) | Modular Continuous Flow System (Exploratory Scale) |
|---|---|---|
| Typical Capital Cost | $5,000 - $20,000 | $25,000 - $100,000+ |
| Setup Time (per new condition) | Minutes to Hours | Hours to Days (re-tubing, re-configuration) |
| Hardware Components | Vessel, headplate, agitator, heating/cooling jacket, condenser | Pumps, chip/tubing reactor, temperature units, back-pressure regulator, in-line analytics |
| Skill Threshold for Operation | Low (standard glassware skills) | Moderate to High (fluid dynamics, pressure management) |
Familiarity and Established Knowledge Base
Decades of use have created a vast, predictable knowledge ecosystem. Scientists can leverage extensive published protocols, safety data, and scaling heuristics (e.g., heat transfer correlations, nucleation models) that are reaction-class specific, reducing cognitive load during early research.
Handling Complex Multi-step Sequences
This is the batch reactor's most significant strength in exploratory research. Multi-step sequences often involve changes in physical state (solid addition, crystallization), significant changes in viscosity, or the use of heterogeneous reagents/catalysts.
Table 2: Batch Reactor Capability in Multi-step Sequences
| Process Challenge | Batch Reactor Handling | Implication for Exploratory Research |
|---|---|---|
| Solid Additions | Trivial (via charge pot or direct addition) | Enables staged reagent addition, catalyst charging, sampling of solids. |
| Intermediate Isolation | Straightforward (crystallize, filter in-situ or transfer) | Allows for purification between steps, critical for assessing individual step yields and purities. |
| Solvent Swap | Standard operation (distill, then add new solvent) | Essential for reactions requiring different solvent polarities in subsequent steps. |
| Handling Heterogeneous Slurries | Robust with adequate agitation | Supports reactions with insoluble reagents, polymers, or biocatalysts. |
| "Cook-and-Look" | Simple sampling via dip tube or valve | Facilitates rapid TLC, HPLC, or pH monitoring without disrupting flow. |
Experimental Protocols for Exploratory Research in Batch
General Protocol for Reaction Scouting and Optimization in Batch
Objective: To identify feasible reaction conditions and define a preliminary design space for a novel chemical transformation. Materials: See "The Scientist's Toolkit" below. Methodology:
- Setup: Assemble the glassware (round-bottom flask, condenser, agitator) under an inert atmosphere (N₂/Ar) if required. Charge the solvent and primary starting material.
- Condition Screening: Prepare a matrix of variables (e.g., temperature: 25°C, 50°C, 80°C; reagent stoichiometry: 1.0, 1.5, 2.0 eq; catalyst loading: 0, 1, 5 mol%). Use separate vessels for discrete condition testing (parallel experimentation) or a single vessel with sequential condition testing after analysis.
- Reaction Initiation: Bring the mixture to target temperature. Add reagent/catalyst solution via syringe pump or quickly to start all reactions simultaneously in a parallel setup.
- In-Process Monitoring: At predetermined time intervals (t=5, 15, 30, 60, 120 min), withdraw small aliquots (~0.1 mL). Quench if necessary and dilute for analysis (HPLC, GC, NMR).
- Workup & Analysis: After completion, cool the reaction. Perform a standard aqueous workup (if applicable) or direct purification. Isolate and characterize the product. Calculate conversion, yield, and selectivity.
- Data Synthesis: Plot yield/time profiles for each condition to determine kinetics and optimal parameters.
Protocol for a Representative Complex Multi-step Sequence: A Telescoped Synthesis
Objective: To execute a 3-step sequence (coupling, deprotection, cyclization) without isolating the intermediates, demonstrating batch flexibility. Workflow Diagram Title: Multi-step Telescoped Synthesis Workflow in Batch
Methodology:
- Step 1 Execution: Conduct the initial coupling reaction in the batch reactor following a scouted protocol. Monitor by HPLC until starting material is consumed.
- In-situ Workup: Without transferring, cool the reaction. Add water and a workup solvent (e.g., ethyl acetate). Separate the aqueous layer via a bottom drain valve or cannula transfer. Wash the organic layer (in the reactor) with brine.
- Solvent Adjustment: Distill the organic layer under reduced pressure to a minimum volume. Add the solvent required for Step 2.
- Step 2 Execution: Charge the deprotection reagent directly to the reactor. Monitor by HPLC/MS for complete consumption of the intermediate.
- Step 3 Execution: Upon confirmation, adjust temperature and charge the cyclization reagent directly. Monitor to completion.
- Final Isolation: Conduct a final workup or directly add an anti-solvent to crystallize the final product. Filter and dry.
The Scientist's Toolkit: Key Research Reagent Solutions
Table 3: Essential Materials for Exploratory Batch Reactor Experiments
| Item | Function in Exploratory Research | Example/Note |
|---|---|---|
| Jacketed Lab Reactors | Provides precise temperature control via external circulators for kinetic studies. | Glass vessels (100 mL - 2 L) with PTFE or glass-coated stirrers. |
| Reaction Block (Parallel) | Enables high-throughput condition scouting with minimal reagent use. | 6- or 24-position block with individual stirring/temperature control. |
| Automated Lab Reactors | Enables unattended execution of pre-programmed sequences (additions, temp ramps). | Critical for collecting reproducible kinetic data and safety calorimetry. |
| In-situ Analytical Probes | Provides real-time data for reaction understanding and endpoint determination. | FTIR, Raman, or Particle Size Analyzer probes mounted through reactor headplate. |
| Catalyst Libraries | Pre-weighed, screened quantities of diverse catalysts (e.g., Pd, Ru, organocatalysts). | Accelerates screening for novel transformations. |
| Air-free Transfer Equipment | Ensures integrity of air- and moisture-sensitive reactions. | Schlenk lines, cannulas, septa, glove boxes. |
| Dedicated Workup & Purification Station | Streamlines isolation and analysis post-reaction. | Includes rotary evaporator, chromatographic systems (flash, prep-HPLC), and lyophilizer. |
Within the thesis of batch vs. continuous flow research, the batch reactor is not an obsolete technology but a fundamental research tool. Its simplicity allows for rapid hypothesis testing. Its familiarity provides a reliable foundation for comparing novel results against established literature. Most critically, its flexibility in managing the "messy," discontinuous, and unpredictable nature of early multi-step synthesis is unparalleled. Continuous flow systems excel as a downstream development tool for defined, optimized steps. However, the exploratory research that defines those steps will continue to rely on the versatile, forgiving, and information-rich environment of the batch reactor.
From Milligram to Kilogram: Implementing Flow and Batch Methods in Reaction Scouting and Scale-Up
Design of Experiment (DoE) Approaches for Rapid Reaction Optimization in Both Systems
Within the broader thesis on Exploratory Research in Batch vs. Continuous Flow Systems, this whitepaper addresses a central methodological pillar: the systematic optimization of chemical reactions. While the physical architectures of batch and flow reactors differ profoundly—with implications for heat/mass transfer, mixing, safety, and scalability—the statistical framework of Design of Experiments (DoE) provides a unified, efficient strategy for rapid optimization in both regimes. This guide details how DoE methodologies are adapted and applied to accelerate development across these divergent platforms.
Core DoE Principles for Reaction Optimization
DoE moves beyond inefficient one-factor-at-a-time (OFAT) experimentation. It involves the structured variation of multiple input factors (e.g., temperature, concentration, residence time) simultaneously to model their effects on critical responses (e.g., yield, selectivity, purity). Key designs for rapid optimization include:
- Screening Designs (e.g., Fractional Factorial, Plackett-Burman): Identify the most influential factors from a large set.
- Response Surface Methodology (RSM) Designs (e.g., Central Composite, Box-Behnken): Model curvature and locate optimal conditions.
- Optimal Designs (e.g., D-Optimal): Ideal for constrained experimental spaces common in process chemistry.
DoE Application: Batch vs. Continuous Flow Systems
The choice of reactor system dictates which factors are most relevant and how experiments are structured.
| Aspect | Batch Reactor DoE Focus | Continuous Flow Reactor DoE Focus |
|---|---|---|
| Key Factors | Temperature, time, stoichiometry, catalyst loading, agitation speed. | Temperature, residence time, flow rates, pressure, reactor volume. |
| Experimental Unit | A single vessel; one run yields one data point. | A steady-state condition; sampling after stabilization yields one data point. |
| Primary Advantage | Simple parallelization for high-throughput screening. | Precise control over factors like residence time; easier gradient studies. |
| Main Challenge | Scale-up effects (mixing, heat transfer) not captured in small-scale DoE. | Longer stabilization time per condition; potential for carryover. |
| Typical DoE Sequence | 1. Screening in parallel vials/plates → 2. RSM in jacketed lab reactors. | 1. Screening via pump flow rate gradients → 2. RSM with integrated reactor modules. |
The following table summarizes hypothetical but representative data from a model C-N cross-coupling reaction optimized separately in batch and flow via a Central Composite RSM design. The response is isolated yield (%).
| Run Order | System | Factor A: Temp (°C) | Factor B: Time (min) / Res. Time (min) | Factor C: Equiv. of Reagent | Response: Yield (%) |
|---|---|---|---|---|---|
| 1 | Batch | 80 | 30 | 1.2 | 78 |
| 2 | Batch | 100 | 120 | 1.2 | 92 |
| 3 | Batch | 80 | 120 | 1.8 | 85 |
| 4 | Flow | 100 | 10 | 1.2 | 90 |
| 5 | Flow | 140 | 10 | 1.8 | 88 |
| 6 | Flow | 120 | 5 | 1.5 | 82 |
| Predicted Optimum | Batch | 108 | 110 | 1.3 | 94 (Predicted) |
| Predicted Optimum | Flow | 115 | 12 | 1.4 | 93 (Predicted) |
| Validation Result | Batch | 110 | 110 | 1.3 | 92 (Actual) |
| Validation Result | Flow | 115 | 12 | 1.4 | 91 (Actual) |
Detailed Experimental Protocols
Protocol 1: High-Throughput Batch Screening DoE (in a Carousel Reactor)
- Design Setup: Generate a 12-run Plackett-Burman screening design matrix for 5 factors (temperature, reaction time, catalyst mol%, base equiv., solvent volume) using statistical software (e.g., JMP, Design-Expert).
- Reagent Dispensing: Using an automated liquid handler, dispense substrates, catalyst, and base solutions into 12 separate 10-mL microwave vials equipped with magnetic stir bars.
- Reaction Execution: Seal vials and load them into a pre-heated carousel reactor (e.g., Biotage Initiator+ or similar). Execute the reactions according to the design matrix parameters.
- Quenching & Analysis: After the prescribed time, automatically cool the carousel to 25°C. Use an autosampler to inject reaction mixtures directly into a UPLC for yield analysis.
- Data Analysis: Fit a linear model to identify statistically significant (p < 0.05) factors for further, more detailed optimization.
Protocol 2: Steady-State RSM DoE in Continuous Flow
- Design Setup: Generate a 20-run D-Optimal RSM design for 3 critical factors (temperature, residence time (τ), and stoichiometry) identified from prior screening.
- System Priming: Assemble a flow system with two syringe pumps (for reactant streams), a T-mixer, a temperature-controlled coil reactor (e.g., Vapourtec R Series coil), and a back-pressure regulator.
- Steady-State Achievement: For each design point, set the pump flow rates to achieve the desired τ (τ = reactor volume / total flow rate). Set the reactor thermostat. Allow the system to run for at least 5τ to reach steady state.
- Sampling: After stabilization, collect the effluent for 2τ into a collection vial containing a quenching agent (e.g., aqueous buffer).
- Analysis & Modeling: Analyze all samples via UPLC. Use the response data to fit a quadratic polynomial model and generate 3D surface plots to predict the optimum.
Visualization: DoE Workflow for Reaction Optimization
Title: DoE Workflow for Batch and Flow Optimization
The Scientist's Toolkit: Key Research Reagent Solutions
| Item / Reagent | Function in DoE for Optimization |
|---|---|
| Automated Liquid Handler (e.g., Chemspeed, Hamilton) | Enables precise, high-throughput dispensing of reagents for parallel batch screening DoE, ensuring reproducibility. |
| Modular Flow Chemistry System (e.g., Vapourtec, Syrris) | Provides integrated pumps, heaters, and mixers to systematically explore flow DoE parameters with precise control. |
| Chemical Reaction Database & Software (e.g., Reaxys, SciFinder) | Informs initial factor selection and safe operating ranges based on prior art. |
| DoE Statistical Software (e.g., JMP, Design-Expert, MODDE) | Crucial for generating design matrices, randomizing run orders, and performing statistical analysis/modeling of results. |
| In-line/On-line Analytics (e.g., FTIR, UV) | Provides real-time reaction monitoring for flow DoE, enabling rapid data collection at steady state. |
| High-Pressure Syringe Pumps (e.g., Harvard Apparatus) | Delivers precise, pulseless flows for accurate residence time control in flow reactor DoE. |
| Quenching Agent Solutions (e.g., Silica cartridges, aqueous buffers) | Rapidly stops reactions at precise times for accurate offline analysis, critical for both batch and flow sampling. |
This guide details the core equipment and methodologies for laboratory-scale flow chemistry, framed within a broader thesis on exploratory research in batch versus continuous flow systems. Continuous flow systems offer superior heat/mass transfer, reproducibility, safety, and automation potential compared to traditional batch processes, making them essential for modern process chemistry and drug development.
Pumps: The Heart of the System
Pumps deliver precise, pulse-free flow of reagents and are critical for system stability.
Key Pump Technologies
- Syringe Pumps: Deliver precise, pulse-free flow using one or more motor-driven syringes. Ideal for low-flow rates (µL/min to mL/min) and handling viscous fluids or gases.
- High-Pressure Liquid Chromatography (HPLC) Pumps: Provide constant pressure or flow against high backpressure. Suitable for mL/min to L/min flows and systems with packed-bed reactors.
- Peristaltic Pumps: Use rotating rollers to compress tubing, pushing fluid forward. Best for moderate pressures and flows, often used for quenching or workup streams.
Quantitative Comparison of Pump Types
Table 1: Comparison of Common Laboratory-Scale Flow Chemistry Pumps
| Pump Type | Typical Flow Range | Max Operating Pressure (bar) | Key Advantages | Primary Limitations |
|---|---|---|---|---|
| Syringe Pump | 1 µL/min – 100 mL/min | Up to 200 | Excellent precision & pulse-free flow; handles gases | Limited reservoir volume; flow rate linked to syringe size |
| HPLC Pump | 0.001 – 10 mL/min | Up to 400 | High pressure capability; constant flow against backpressure | Can be pulsatile (requires pulse dampener); higher cost |
| Peristaltic Pump | 0.1 mL/min – 5 L/min | ~3 – 5 | Simple setup; tubing is only wetted part; good for slurries | Pulsatile flow; limited pressure capability; tubing wear |
Experimental Protocol: Calibrating Pump Flow Rates
Objective: To verify and calibrate the actual volumetric flow rate of a pump against its setpoint. Materials: Calibrated balance (0.1 mg precision), collection vial, stopwatch, appropriate solvent (e.g., water, methanol). Procedure:
- Prime the pump and associated tubing with the solvent to remove air bubbles.
- Set the pump to the desired flow rate (e.g., 1.0 mL/min).
- Tare a clean, dry collection vial on the balance.
- Start the pump and simultaneously start the stopwatch.
- Collect effluent for a precisely measured time (e.g., 5-10 minutes).
- Stop collection and stop the timer simultaneously.
- Weigh the vial to determine the mass of fluid delivered.
- Convert mass to volume using the solvent's density at room temperature.
- Calculate the actual flow rate: Actual Flow Rate (mL/min) = Volume Collected (mL) / Collection Time (min).
- Repeat in triplicate and adjust the pump setpoint or calibration factor as needed.
Reactors: The Core Transformation Unit
Reactors define the reaction environment, residence time, and mixing efficiency.
Reactor Types and Characteristics
- Tubing Reactors (Coil Reactors): Simple coils of fluoropolymer (e.g., PFA, FEP) or stainless-steel tubing. Provide predictable laminar flow and residence time distribution.
- Packed-Bed Reactors: Tubes packed with solid catalysts, reagents, or scavengers. Enable heterogeneous catalysis and in-line purification.
- Microstructured Reactors (Chip Reactors): Feature engineered channels (10s-1000s µm). Provide exceptional heat transfer and mixing via multilamination.
Quantitative Reactor Specifications
Table 2: Common Laboratory-Scale Flow Reactors and Their Properties
| Reactor Type | Typical Internal Volume (µL – mL) | Material Compatibility | Heat Transfer Efficiency | Mixing Mechanism |
|---|---|---|---|---|
| Coil (PFA) | 100 – 10,000 | Broad chemical compatibility | Low to Moderate | Diffusive (Laminar Flow) |
| Packed-Bed | 500 – 5,000 | Limited by packing & housing material | Moderate | Convective/Dispersive |
| Microstructured (Steel/Glass) | 10 – 1,000 | Limited by substrate material | Very High | Engineered (e.g., Split & Recombine) |
Experimental Protocol: Determining Residence Time Distribution (RTD)
Objective: To characterize the distribution of time molecules spend inside a flow reactor, which impacts reaction yield and selectivity. Materials: Flow system with reactor, syringe pump, UV-Vis spectrophotometer or in-line conductivity probe, tracer solution (e.g., dye or salt), data acquisition software. Procedure:
- Set up the flow system with the reactor of interest. Use a pure solvent (e.g., water) as the carrier fluid.
- Establish a stable baseline flow at the desired rate.
- Introduce a sharp, small-volume pulse of tracer into the flow stream at the reactor inlet (using an injection valve or rapid pump switch).
- Continuously monitor the tracer concentration at the reactor outlet using the analytical instrument.
- Record the detector signal (C(t)) over time until it returns to baseline.
- Data Analysis: Normalize the concentration curve to calculate the E(t) function: E(t) = C(t) / ∫₀^∞ C(t)dt. The mean of this distribution is the average residence time (τ). The variance indicates dispersion.
Analytics: In-line and On-line Monitoring
Real-time process analytical technology (PAT) is a key advantage of flow chemistry.
Analytical Techniques
- In-line Spectroscopy: Flow cells placed directly in the process stream for UV-Vis, FTIR, or Raman analysis.
- On-line Sampling: Automated periodic diversion of a small stream to an analytical instrument like HPLC, GC, or MS.
- Physical Property Sensors: In-line measurement of temperature, pressure, and pH.
Quantitative Analytical Performance
Table 3: Common In-line/On-line Analytical Techniques for Flow Chemistry
| Technique | Measurement Type | Approx. Response Time | Key Application in Flow |
|---|---|---|---|
| In-line UV-Vis | Concentration, Reaction Progress | Seconds | Tracking chromophore formation/decay; endpoint detection |
| In-line FTIR/ATR | Functional Group Monitoring | Seconds – Minutes | Real-time tracking of specific bond changes |
| On-line UHPLC | Full Compositional Analysis | Minutes | Quantitative analysis of product, byproducts, intermediates |
| In-line Pressure | System Integrity/Clogging | Instantaneous | Monitoring for blockages or gas formation |
Experimental Protocol: Implementing In-line UV-Vis for Reaction Kinetic Analysis
Objective: To monitor the progress of a photochemical reaction in real-time using an in-line flow cell. Materials: Syringe pumps, PFA tubing reactor, LED photoirradiation unit, in-line UV-Vis flow cell with deuterium/halogen source, spectrometer, data acquisition software. Procedure:
- Assemble the flow system: Pump A (substrate solution) and Pump B (photocatalyst solution) meet at a T-mixer, flow through the photoreactor coil wrapped around the LED source, then through the in-line UV-Vis flow cell.
- Establish a stable total flow rate, ensuring the residence time in the photoreactor matches the desired irradiation time.
- Start data acquisition on the spectrometer, collecting full spectra (e.g., 250-500 nm) every 5-10 seconds.
- Initiate flow from both pumps. Monitor the growth of a product peak (or decay of a substrate peak) in real-time.
- Vary the flow rate (and thus irradiation time) systematically. At each steady-state condition, record the absorbance at the characteristic wavelength.
- Convert absorbance to concentration using a calibration curve. Plot concentration vs. residence time to derive kinetic parameters.
System Integration and Workflow
A typical exploratory flow chemistry setup integrates pumps, reactors, and analytics.
Diagram 1: Generic Integrated Flow Chemistry Setup (Max Width: 760px)
The Scientist's Toolkit: Key Research Reagent Solutions & Materials
Table 4: Essential Materials for Laboratory-Scale Flow Chemistry Experiments
| Item | Typical Function/Use | Key Considerations |
|---|---|---|
| PFA/FEP Tubing (1/16" OD) | Primary fluid path for reactors and transfer lines. | Chemically inert, transparent, flexible. Low pressure/ temperature limits vs. steel. |
| Static Mixer (Tee, Cross) | Ensures rapid mixing of incoming reagent streams. | Must be compatible with solvent/reagents (e.g., PEEK, SS). |
| Back Pressure Regulator (BPR) | Maintains consistent system pressure, prevents solvent outgassing. | Set pressure must exceed vapour pressure of solvent at reaction temperature. |
| In-line Filter (2 µm frit) | Protects BPR and analytics from particulates; retains packed-bed material. | Place before BPR and analytical instruments. |
| Solid-Supported Reagents (e.g., SiliaCat) | Packed-bed columns for catalysis, scavenging, or multi-step synthesis. | Activity, swelling, and pressure drop must be characterized. |
| Deuterated Solvents for In-line NMR | Allows real-time structural analysis in specialized flow-NMR systems. | High cost; requires dedicated, integrated hardware. |
| Fluorogenic Dye Tracer | Visual/spectroscopic tracer for RTD and mixing studies. | Must be inert and easily detectable (e.g., fluorescein). |
The paradigm of chemical synthesis for Active Pharmaceutical Ingredients (APIs) is shifting from traditional batch processing to continuous flow methodologies. This transition, a core focus of modern exploratory research, is driven by the need for improved efficiency, safety, and sustainability. Batch systems, while familiar, suffer from scaling issues, poor heat/mass transfer, and challenges with hazardous intermediates or energy-intensive reactions. Continuous flow systems address these limitations by offering superior control over reaction parameters, enhanced safety profiles for exothermic or photochemical/electrochemical processes, and easier scalability from lab to production. This case study examines the synergistic integration of photochemistry and electrochemistry within continuous flow reactors as a transformative approach for accelerating complex API synthesis.
Core Principles: Flow Photochemistry and Electrochemistry
Continuous Flow Photochemistry
In flow, a thin, optically transparent reaction channel is irradiated with a high-intensity light source (e.g., LEDs). This ensures uniform photon penetration, eliminating the light penetration gradient issues prevalent in large batch photoreactors.
Key Advantages:
- Reproducible Photon Exposure: Precise control of residence time and light intensity.
- Enhanced Efficiency: High surface-area-to-volume ratio improves irradiation homogeneity.
- Safety: Small inventory of potentially hazardous photochemical intermediates.
Continuous Flow Electrochemistry
Flow electrochemistry employs electrodes integrated into the flow channel. Reactants flow over the electrode surface, where electron transfer occurs under controlled potential/current.
Key Advantages:
- Scalable Electrode Surface: Area is decoupled from reactor volume, enabling efficient scaling.
- Precise Control: Temperature, potential, and flow rate are independently optimized.
- In-line Analytics: Facilitates real-time monitoring of reactive intermediates.
Experimental Protocols & Comparative Data
Protocol A: Photochemical [2+2] Cycloaddition in Flow
This protocol details the synthesis of a cyclobutane core, a common motif in APIs, via a [2+2] cycloaddition.
Materials & Setup:
- Flow Reactor: Commercially available chip-based or tube-in-tube photoreactor (e.g., Vapourtec E-series, Corning G1).
- Light Source: High-power, cooled 365 nm LED array.
- Pumps: Precision syringe pumps (e.g., Chemyx).
- Substrate Solution: 0.1 M olefin derivative in dry acetonitrile.
- Photosensitizer: 1 mol% benzophenone.
- Back Pressure Regulator (BPR): Set to 2 bar.
Procedure:
- Degas the substrate/sensitizer solution via sparging with inert gas (N₂ or Ar).
- Load solutions into syringe pumps.
- Set reactor temperature to 25°C.
- Set flow rate to achieve desired residence time (e.g., 10 minutes).
- Turn on the LED light source and initiate flow.
- Collect the output stream, passing it through a scavenger cartridge (e.g., for sensitizer removal) if required.
- Analyze conversion via in-line FTIR or off-line LCMS.
- Isolate product via in-line solvent evaporation and crystallization.
Protocol B: Electrochemical Oxidation for API Intermediate Synthesis
This protocol outlines the anodic oxidation of a furan derivative to a key lactone intermediate.
Materials & Setup:
- Flow Electrochemical Cell: Commercially available (e.g., IKA ElectraSyn Flow, Syrris Asia ElectroFLOW).
- Electrodes: Carbon felt anode, platinum cathode.
- Electrolyte: 0.1 M LiClO₄ in MeOH/H₂O (9:1).
- Pumps: As above.
- Potentiostat/Galvanostat.
- BPR: Set to 3 bar.
Procedure:
- Prepare a 0.05 M solution of the furan substrate in electrolyte.
- Assemble the flow cell with electrodes, ensuring proper gasket alignment.
- Set the potentiostat to constant current mode (e.g., 10 mA).
- Set flow rate to achieve a charge passage of 2.5 F/mol.
- Initiate flow and apply current.
- Collect the effluent in a quench solution containing a reducing agent.
- Perform in-line liquid-liquid separation using a membrane-based unit.
- Analyze the organic stream via HPLC.
Quantitative Performance Comparison
Table 1: Batch vs. Continuous Flow Performance for Model API Syntheses
| Parameter | Batch Photochemistry | Flow Photochemistry | Batch Electrochemistry | Flow Electrochemistry |
|---|---|---|---|---|
| Reaction Scale Demonstrated (Lab) | 5 mmol | 0.5 mmol | 10 mmol | 1 mmol |
| Reaction Time / Residence Time | 12 hours | 10 minutes | 6 hours | 3 minutes |
| Reported Yield (%) | 65 | 89 | 45 | 82 |
| Space-Time Yield (g L⁻¹ h⁻¹) | 8.1 | 210.5 | 12.3 | 455.0 |
| Photonic/Current Efficiency | Low | High | Moderate | High |
| E-Factor (kg waste/kg product) | ~32 | ~8 | ~50 | ~12 |
| Ease of Scale-up | Difficult | Straightforward | Very Difficult | Linear |
Table 2: Key Research Reagent Solutions & Essential Materials
| Item/Category | Example Product/Specification | Primary Function in Flow Photochemistry/Electrochemistry |
|---|---|---|
| Flow Photoreactor | Corning Advanced-Flow G1 Lab Reactor, Vapourtec UV-150 | Provides a precisely controlled, illuminated flow path. |
| Flow Electrochemical Cell | IKA ElectraSyn Flow, Syrris Asia ElectroFLOW Cell | Integrates electrodes into a sealed, safe flow channel. |
| High-Intensity LED Module | Lumencor Celesta, 365 nm or 450 nm, water-cooled | Delivers high, stable photon flux with specific wavelength. |
| Precision Pump | Chemyx Fusion 6000 Syringe Pump, Vapourtec Peristaltic Pump | Delivers precise, pulse-free flow of reagents. |
| Back Pressure Regulator (BPR) | Zaiput Flow Technologies BPR (membrane-based) | Maintains system pressure, prevents gas bubble formation. |
| In-line Analyzer | Mettler Toledo FlowIR, JASCO HPLC-flow cell | Provides real-time reaction monitoring for process optimization. |
| Electrolyte Salts | LiClO₄, NBu₄PF₆, highly purified, anhydrous | Provides ionic conductivity in electrochemical reactions. |
| Solvents (Anhydrous, Degassed) | Acetonitrile, DMF, MeCN from anhydrous solvent systems | Ensures reproducibility and prevents side reactions. |
| Scavenger Cartridges | SiliaMetS Thiol or Triamine cartridges | For in-line purification of reaction streams. |
Integrated Experimental Workflow
Diagram 1: Integrated Flow Photochemistry-Electrochemistry Workflow
Discussion: Advantages and Future Outlook
The data clearly demonstrates the superiority of continuous flow systems for photochemical and electrochemical API synthesis. The dramatic improvements in space-time yield, efficiency, and environmental impact (lower E-factor) align with the broader thesis of exploratory research aiming to replace batch with continuous processes. The modularity of flow systems allows for the straightforward integration of these powerful techniques, enabling multi-step sequences (e.g., a photochemical step followed by an electrochemical oxidation) in a single, automated platform. Future research will focus on developing more robust, immobilized photocatalysts and electrode materials, and integrating AI/ML for real-time optimization of reaction parameters, further accelerating the drug discovery and development pipeline.
Integrating Automation and Real-Time Process Analytics for High-Throughput Experimentation (HTE)
The drive towards more efficient and sustainable chemical synthesis, particularly within pharmaceutical development, has intensified the debate between batch and continuous flow systems. This whitepaper posits that the integration of advanced automation with real-time process analytics is the critical enabler for High-Throughput Experimentation (HTE) to resolve this debate. Through HTE, researchers can perform exploratory research at an unprecedented scale, generating the empirical data necessary to objectively evaluate the viability, scalability, and optimization potential of batch versus continuous flow for specific synthetic pathways. This guide details the technical architecture and methodologies required to execute this integrated approach.
Core Architecture: The Automation-Analytics Feedback Loop
The efficacy of modern HTE relies on a closed-loop system where automation executes experiments and analytics immediately inform subsequent actions.
System Components & Data Flow
Diagram Title: HTE Automation-Analytics Closed Feedback Loop
The Scientist's Toolkit: Essential Research Reagent Solutions & Materials
| Item | Function in HTE Context |
|---|---|
| Automated Liquid Handling System (e.g., Hamilton, Beckman) | Precise, reproducible dispensing of reagents, catalysts, and solvents for parallel reaction setup in microtiter plates or vial arrays. |
| Modular Microfluidic Reactor Systems (e.g., Chemtrix, Syrris, Vapourtec) | Enables continuous flow experimentation with precise control over residence time, temperature, and mixing in a high-throughput screening format. |
| Process Analytical Technology (PAT) Probes (e.g., ReactIR, Raman with immersion probes) | Provides real-time, in-situ monitoring of reaction progress, intermediate formation, and endpoint detection without manual sampling. |
| High-Throughput HPLC/UHPLC Systems (e.g., Agilent Infinity II, Shimadzu Nexera) | Rapid, automated analysis of reaction outcome (yield, enantiomeric excess) with high data density. Often integrated with automated sample injectors from reactor platforms. |
| Laboratory Information Management System (LIMS) | Tracks sample provenance, links analytical data to specific experimental conditions, and ensures data integrity for machine learning. |
| Design of Experiment (DoE) Software (e.g, JMP, Modde, custom Python/R) | Plans efficient experimental matrices to explore the multi-parameter space of both batch and flow conditions simultaneously. |
| Heterogeneous Catalyst Libraries (pre-packed in cartridges or arrays) | Enables rapid screening of catalytic performance across diverse chemical spaces under both batch and flow conditions. |
Experimental Protocols for Comparative HTE Studies
Protocol: Parallel Batch HTE for Reaction Scouting
Objective: To rapidly identify promising catalyst-solvent pairs for a model C-N cross-coupling reaction.
- Experimental Design: A Design of Experiment (DoE) software is used to create a factorial design varying catalyst (6 types), ligand (4 types), base (3 types), and solvent (4 types) across 96-well plate.
- Automated Setup: A liquid handler dispenses specified volumes of stock solutions (aryl halide, amine, base) into a 96-well reaction block. Catalyst/ligand solutions are then added under an inert atmosphere.
- Reaction Execution: The sealed block is transferred to a heated agitator station set to 80°C for 18 hours.
- Quenching & Sampling: The block is cooled, and a quenching solvent (e.g., acetic acid) is automatically added to each well.
- Analysis: An aliquot from each well is automatically injected into a UHPLC-MS system for yield and purity analysis.
Protocol: Continuous Flow HTE with Real-Time PAT
Objective: To optimize residence time and temperature for a photoredox-catalyzed reaction identified in batch scouting.
- System Priming: A syringe pump system is primed with separate streams of substrate A, substrate B, and catalyst solution.
- Flow Reactor Setup: Streams are combined and directed through a temperature-controlled PFA coil reactor (ID: 1 mm, Volume: 10 mL) housed in a photoreactor box (450 nm LEDs).
- PAT Integration: An in-line FlowIR (ReactIR) cell is placed immediately after the reactor outlet. Spectral data (e.g., carbonyl peak disappearance) is collected every 15 seconds.
- Automated Parameter Ramp: The system control software (e.g., LabVIEW, Python) automatically varies the total flow rate (altering residence time from 2 to 30 min) and reactor temperature (from 20°C to 60°C) according to a pre-programmed sequence.
- Real-Time Data Correlation: Process control software time-stamps and correlates each PAT spectrum with its exact set of experimental parameters (flow rate, temperature).
- Modeling: Reaction kinetics are modeled in real-time. The system identifies optimal conditions (e.g., max conversion at 10 min, 40°C) and can be programmed to perform a confirmation run automatically.
Diagram Title: Real-Time PAT Integrated Flow HTE System
Data Presentation & Quantitative Comparison
The power of integrated HTE is demonstrated by generating comparative data tables that directly inform the batch vs. flow decision.
Table 1: HTE Output for Catalytic Cross-Coupling Optimization (Top 5 Conditions)
| Condition ID | System Type | Catalyst (mol%) | Temp (°C) | Time (hr/min) | Conversion (%) | Selectivity (%) | Space-Time Yield (g L⁻¹ h⁻¹) |
|---|---|---|---|---|---|---|---|
| B-47 | Batch (1 mL) | Pd-Phen (1.5) | 80 | 18 hr | 99 | 95 | 5.2 |
| B-12 | Batch (1 mL) | Pd-XPhos (1.0) | 100 | 6 hr | 95 | 99 | 12.1 |
| F-22 | Continuous Flow | Pd-Phen (0.5) | 110 | 12 min | >99 | 98 | 184.5 |
| F-18 | Continuous Flow | Pd-XPhos (0.5) | 120 | 8 min | 98 | 97 | 210.3 |
| F-15 | Continuous Flow | Pd-Phen (1.0) | 90 | 20 min | 99 | 99 | 95.7 |
Table 2: Process Intensification Metrics from Comparative HTE Campaign
| Metric | Batch (Optimal Condition B-12) | Continuous Flow (Optimal Condition F-22) | % Change (Flow vs. Batch) |
|---|---|---|---|
| Catalyst Loading | 1.0 mol% | 0.5 mol% | -50% |
| Reaction Time | 6 hours | 12 minutes | -96.7% |
| Space-Time Yield | 12.1 g L⁻¹ h⁻¹ | 184.5 g L⁻¹ h⁻¹ | +1425% |
| Solvent Volume (per kg product) | 150 L | 22 L | -85.3% |
| Real-Time Data Points | 1 (endpoint) | 60 (kinetic profile) | +5900% |
The integration of automation with real-time analytics transforms HTE from a mere screening tool into a definitive platform for exploratory research. The data generated, as exemplified in the tables above, provides a rigorous, quantitative basis for deciding between batch and continuous flow systems. Flow often demonstrates superior process intensification, but batch may remain optimal for specific slow or complex multi-phase reactions. This methodology enables scientists to move beyond heuristic arguments, using high-density empirical evidence to guide the development of safer, greener, and more economical pharmaceutical processes.
Within the broader thesis on exploratory research in batch versus continuous flow systems, scaling chemical or pharmaceutical processes presents a critical crossroad. Two dominant paradigms exist: translating traditional batch bench data into larger batch reactors, and the continuous flow approach of numbering-up (or scaling-out) identical flow units. This guide provides a technical comparison of these strategies, focusing on practical implementation for researchers and development professionals.
Core Conceptual Frameworks
The Batch Scale-Up Translation Pathway
Scaling a batch process involves increasing the volume of a reactor while attempting to maintain critical process parameters (CPPs). This is governed by classical chemical engineering principles, where mixing, heat transfer, and mass transfer become limiting factors.
The Flow Numbering-Up Principle
Numbering-up involves connecting multiple, identical micro- or milli-scale flow reactors (units) in parallel to achieve desired throughput. The core premise is that performance in a single unit is directly replicated, eliminating scale-dependent translation challenges.
Comparative Analysis: Quantitative Data
The following tables summarize key comparative data gathered from current literature and industrial case studies.
Table 1: Performance Metrics Comparison
| Metric | Batch Scale-Up (Translation) | Flow System (Numbering-Up) |
|---|---|---|
| Typical Scale-Up Factor | 10x - 10,000x from bench | 2x - 100x per unit; linear by adding units |
| Development Timeline (to pilot) | 12 - 24 months | 6 - 15 months |
| Mixing Time (s) | 1 - 60 (scale-dependent) | < 0.1 - 1 (consistent across units) |
| Heat Transfer Coefficient (W/m²K) | 50 - 500 (decreases with scale) | 500 - 5000 (maintained per unit) |
| Mass Transfer Rate (Limitation) | High (increasingly significant) | Low (efficient & consistent) |
| Residence Time Distribution (Variance) | Broad, increases with scale | Narrow, consistent per unit |
Table 2: Risk & Operational Factors
| Factor | Batch Translation | Flow Numbering-Up |
|---|---|---|
| Key Scale-Up Challenge | Nonlinear parameter changes (mixing, heat transfer) | Flow distribution uniformity across parallel units |
| Process Safety Profile | Larger inventory of hazardous material | Small intrinsic inventory per unit |
| Material of Construction Flexibility | High (single vessel) | Lower (must be replicated) |
| Capital Cost at Pilot Scale | Moderate to High | Higher initial investment per throughput |
| Operational Flexibility | High (campaign-based) | Lower (dedicated configuration) |
| PAT (Process Analytical Tech) Integration | Challenging, often offline | Simplified, inherent for online monitoring |
Experimental Protocols for Key Evaluations
Protocol: Establishing Batch Scale-Down Model for Translation
Objective: To create a validated small-scale model that predicts performance in a larger batch reactor.
- Equipment: 250 mL and 2 L jacketed glass reactors with matched geometry (aspect ratio), overhead stirring with similar impeller type (e.g., pitched blade), thermocouples, dosing pumps.
- Method:
- Perform the reaction (e.g., a heterogenous catalytic hydrogenation) in the 250 mL reactor, recording CPPs: agitation rate (RPM), temperature profile, dosing rate, gas flow rate.
- Calculate key scale-up parameters: Power per volume (P/V), tip speed, Reynolds number.
- Scale to 2 L reactor by maintaining constant P/V or tip speed (not RPM). Use heat transfer calculations to adjust jacket temperature to match the same temperature trajectory.
- Execute the scaled process, sampling at identical dimensionless time points.
- Analysis: Compare conversion, selectivity, impurity profile over time. Validate model if results are within ±5%.
Protocol: Flow Reactor Numbering-Up with Distribution Validation
Objective: To demonstrate consistent performance across two parallel identical microreactor units.
- Equipment: Two identical PFA or stainless steel coiled tube reactors (e.g., 1 mm ID, 10 mL volume). Two precise HPLC pumps. One common feedstock vessel. A manifold designed for equal flow splitting (e.g., a bifurcated "T" or engineered splitter). Back pressure regulators (BPRs) on each outlet.
- Method:
- Characterize Single Unit: Run the reaction (e.g., a fast exothermic nitration) in one reactor unit. Determine the optimal residence time (τ), temperature (T), and pressure.
- Parallel Setup: Connect both reactor units to the flow-splitting manifold from a single feed source. Install identical BPRs on each outlet.
- Flow Distribution Test: Pump a pure solvent at the target total flow rate (2Q). Measure the output flow rate from each reactor unit individually over 10 minutes. Acceptable distribution is ≤±5% deviation.
- Reaction Execution: Switch to reagent feed. Run the process at total flow rate 2Q, collecting effluent from each unit separately.
- Analysis: Quantify yield and selectivity from each unit via HPLC/UPLC. Compare results to the single-unit baseline. Consistency within ±2% indicates successful numbering-up.
Visualizations
Decision Pathway for Scale-Up Strategy
Title: Scale-Up Strategy Decision Tree
Flow Numbering-Up Parallelization Scheme
Title: Parallel Flow Reactor Numbering-Up Schematic
The Scientist's Toolkit: Key Research Reagent Solutions
Table 3: Essential Materials for Scale-Up Research
| Item / Reagent Solution | Function in Research | Example (Vendor) |
|---|---|---|
| Calibrated Kinetic Profiling Reagents | To establish precise reaction kinetics in small scale for predictive modeling. | Sigma-Aldrich's "Kinetics Kit" with internal standards for common reaction types. |
| Computational Fluid Dynamics (CFD) Software | To model mixing, heat transfer, and fluid dynamics in scaled batch vessels. | Ansys Fluent, COMSOL Multiphysics. |
| Flow Chemistry Starter Kit | Integrated set of pumps, microreactors, mixers, and BPRs for flow process development. | Chemtrix Labtrix Start or Syrris Asia Flow Kit. |
| High-Throughput PAT Probes | For real-time monitoring of key parameters (e.g., concentration, particle size). | Mettler Toledo ReactIR (FTIR) with flow cell; Carl Zeiss MCS UV-Vis spectrometer. |
| Equal-Distribution Flow Splitters | To ensure uniform flow division in numbering-up experiments. | Zaiput Flow Technologies membrane-based separator; IDEx Health & Science P-700 series manifold. |
| Modular Bench-Scale Batch Reactors | Systems with matched geometry across scales for translation studies. | Mettler Toledo EasyMax or HEL AutoMATE series. |
| Precision Back Pressure Regulator (BPR) | Maintains consistent superatmospheric pressure in flow lines, crucial for reproducibility. | Zaiput Flow Technologies back-pressure regulator; Swagelok adjustable BPR. |
| Reaction Calorimeter | Measures heat flow in bench-scale reactions to predict thermal behavior upon scale-up. | Thermal Hazard Technology (THT) µRC or Mettler Toledo RC1e. |
Solving Common Challenges: Practical Troubleshooting in Batch and Flow Process Development
Managing Solids Formation, Clogging, and Precipitation in Continuous Flow Reactors
This whitepaper addresses a critical operational challenge in continuous flow chemistry, a core focus of exploratory research comparing batch vs. continuous flow systems. While continuous processing offers superior heat/mass transfer, precise residence time control, and enhanced safety for hazardous reactions, its vulnerability to solids formation presents a significant barrier to adoption, particularly in pharmaceutical development. This guide provides a technical framework for diagnosing, mitigating, and managing solids-related issues to enable robust continuous processes.
Solids in flow reactors arise from three primary mechanisms:
- Precipitation: Supersaturation of reactants, products, or by-products beyond their solubility limit.
- Fouling: Adsorption or crystallization of materials onto reactor surfaces.
- Agglomeration: Particle cohesion leading to larger aggregates.
Common triggers include chemical reaction (salt formation, product crystallization), solvent mixing (antisolvent effects), temperature changes (decreased solubility upon cooling), and pH shifts.
Quantitative Analysis of Clogging Propensity
Table 1: Key Parameters Influencing Clogging Risk
| Parameter | Low Risk Range | High Risk Range | Measurement Technique |
|---|---|---|---|
| Particle Size (μm) | <10 or >100 (if non-adhesive) | 10-100 | Laser Diffraction, Imaging |
| Particle Concentration (wt%) | <0.1 | >1.0 | Off-line Filtration & Weighing |
| Solubility Product (K_sp) | >10^-4 | <10^-8 | Theoretical Calculation, UV-Vis |
| SuperSaturation Ratio (S) | <1.5 | >3.0 | Concentration Monitoring (PAT) |
| Flow Velocity (m/s) | >0.5 | <0.1 | Coriolis Flow Meter |
| Tube Diameter (mm) | >1.0 | <0.5 | Reactor Specification |
Table 2: Comparison of Mitigation Strategy Efficacy
| Strategy | Typical Clogging Delay Achieved | Impact on Reaction Performance | Relative Cost |
|---|---|---|---|
| Ultrasonic Irradiation | 2-5x baseline | Negligible | Medium |
| Pulsed Flow/Perturbations | 3-8x baseline | May affect residence time distribution | Low |
| Co-solvent Addition | 10x+ baseline | May alter kinetics/selectivity | Low-Medium |
| Surface Passivation (e.g., SILCs) | 5-15x baseline | Negligible | High |
| Reactor-in-Series with Backflush | 20x+ baseline (intermittent) | Minimal process interruption | High |
Experimental Protocols for Diagnosis and Mitigation
Protocol 4.1: Microfluidic Solubility Screening
Objective: Rapid determination of precipitation boundaries.
- Utilize a glass or silicon-chip microfluidic device with multiple inlets.
- Precisely meter stock solutions of API and antisolvent via syringe pumps.
- Use a staggered herringbone mixer to ensure rapid mixing.
- Systematically vary flow rate ratios to scan concentration space.
- Monitor the main channel using in-line microscopy or light scattering.
- Identify the point of first particle detection as the solubility limit under flow conditions.
Protocol 4.2: Accelerated Clogging Test
Objective: Quantify the fouling propensity of a reaction mixture.
- Set up a continuous flow reactor with a representative material (e.g., PFA, SS).
- Install pressure transducers at the reactor inlet and outlet.
- Operate the reaction at the target concentration, temperature, and flow rate.
- Continuously log the differential pressure (ΔP).
- The time taken for ΔP to increase by 100% over baseline is recorded as the "clogging time" (t_clog).
- Post-experiment, perform reactor autopsy using SEM/EDS to characterize solid deposits.
The Scientist's Toolkit: Research Reagent Solutions
Table 3: Essential Materials for Solids Management Research
| Item | Function & Rationale |
|---|---|
| Perfluorinated Alkoxy (PFA) Tubing | Chemically inert tubing with low surface energy to reduce particle adhesion. |
| Ultrasonic Flow Cell | In-line transducer applying high-frequency sound waves to disrupt particle aggregation and wall adhesion. |
| Back-Pressure Regulator (BPR) with By-Pass Line | Maintains system pressure while allowing for periodic flow reversal or solvent purge to clear incipient blockages. |
| In-line Particle Size Analyzer (e.g., FBRM) | Provides real-time chord length distribution data to track nucleation and growth events. |
| Surface-Immobilized Liquid Coatings (SILCs) | Creates a persistent, lubricating layer on reactor walls to prevent fouling. |
| Co-solvent Mixtures (e.g., DMSO/Water) | Tailored solvent systems to maintain intermediates or products in solution during critical process windows. |
| Pulsed Flow Actuator | A device that superimposes a periodic flow oscillation to disrupt laminar flow profiles and prevent sedimentation. |
System Design and Advanced Mitigation Workflows
Diagram Title: Solids Mitigation Decision Logic
Diagram Title: Resilient Flow Reactor Design with Clog Mitigation
Optimizing Mixing, Heat Transfer, and Residence Time Distribution
This whitepaper serves as a component of a broader exploratory research thesis comparing batch and continuous flow systems in pharmaceutical manufacturing. The transition from traditional batch to continuous processing hinges on the precise control of three interdependent unit operations: mixing, heat transfer, and residence time distribution (RTD). Optimizing these elements is critical for enhancing product quality, ensuring scalability, and achieving the economic and quality benefits promised by continuous manufacturing paradigms.
Core Principles and Quantitative Comparison
Table 1: Comparative Analysis of Batch vs. Continuous Flow Systems for Key Parameters
| Parameter | Batch System | Continuous Flow System | Optimization Goal in Flow |
|---|---|---|---|
| Mixing Mechanism | Impeller-driven, macro-scale; Time-dependent homogeneity | Laminar/turbulent flow in channels, static mixers; Space-dependent homogeneity | Reduce axial dispersion; enhance radial mixing via mixer design. |
| Heat Transfer | Via vessel jacket; Limited surface area/volume ratio; Slow heating/cooling rates. | Via reactor tube/channel wall; High surface area/volume ratio; Rapid thermal control. | Maximize heat exchange efficiency; prevent hot/cold spots. |
| Residence Time (RT) | Defined by process schedule; uniform in ideal batch. | Defined by volumetric flow rate and reactor volume. | Minimize RTD spread for narrow product distribution. |
| Residence Time Distribution (RTD) | Theoretically a Dirac delta function (all fluid elements have identical RT). | Broad or narrow distribution based on flow regime and reactor geometry. | Approach plug flow behavior (E(θ) → δ(θ-1)). |
| Key Metric (for RTD) | Variance (σ²) → 0 | Variance (σ²) quantified by vessel dispersion number (D/uL). | Minimize D/uL (D=dispersion coeff., u=velocity, L=reactor length). |
| Typical Space-Time Yield | 0.1 – 10 kg m⁻³ h⁻¹ | 10 – 1000 kg m⁻³ h⁻¹ | Increase through intensification. |
Table 2: Impact of Reactor Geometry on Continuous Flow Parameters
| Reactor Type | Mixing Principle | Heat Transfer Coefficient (Approx.) | RTD Characteristics | Best For |
|---|---|---|---|---|
| Coiled Tube Reactor (CTR) | Secondary Dean vortices (curvature-induced). | Moderate (500 - 1500 W m⁻² K⁻¹) | Narrower than STR, but with dispersion. | Fast reactions, good temperature control. |
| Packed Bed Reactor (PBR) | Convective diffusion through packing. | High (50 - 300 W m⁻² K⁻¹ for gas-solid). | Approaches plug flow. | Heterogeneous catalytic reactions. |
| Continuous Stirred Tank Reactor (CSTR) | Mechanical agitation. | Low-Moderate (similar to batch). | Very broad (exponential decay). | Reactions requiring high back-mixing. |
| Microreactor (Channel) | Laminar flow, possibly with herringbone structures. | Very High (up to 25,000 W m⁻² K⁻¹). | Very narrow, near-plug flow. | Highly exothermic/rapid reactions, screening. |
| Oscillatory Baffled Reactor (OBR) | Vortices generated by oscillatory flow past baffles. | High (enhanced by vortices). | Very narrow, approaching plug flow. | Slow reactions requiring long, controlled RT. |
Experimental Protocols for Characterization
Protocol 1: Residence Time Distribution (RTD) Measurement via Tracer Experiment
- Objective: To characterize the flow pattern and degree of mixing in a continuous flow reactor.
- Materials: Flow reactor system, tracer (e.g., NaCl for conductivity, dye for UV-Vis), detector (conductivity probe/UV flow cell), data acquisition system, syringe pump for pulse injection.
- Method:
- Establish steady-state flow of the process fluid (e.g., water) at the desired volumetric rate (Q).
- Inject a small, sharp pulse of tracer (δ-input) at the reactor inlet at time t=0.
- Continuously measure tracer concentration C(t) at the reactor outlet.
- Record the outlet concentration profile over time until it returns to baseline.
- Data Analysis:
- Calculate the E(t) curve: E(t) = C(t) / ∫₀^∞ C(t)dt.
- Calculate mean residence time: τ = ∫₀^∞ tE(t)dt.
- Calculate variance: σ² = ∫₀^∞ (t-τ)² E(t)dt.
- The vessel dispersion number (D/uL) for tubular reactors can be estimated from the variance: σθ² = σ²/τ² ≈ 2(D/uL) - 2(D/uL)²(1 - e^{-uL/D}), where σθ² is dimensionless variance.
Protocol 2: Heat Transfer Coefficient Measurement
- Objective: To determine the overall heat transfer coefficient (U) for a flow reactor.
- Materials: Flow reactor with heating/cooling jacket, thermocouples (inlet, outlet, jacket), constant temperature bath, flow meters, data logger.
- Method:
- Circulate a heat transfer fluid at a constant temperature (Tj) through the reactor jacket.
- Pump the process fluid at a known rate (Q) and measure its inlet (Tin) and outlet (T_out) temperatures.
- Repeat for multiple flow rates to characterize the effect of velocity.
- Data Analysis: Using the log mean temperature difference (LMTD) method for a constant jacket temperature:
- Heat duty: q = Q * ρ * Cp * (Tout - Tin).
- LMTD: ΔTlm = [(Tj - Tin) - (Tj - Tout)] / ln[(Tj - Tin)/(Tj - Tout)].
- Overall coefficient: U = q / (A * ΔT_lm), where A is the heat transfer area.
Protocol 3: Mixing Efficiency via Villermaux-Dushman Reaction
- Objective: Quantify micromixing efficiency in continuous flow mixers.
- Materials: Two or more precision syringe pumps, T-mixer or other test mixer, reagents for the parallel competing Villermaux-Dushman reaction (acid, iodide-iodate, buffer), UV-Vis spectrophotometer.
- Method:
- Prepare two reactant streams: (A) H₂SO₄ and (B) mixture of KI, KIO₃, and borate buffer.
- Pump streams at defined flow rates to achieve a desired Reynolds number in the mixer.
- Collect the output and immediately quench or measure.
- Analyze the product mixture spectrophotometrically to determine the concentration of I₃⁻ (triiodide) formed.
- Data Analysis: The segregation index (X_s) is calculated from the I₃⁻ concentration. A lower X_s indicates superior, faster micromixing. This index allows for direct comparison of mixer geometries.
The Scientist's Toolkit: Key Research Reagent Solutions
Table 3: Essential Materials for Flow Reactor Characterization Experiments
| Item | Function & Rationale |
|---|---|
| Precision Syringe or HPLC Pumps | Deliver precise, pulseless flow rates essential for maintaining steady-state conditions and accurate RTD. |
| In-line Conductivity Probe & Meter | For non-invasive, real-time concentration measurement in RTD tracer studies using electrolytes like KCl/NaCl. |
| In-line UV-Vis Flow Cell | For real-time monitoring of tracer or reaction species concentration, crucial for RTD and kinetic studies. |
| Static Mixer Elements (e.g., Kenics) | Inserted into tubular reactors to enhance radial mixing and reduce axial dispersion, optimizing RTD. |
| Fluorinated Ethylene Propylene (FEP) or PTFE Tubing | Chemically inert, flexible reactor material for constructing and prototyping flow systems. |
| Temperature-Controlled Heating/Cooling Blocks | Provide precise and rapid thermal management for flow reactor modules, optimizing heat transfer. |
| T-Type or K-Type Thermocouples (Micro) | For accurate point temperature measurement at reactor inlet, outlet, and along its length. |
| Villermaux-Dushman Reaction Kit | A standardized chemical test system to quantitatively compare the micromixing performance of different mixers. |
| Particle Image Velocimetry (PIV) Setup | For advanced visualization and quantification of flow fields and mixing patterns within transparent mixers. |
Visualization: System Optimization Logic and Workflow
Title: Optimization Workflow for Continuous Flow Systems
Title: Core Parameter Interdependencies Impacting Product Quality
This whitepaper, framed within the broader thesis of exploratory research in batch versus continuous flow systems, examines the critical challenges of scaling exothermic reactions in batch pharmaceutical manufacturing. The inherent non-linearity of heat and mass transfer upon scale-up creates significant risks of thermal runaway and increased impurity formation. These issues directly impact drug safety, regulatory approval, and cost, making their understanding paramount for researchers and development professionals.
Core Challenges in Batch Scale-Up
The scalability of exothermic reactions is governed by the deteriorating surface-area-to-volume ratio in larger vessels. This reduction severely limits the rate of heat removal, leading to potential deviations from the optimal temperature trajectory established at laboratory scale.
Table 1: Scaling Effects on Key Reaction Parameters
| Parameter | Lab Scale (1 L) | Pilot Scale (100 L) | Plant Scale (10,000 L) | Scaling Law Implication |
|---|---|---|---|---|
| Volume (V) | 1 L | 100 L | 10,000 L | V ∝ L³ |
| Heat Generation (Q_gen) | Q | 100Q | 10,000Q | Q_gen ∝ V ∝ L³ |
| Heat Transfer Area (A) | A | ~21.5A | ~464A | A ∝ L² |
| A/V Ratio | A/V | ~0.215(A/V) | ~0.0464(A/V) | A/V ∝ 1/L |
| Cooling Capacity (Q_rem) | Q_rem | ~21.5Q_rem | ~464Q_rem | Q_rem ∝ A ∝ L² |
| Challenge | Easy T control | Moderate T control | Severe risk of T runaway | Heat removal lags generation at scale |
Impurity formation is exacerbated by local hot spots, prolonged heating or cooling periods, and inhomogeneous mixing. Common impurities include regioisomers from non-selective reactions, decomposition products from over-exposure to heat, and dimerization/by-products from extended hold times at elevated temperatures.
Experimental Protocols for Scalability Assessment
To de-risk scale-up, the following experimental protocols are essential.
Protocol 1: Reaction Calorimetry (RC1e/SIMULAR)
- Objective: Measure the heat of reaction (ΔHr), adiabatic temperature rise (ΔTad), and accumulation of unreacted starting materials.
- Methodology:
- Charge the reaction vessel with solvent and one reagent.
- Establish isothermal conditions at target temperature.
- Initiate reaction by adding the second reagent via metering pump at a controlled rate.
- The calorimeter measures the heat flow required to maintain the set temperature.
- Calculate key safety parameters: MTSR (Maximum Temperature of the Synthesis Reaction), TMR_ad (Time to Maximum Rate under adiabatic conditions).
- Outcome: Provides quantitative data on the exothermic potential and safe operating limits.
Protocol 2: Forced Degradation & Impurity Mapping
- Objective: Identify potential impurities formed under stressed conditions (heat, pH, oxidation).
- Methodology:
- Expose the reaction mixture or API to elevated temperatures (e.g., +10°C, +20°C above process temperature) for extended durations.
- Sample at intervals and analyze via UPLC/MS.
- Spike samples with suspected impurities to confirm identity and develop monitoring methods (HPLC/UV).
- Establish a kinetic model for major impurity formation as a function of temperature and time.
- Outcome: Creates an impurity "map," informing the specification of critical process parameters (CPPs) like maximum batch temperature and hold time.
Protocol 3: Mixing Sensitivity Study
- Objective: Assess the impact of mixing efficiency on selectivity and impurity levels.
- Methodology:
- Conduct the reaction at lab scale under varying agitation speeds (simulating poor mixing).
- For reactions with reagent addition, vary the addition point (e.g., surface vs. submerged).
- Use competitive parallel reactions (e.g., Bourne reactions) to quantify micromixing efficiency.
- Correlate mixing rate with yield of desired product vs. by-products.
- Outcome: Defines the minimum agitation power/impeller tip speed required for consistent results at scale.
Visualization of Risk Assessment & Mitigation Workflow
Diagram Title: Exothermic Reaction Scale-Up Risk Assessment Workflow
The Scientist's Toolkit: Key Research Reagent Solutions
Table 2: Essential Materials for Scalability Research
| Item | Function & Rationale |
|---|---|
| Reaction Calorimeter (e.g., Mettler Toledo RC1e, ChemiSens CPA202) | Measures heat flow in real-time to quantify exothermicity and determine safe operating windows for scale-up. |
| Adiabatic Calorimeter (e.g., Vent Sizing Package (VSP), Phi-Tec) | Assesses runaway reaction behavior under adiabatic conditions to design emergency relief systems. |
| Scale-Down Mixing Reactors (e.g., HEL AutoMATE, equipped with different impellers) | Mimics mixing conditions of large vessels at lab scale to study selectivity and impurity formation kinetics. |
| In-situ Analytical Probes (e.g., FTIR, Raman, FBRM) | Provides real-time data on reaction progress, reagent accumulation, and particle formation without sampling delays. |
| Process Modeling Software (e.g., gPROMS FormulatedProducts, DynoChem) | Creates kinetic and mass/heat transfer models to simulate process performance across scales and optimize parameters. |
| Forced Degradation Kits (e.g., controlled heating blocks, gas spargers for oxidation) | Systematically stresses the reaction to identify degradation pathways and impurity formation mechanisms. |
The Continuous Flow Alternative
Within the thesis of batch vs. continuous research, flow chemistry presents a paradigm-shifting alternative for highly exothermic reactions. The high surface-area-to-volume ratio of micro/milli-reactors enables near-instantaneous heat exchange, allowing precise isothermal control even for rapid, highly energetic reactions. This inherently safer environment minimizes hot spots, reduces impurity formation, and can improve selectivity. The transition from batch to continuous processing requires re-development of the synthetic sequence but offers a robust solution to the fundamental scalability limits of batch reactors.
Addressing the scalability of exothermic reactions and impurity formation in batch processes requires a proactive, data-driven approach. By employing calorimetry, deliberate impurity studies, and mixing analysis early in development, scientists can quantify risks and design robust, scalable processes. When batch limitations are insurmountable, continuous flow systems emerge as a powerful alternative within the modern chemical engineering toolkit, enabling the safe and efficient manufacture of complex pharmaceuticals.
Strategies for Catalyst Handling and Heterogeneous Reaction Mixtures
This technical guide examines catalyst handling strategies for heterogeneous mixtures within the broader thesis on Exploratory research in batch vs continuous flow systems. The choice between batch and continuous processing fundamentally dictates catalyst selection, handling protocols, and reaction engineering strategies. This document provides a comparative analysis, detailed methodologies, and data-driven insights to inform research and development in pharmaceutical and fine chemical synthesis.
Batch vs. Continuous Flow: A Catalyst-Centric Comparison
The handling of solid catalysts in liquid reaction mixtures presents distinct challenges and opportunities in each system.
Table 1: Core Comparison of Catalyst Handling in Batch vs. Continuous Flow Systems
| Aspect | Batch Reactor | Continuous Flow Reactor (e.g., Packed Bed) |
|---|---|---|
| Catalyst Contact | Suspended (slurry) or fixed baskets. | Typically fixed bed; occasionally fluidized bed. |
| Handling Complexity | High: Requires filtration/centrifugation for catalyst recovery. | Low: Catalyst remains contained within the reactor cartridge. |
| Reaction Uniformity | Potential for gradients in mixing, temperature, and concentration. | Superior control with consistent residence time and temperature. |
| Catalyst Lifetime Testing | Time-consuming; requires sequential batch runs. | Real-time data on deactivation; easier for long-term studies. |
| Scale-up Challenges | Mixing, heat transfer, and catalyst separation become significant. | More linear scale-up via numbering-up of reactor units. |
| Safety Profile | Larger inventory of reagents and catalysts. | Small internal volume minimizes hazardous material exposure. |
| Typical Catalyst Loading | 1-10 wt% relative to limiting reagent. | High effective loading due to constant presence in the flow path. |
| Applicability | Ideal for early-stage screening, multiphase kinetics studies, and reactions with solids formation. | Preferred for scalable, high-throughput, and hazardous (high P/T) transformations. |
Experimental Protocols for Catalyst Evaluation
Protocol 3.1: Standard Batch Catalyst Screening (Slurry Method)
Objective: To evaluate catalyst activity, selectivity, and reusability in a batch slurry system.
- Setup: Conduct reactions in a parallel pressure reactor station (e.g., 8-24 vial array) equipped with magnetic stirring.
- Catalyst Preparation: Weigh solid catalyst (e.g., 5-50 mg, 1-5 mol%) directly into each dry reaction vial. For air-sensitive catalysts (e.g., Pd/C, Ni complexes), employ a glovebox or Schlenk line.
- Reaction Mixture: Add solvent and substrates via syringe under an inert atmosphere (N₂/Ar). Seal vials.
- Reaction Execution: Heat to target temperature with constant stirring (≥500 rpm to avoid mass transfer limitations). Monitor pressure.
- Quenching & Separation: Cool reactor rapidly. Separate catalyst via micro-scale filtration (e.g., using a filter plate or syringe filter) or centrifugation (13,000 rpm, 2 min).
- Analysis: Analyze clarified reaction mixture by HPLC, GC, or LC-MS. Calculate conversion and selectivity.
- Reusability Test: Wash the recovered catalyst with appropriate solvent (3x), dry under vacuum, and reuse in a subsequent run following steps 2-6.
Protocol 3.2: Continuous Flow Packed-Bed Reactor Operation
Objective: To perform a heterogeneous catalytic reaction in a continuous flow packed-bed configuration.
- Reactor Packing:
- Use a stainless-steel or HPLC-column reactor (e.g., 10 mm ID x 100 mm length).
- Place a metal frit or glass wool plug at the bottom.
- Slurry-pack the catalyst (e.g., 0.5-2.0 g of immobilized enzyme or metal on support) with a compatible solvent using a slurry pump to ensure uniform bed density.
- Place a top frit and connect to the flow system (HPLC pump, sample injector, back-pressure regulator).
- System Conditioning: Prime the system with pure solvent at the intended flow rate (e.g., 0.1-2.0 mL/min) and operational pressure (e.g., 50-200 psi) until stable.
- Reaction Execution: Switch the feed to the substrate solution. Allow 3-5 residence volumes to pass to achieve steady state.
- Steady-State Sampling: Collect effluent product stream at precise time intervals after steady state is achieved.
- Analysis: Analyze samples periodically (e.g., every 30 min) to monitor conversion, selectivity, and catalyst stability over time (Time-on-Stream analysis).
- Shutdown: Flush the reactor with clean solvent, then depressurize and purge with inert gas.
Visualizing Workflows and Strategies
Diagram 1: Catalyst Screening Decision Pathway
Diagram 2: Continuous Packed-Bed Reactor Schematic
The Scientist's Toolkit: Key Research Reagent Solutions
Table 2: Essential Materials for Heterogeneous Catalyst Research
| Item | Function & Rationale |
|---|---|
| Parallel Pressure Reactors | Enables high-throughput screening of catalyst libraries under controlled, comparable conditions (temperature, pressure, stirring). |
| Catalyst Cartridges (Flow) | Pre-packed or custom-packable columns for fixed-bed continuous flow reactions, ensuring reproducible catalyst loading. |
| Back-Pressure Regulator (BPR) | Maintains system pressure above the solvent boiling point in flow systems, allowing superheated conditions. |
| Inert Atmosphere Glovebox | Essential for handling air- and moisture-sensitive catalysts (e.g., Raney Nickel, phosphine-ligated metals). |
| Micron-Scale Filter Plates / Syringe Filters | For rapid separation of catalyst from batch reaction mixtures with minimal loss of product or solvent. |
| Metal Scavengers | Functionalized resins (e.g., SiliaBond Thiol, QuadraPure) to remove trace metal catalyst leachates from post-reaction mixtures. |
| Supported Catalyst Libraries | Arrays of catalysts on solid supports (SiO₂, Al₂O₃, polymer, carbon) with varying metal loadings and ligands for screening. |
| Stabilized Metal Nanoparticles | Colloidal suspensions (e.g., Pd@C, Au/TiO₂) with defined particle size for reproducible catalysis and mechanistic study. |
Quantitative Data on System Performance
Table 3: Representative Performance Data: Batch vs. Continuous Flow for a Model Hydrogenation*
| Parameter | Batch Slurry Reactor (Pd/C, 1 wt%) | Continuous Packed-Bed Reactor (Pd/Al₂O₃) |
|---|---|---|
| Reaction Temperature | 50 °C | 80 °C |
| Pressure (H₂) | 5 bar | 10 bar |
| Catalyst Loading | 5 mg/mL reaction volume | 500 mg packed bed |
| Residence/Reaction Time | 120 min | 2.5 min |
| Space-Time-Yield (STY) | 0.15 gprod mLcat⁻¹ h⁻¹ | 12.8 gprod mLcat⁻¹ h⁻¹ |
| Conversion (Steady State) | >99% (per batch) | >99% (maintained for >48 h) |
| Catalyst Leaching | <0.5 ppm Pd in solution | <0.1 ppm Pd in effluent |
| Product Isolation | Requires filtration | Catalyst-free effluent stream |
*Model reaction: Hydrogenation of nitrostyrene to aminostyrene. Data compiled from recent literature (2023-2024).
Software and Modeling Tools for Predictive Troubleshooting and Process Intensification
This whitepaper examines software and modeling tools critical for predictive troubleshooting and process intensification within exploratory research comparing batch and continuous flow systems. The shift from traditional batch pharmaceutical manufacturing to continuous processing is a cornerstone of modern process intensification, offering potential benefits in yield, purity, safety, and sustainability. This transition, however, introduces new complexities in process design, control, and analysis. Predictive troubleshooting—the use of models and data to anticipate and mitigate process failures—becomes paramount. This guide details the computational frameworks, experimental protocols, and reagent toolkits enabling researchers to navigate this paradigm shift effectively.
Foundational Software and Modeling Platforms
The following platforms form the core of modern digital development and troubleshooting for intensified processes.
Table 1: Core Modeling and Simulation Software
| Software/Tool | Primary Function | Key Application in Flow/Batch Research | Licensing/Type |
|---|---|---|---|
| Aspen Plus/Custom Modeler | Steady-state & dynamic process simulation | Rigorous physico-chemical modeling of reaction kinetics, mass/energy balances for scale-up. | Commercial |
| COMSOL Multiphysics | Finite element analysis (FEA) & CFD | Modeling fluid dynamics, heat transfer, and mass transport in microreactors and unit operations. | Commercial |
| gPROMS (Siemens PSE) | Advanced process modeling & optimization | Detailed mechanistic modeling for design-space exploration and parameter estimation. | Commercial |
| Python (SciPy, NumPy, PyTorch) | Scientific computing & ML | Custom data analysis, kinetic parameter fitting, and development of surrogate ML models. | Open Source |
| MATLAB/Simulink | Algorithm development & system modeling | Control system design, state estimation, and digital twin prototyping. | Commercial |
| CADES (Continuous API Decision Engine) | Platform-specific flow synthesis design | Automated route scouting and equipment configuration for API synthesis. | Platform-Specific |
Table 2: Data Infrastructure & Digital Twin Tools
| Tool Category | Example Tools | Role in Predictive Troubleshooting |
|---|---|---|
| Process Historians | OSIsoft PI, Aveva | Aggregates real-time sensor data (temp, pressure, pH, PAT) for batch/flow comparison. |
| Multivariate Analysis (MVA) | SIMCA, JMP | Identifies correlations and critical process parameters (CPPs) from high-dimensional data. |
| Machine Learning Platforms | DataRobot, H2O.ai | Builds predictive models for fault detection (e.g., clogging, catalyst decay) and quality prediction. |
| LIMS/ELN | LabVantage, Benchling | Tracks experimental metadata, linking process conditions to analytical outcomes for model training. |
Experimental Protocol for Model-Calibration and Troubleshooting
This protocol outlines a method for generating data to calibrate a predictive model for a key reaction step, enabling direct comparison between batch and flow modes.
Title: Comparative Kinetics and Parameter Estimation for Batch vs. Flow Synthesis
Objective: To determine reaction kinetics and identify failure modes for a model API synthesis step in both batch and continuous flow reactors, enabling the creation of a calibrated predictive model.
Materials: See "The Scientist's Toolkit" below.
Procedure:
Part A: Batch Reactor Experiments
- Setup: Charge the jacketed glass batch reactor with solvent (e.g., MeCN, 100 mL). Begin stirring and temperature control via circulating bath.
- Initialization: Add substrate A. Allow the system to reach thermal equilibrium at setpoint T1 (e.g., 30°C).
- Reaction Initiation: Rapidly add reagent B (solid or solution) at time t=0.
- In-line Monitoring: Use the in-situ FTIR probe or automated sampler coupled to UHPLC to measure concentrations of A, B, and product P at regular intervals (e.g., 1, 2, 5, 10, 15, 30, 60 min).
- Replication: Repeat steps 1-4 at minimum three additional temperatures (e.g., 40, 50, 60°C) and two stirring speeds to assess mass transfer limitations.
- Deliberate Perturbation (Troubleshooting Data): Repeat at optimal temperature with introduced "faults": 10% excess of B, 5°C temperature overshoot, simulated 10% impurity spike in A.
Part B: Continuous Flow Reactor Experiments
- Setup: Prime the HPLC pumps for feeds of A and B in solvent. Connect to a temperature-controlled tubular reactor (PFA, 10 mL volume) equipped with a back-pressure regulator (BPR).
- Steady-State Operation: Set total flow rate for a desired residence time (τ). Allow system to stabilize for >5 residence times.
- Steady-State Sampling: Collect triplicate effluent samples for UHPLC analysis once steady state is confirmed by consistent UV/PAT signal.
- Design of Experiments (DoE): Vary key parameters systematically using a DoE (e.g., Central Composite Design) across ranges: residence time (τ), temperature (T), and molar ratio (A:B).
- Induced Failure Modes: Deliberately induce and monitor failure scenarios: a) Gradual reduction of pump B flow rate to simulate pump failure, b) Step increase in temperature setpoint to simulate controller fault, c) Introduction of a particulate suspension to assess clogging dynamics via pressure sensor.
Part C: Data Integration & Model Building
- Parameter Estimation: Use the batch concentration-time data in Python/gPROMS to fit parameters (k, Ea) for candidate rate laws (e.g.,
r = k[A]^α[B]^β). - Flow Model Validation: Implement the calibrated kinetic model into a CFD or plug-flow reactor (PFR) model. Simulate the flow DoE conditions and compare predicted vs. experimental conversion/yield.
- Surrogate Model Training: Use the combined batch/flow experimental data (including fault data) to train a machine learning model (e.g., Random Forest or Neural Network) to predict yield and classify operational state (normal/clogged/degraded).
- Digital Twin Deployment: Integrate the validated mechanistic or surrogate model with a real-time data stream from a flow reactor to create a predictive digital twin for online troubleshooting and control.
System Visualization and Logical Workflows
Diagram 1: Predictive Model Development Workflow
Diagram 2: Digital Twin for Predictive Troubleshooting
The Scientist's Toolkit: Essential Research Reagent Solutions
Table 3: Key Research Reagents and Materials for Comparative Studies
| Item | Function & Specification | Relevance to Predictive Troubleshooting |
|---|---|---|
| Model API Substrates (e.g., 1,3-cyclohexanedione, phenyl boronic acid derivatives) | Well-characterized, safe compounds for benchmarking reactions (e.g., aldol, Suzuki coupling). | Provides a standardized system to compare batch/flow kinetics and generate reliable training data for models. |
| Stable Isotope-Labeled Reagents (¹³C, ²H) | Enables precise tracking of reaction pathways and intermediate formation via advanced analytics (NMR, MS). | Crucial for elucidating complex kinetics and mechanism changes between batch and flow regimes. |
| Solid-Supported Reagents & Catalysts (e.g., polymer-bound catalysts, immobilized enzymes) | Facilitates heterogeneous catalysis and reagent scavenging in flow. | Key for process intensification; models must account for solid-liquid kinetics and deactivation. |
| Process Analytical Technology (PAT) Probes (ReactIR, FBRM, UV/Vis flow cells) | In-situ monitoring of concentration, particle size, and spectral changes. | Provides high-frequency, time-series data essential for dynamic model calibration and real-time fault detection. |
| Calibrated Impurity Spikes | Solutions of known degradants or side-products at precise concentrations. | Used in deliberate fault experiments to train ML models to recognize and diagnose impurity events. |
| Chemically Resistant Flow Components (PFA tubing, SiC microreactors, corrosion-resistant BPRs) | Enables operation across a wide range of conditions (T, P, solvent). | Understanding equipment limits and failure modes (clogging, corrosion) is a direct input to troubleshooting guides. |
| Advanced Heat Transfer Fluids (e.g., perfluorinated polyethers) | Provides precise, high-temperature or low-temperature control for jacketed reactors. | Accurate thermal modeling depends on known and controlled boundary conditions. |
Data-Driven Decisions: Comparative Analysis of Yield, Purity, and Sustainability Metrics
This whitepaper provides an in-depth technical comparison of critical performance metrics—yield, selectivity, and space-time-yield (STY)—for key reaction types, framed within the ongoing exploratory research into batch versus continuous flow systems. As the pharmaceutical industry seeks greater efficiency and sustainability, understanding these metrics is paramount for process development scientists and researchers. This guide consolidates current data, protocols, and tools to inform rational reactor and process selection.
Exploratory research in chemical synthesis must balance the need for rapid screening with the generation of scalable, high-quality data. Batch reactors have been the traditional workhorse, offering simplicity and familiarity. Continuous flow systems, however, introduce enhanced mass/heat transfer, precise residence time control, and improved safety for hazardous reactions. The choice between systems directly impacts the core metrics of yield (conversion of reactant to desired product), selectivity (preference for desired product over byproducts), and space-time-yield (mass of product per unit reactor volume per time). This document analyzes these metrics across reaction classes to guide decision-making.
Core Metrics: Definitions and Impact
- Yield: The practical measure of reaction efficiency, often reported as isolated yield. High yield minimizes raw material waste and cost.
- Selectivity: Critical in complex molecular syntheses (e.g., APIs), where regio-, chemo-, or stereoselectivity dictates purity and downstream processing complexity.
- Space-Time-Yield (STY): A measure of reactor productivity, calculated as (mass of product) / (reactor volume * time). It is a key differentiator for process intensification and scaling.
Quantitative Comparison of Key Reaction Types
The following table summarizes representative data from recent literature comparing optimized batch and continuous flow performances for common reaction types relevant to drug development.
Table 1: Performance Metrics for Key Reaction Types in Batch vs. Flow Systems
| Reaction Type | Example Transformation | Typical Optimal System | Yield (%) | Selectivity (%) | Space-Time-Yield (kg L⁻¹ h⁻¹) | Key Advantage Cited |
|---|---|---|---|---|---|---|
| Suzuki-Miyaura Coupling | Aryl halide + Boronic acid → Biaryl | Continuous Flow | 95-99 (Flow) | >99 (Flow) | 0.15 - 0.4 (Flow) | Superior heat transfer enables precise temperature control, improving selectivity & yield. |
| Traditional Batch | 85-92 (Batch) | 90-95 (Batch) | 0.02 - 0.08 (Batch) | |||
| Photoredox Catalysis | C-H functionalization | Continuous Flow (Microreactor) | 80-92 (Flow) | High (Flow) | 0.05 - 0.2 (Flow) | Uniform photon flux & thin film illumination drastically increase photonic efficiency. |
| Batch (Round-bottom flask) | 40-70 (Batch) | Moderate (Batch) | 0.005 - 0.02 (Batch) | |||
| Exothermic Nitration | Aromatic nitration | Continuous Flow (CSTR or Tube) | 90-95 (Flow) | 85-90 (Flow) | 0.8 - 1.5 (Flow) | Exceptional thermal control prevents runaway reactions and byproducts (di-nitration). |
| Batch (Jacketed Reactor) | 88-92 (Batch) | 75-82 (Batch) | 0.1 - 0.3 (Batch) | |||
| High-Temperature/Pressure | Cycloaddition (e.g., Diels-Alder) | Continuous Flow (Plug Flow Reactor) | 90-98 (Flow) | >98 (Flow) | 0.5 - 1.2 (Flow) | Safe containment of extreme conditions enables faster kinetics and cleaner profiles. |
| Batch (Pressure Reactor) | 85-94 (Batch) | 90-96 (Batch) | 0.15 - 0.4 (Batch) | |||
| Enzymatic Biocatalysis | Asymmetric ketone reduction | Continuous Packed-Bed Reactor | 96-99 (Flow) | >99.5 ee (Flow) | 0.3 - 0.7 (Flow) | Enzyme immobilization & continuous operation enhance stability and productivity. |
| Batch (Stirred-Tank) | 92-98 (Batch) | >99 ee (Batch) | 0.08 - 0.2 (Batch) |
Detailed Experimental Protocols
Protocol: Continuous Flow Suzuki-Miyaura Coupling for High STY
Objective: To achieve high-yield, selective biaryl synthesis with intensified productivity. Materials: See "The Scientist's Toolkit" (Section 6). Procedure:
- Solution Preparation: Prepare separate 0.5 M solutions of aryl halide (e.g., 4-bromoanisole) and boronic acid (e.g., phenylboronic acid) in a 1:1 mixture of THF and 2 M aqueous K₂CO₃. Prepare a 2 mol% solution of Pd(PPh₃)₄ catalyst in the same solvent mixture.
- Flow System Setup: Assemble a continuous flow system comprising two syringe pumps (for reagents and catalyst), a T-mixer, a temperature-controlled PFA tubing reactor (10 mL internal volume, 1 mm ID), and a back-pressure regulator (BPR) set to 50 psi.
- Reaction Execution: Flow the combined reagent stream and catalyst stream via the T-mixer at a combined flow rate of 2 mL/min (residence time = 5 min). Maintain reactor temperature at 100°C.
- Work-up & Analysis: Collect the output stream directly into a stirred flask containing aqueous Na₂EDTA solution to quench and sequester Pd. Extract with ethyl acetate, dry over MgSO₄, and concentrate. Analyze purity by HPLC and calculate isolated yield after purification.
Protocol: Batch vs. Flow Photoredox Catalysis Comparison
Objective: To compare yield and STY for a model decarboxylative coupling. Materials: Substrate (e.g., N-phthaloyl amino acid), [Ir(dF(CF₃)ppy)₂(dtbbpy)]PF₆ photocatalyst, acceptor (e.g., styrene), DIPEA, DMF, batch photoreactor with blue LEDs, continuous flow photoreactor (immersion well or microchannel chip). Procedure:
- Batch Condition: Charge a 25 mL batch photoreactor vial with substrate (0.1 mmol), photocatalyst (1 mol%), acceptor (1.5 equiv), and DIPEA (2 equiv) in 10 mL DMF. Purge with N₂, seal, and irradiate with 450 nm LEDs (30 W) for 18 hours with stirring.
- Flow Condition: Prepare a 0.01 M substrate solution with all reagents in DMF. Use a syringe pump to flow through a transparent FEP microreactor (channel depth: 500 µm) coiled around a 450 nm LED source. Set flow rate for a 30 min residence time.
- Analysis: For both outputs, remove solvent and purify via flash chromatography. Compare isolated yields. Calculate STY using reactor volume (batch: 25 mL; flow: 0.5 mL) and total processing time (including irradiation/residence time).
Visualizations: Workflows and System Logic
Title: Decision Workflow for Batch vs. Flow Process Development
Title: Continuous Flow Suzuki-Miyaura Coupling Setup
The Scientist's Toolkit: Key Research Reagent Solutions
Table 2: Essential Materials for Batch vs. Flow Exploratory Research
| Item / Reagent | Function in Research | Application Notes |
|---|---|---|
| Palladium Catalysts (e.g., Pd(PPh₃)₄, Pd(dtbpf)Cl₂) | Facilitates cross-coupling reactions (Suzuki, Heck). | Flow systems often use immobilized versions or homogeneous catalysts with in-line scavengers. |
| Photoredox Catalysts (e.g., [Ir(dF(CF₃)ppy)₂(dtbbpy)]PF₆, Ru(bpy)₃Cl₂) | Absorbs light to initiate single-electron transfer (SET) processes. | Crucial for photochemistry; flow enables efficient irradiation. |
| Immobilized Enzymes (e.g., CAL-B Lipase on Resin) | Biocatalysts for selective transformations. | Enables continuous packed-bed reactor operation, enhancing stability and reusability. |
| Perfluorinated Alkoxy (PFA) or Fluorinated Ethylene Propylene (FEP) Tubing | Chemically inert tubing for continuous flow reactors. | Resists a wide range of solvents and reagents, suitable for exploratory chemistry. |
| Microstructured Reactor Chips (Glass or Silicon) | Provides high surface-area-to-volume ratio for excellent heat/mass transfer. | Ideal for fast, exothermic, or photochemical reactions in screening. |
| Back-Pressure Regulator (BPR) | Maintains system pressure above solvent boiling point in flow systems. | Allows use of solvents above their normal boiling point, expanding reaction scope. |
| Syringe or HPLC Pumps (Precision) | Delivers precise, pulseless flow of reagents. | Foundational for reproducible residence times and stoichiometry in flow. |
| In-line IR or UV-Vis Analyzer | Provides real-time reaction monitoring. | Enables rapid kinetic profiling and endpoint determination in flow systems. |
Exploratory research in pharmaceutical process development is fundamentally concerned with route scouting, optimization, and selection. A critical, parallel track in this research is the environmental impact assessment of candidate processes, which informs the choice between traditional batch and emerging continuous flow systems. This guide details the core metrics—E-Factor, Solvent Consumption, and Energy Use—providing a technical framework for their application within this comparative research paradigm.
Core Metrics: Definitions and Calculations
Process Mass Intensity (PMI) & E-Factor: These are the primary metrics for measuring material efficiency and waste generation.
- PMI: Total mass of materials (kg) used per kg of product.
- E-Factor: Total mass of waste (kg) generated per kg of product. Waste is defined as everything except the desired product.
- Relationship: E-Factor = PMI - 1. The ideal E-Factor is 0.
Solvent Consumption: Solvents typically constitute 80-90% of the total mass input in pharmaceutical synthesis. Reduction is a primary green chemistry objective.
- Metric: Often expressed as kg of solvent per kg of product, or integrated into PMI/E-Factor.
- Solvent Selection Guides: Tools like the CHEM21 Selection Guide or GSK's Solvent Sustainability Guide provide environmental, health, and safety (EHS) rankings to inform choice.
Cumulative Energy Demand (CED): The total direct and indirect energy use throughout a chemical process, from raw material extraction to final isolation. It is measured in MJ per kg of product and is a critical differentiator between batch and flow systems.
Quantitative Comparison: Batch vs. Continuous Flow
The following table synthesizes current data from recent comparative studies in API synthesis, highlighting trends in environmental metrics.
Table 1: Comparative Environmental Metrics for Batch vs. Continuous Flow Synthesis
| Metric | Typical Batch Process Range | Typical Continuous Flow Process Range | Key Drivers of Difference |
|---|---|---|---|
| PMI | 50 - 200 kg/kg | 20 - 100 kg/kg | Superior mass & heat transfer in flow allows for higher concentrations, reduced solvent volumes, and higher yields. |
| E-Factor | 49 - 199 kg/kg | 19 - 99 kg/kg | Directly derived from PMI. Reduced solvent and reagent use in flow lowers waste. |
| Solvent Consumption | High (Major PMI component) | Moderate to Low | Flow enables solvent-minimized conditions (e.g., telescoped reactions, in-line workup). |
| Energy Use (CED) | High (1000 - 5000 MJ/kg) | Moderate (500 - 2500 MJ/kg) | Flow's small reactor volume reduces heating/cooling energy. Steady-state operation eliminates repeated energy cycles. |
| Reaction Time | Hours to Days | Minutes to Hours | Enhanced kinetics due to improved control and the potential for "forbidden" conditions (high T/p). |
Experimental Protocols for Impact Assessment
Protocol 1: Determining Process E-Factor in Exploratory Route Scouting
- Material Accounting: Record masses of all input materials (reagents, catalysts, solvents) for a given reaction step or sequence.
- Product Mass: Precisely measure the mass of isolated, dried product.
- Waste Calculation: Sum the masses of all input materials and subtract the mass of the isolated product. (Alternative: Sum masses of all known waste streams, including aqueous layers, solid filter cakes, and spent solvents).
- Calculation: E-Factor = (Total Waste Mass, kg) / (Product Mass, kg).
Protocol 2: Measuring Energy Demand for a Laboratory Synthesis
- Equipment Profiling: Measure the power draw (in kW) of key equipment (hotplate/stirrer, HPLC, rotary evaporator) using a plug-in energy meter under typical operating conditions.
- Operational Logging: For each experimental run, meticulously log the active operating time for each piece of equipment.
- Energy Calculation: Calculate energy use per run (kWh) = Σ (Power of Equipment * Time). Convert to MJ (1 kWh = 3.6 MJ).
- Normalization: Express as Cumulative Energy Demand (CED) = (Total Energy for Run, MJ) / (Mass of Product, kg).
Protocol 3: Solvent Intensity & Selection Assessment
- Inventory: List all solvents used in the process, noting volumes and recycling/recovery rates.
- Mass Calculation: Convert volumes to masses using solvent densities.
- Intensity Metric: Calculate total solvent mass per kg of product.
- EHS Scoring: Cross-reference each solvent against a recognized guide (e.g., CHEM21). Assign a cumulative penalty score based on waste, environmental impact, health, and safety.
Visualization of Research Decision Pathways
Title: Decision Pathway for Environmental Assessment in Process Research
The Scientist's Toolkit: Key Research Reagent Solutions
Table 2: Essential Materials for Environmental Impact Assessment Studies
| Item / Reagent Solution | Function in Assessment |
|---|---|
| Plug-in Energy Meter | Measures real-time power draw (kW) and cumulative energy (kWh) of lab equipment for CED calculation. |
| Sustainable Solvent Selection Guide (e.g., CHEM21) | Provides ranked list of solvents based on EHS criteria to guide greener solvent choice during route scouting. |
| Process Mass Intensity (PMI) Calculator | Standardized spreadsheet or software tool for tracking all material inputs and outputs to compute PMI/E-Factor. |
| Laboratory Continuous Flow Reactor System | Modular unit (pumps, micro/mesofluidic reactor chip, temperature/pressure controls) for comparative flow chemistry studies. |
| In-line Analytical Probe (e.g., FTIR, UV) | Enables real-time reaction monitoring in flow, critical for optimizing yields and minimizing waste generation. |
| High-Performance Liquid Chromatography (HPLC) | Essential for determining reaction yield, conversion, and purity, which are direct inputs for mass efficiency calculations. |
| Life Cycle Inventory (LCI) Database | Source of pre-calculated energy and environmental impact data for raw materials (e.g., Ecoinvent, Gabi). |
Analysis of Operational Flexibility, Campaign Costs, and Capital Expenditure
Thesis Context: This analysis is framed within an exploratory research thesis comparing batch and continuous flow systems in pharmaceutical development and manufacturing. The shift towards continuous processing represents a paradigm change, demanding rigorous evaluation of operational, economic, and capital investment factors.
Quantitative Analysis of System Modalities
The following tables synthesize current data on the comparative performance of batch and continuous flow systems.
Table 1: Operational Flexibility and Performance Metrics
| Metric | Batch System | Continuous Flow System | Key Implication |
|---|---|---|---|
| Campaign Changeover Time | 2-6 weeks | 2-48 hours | Drastically reduced downtime in flow. |
| Typical Campaign Length | 1-12 months | 6-24 months (steady-state) | Longer campaigns amortize setup costs. |
| Scale-up Timeline (Lab to Production) | 2-5 years | 1-3 years | Reduced scale-up risk with numbering-up. |
| Equipment Footprint (Relative) | 1x (Baseline) | 0.1x - 0.5x | Significant facility space reduction. |
| Process Mass Intensity (PMI) | Higher (Baseline) | 20-80% reduction | Improved sustainability & lower waste handling. |
| Operational Flexibility Type | Campaign-based, high product variety | Dedicated, high volume, or platform molecules | Flow suits targeted, high-demand products. |
Table 2: Cost and Capital Expenditure (CapEx) Comparison
| Cost Category | Batch System | Continuous Flow System | Notes |
|---|---|---|---|
| Typical Initial Capital Investment (CapEx) | High (Large vessels, facility) | Variable (Can be lower unit-wise, high tech cost) | Flow CapEx shifts to sophisticated skids/controls. |
| Working Capital (Inventory) | High (Large intermediate batches) | Very Low (Small hold-up volume) | Major financial benefit for flow systems. |
| Cost of Goods Sold (COGS) Impact | Dominated by labor & overhead | Dominated by raw materials | Automation reduces variable labor costs. |
| Campaign-Specific Costs (Cleaning, QC) | High per campaign | Low per unit time, amortized | Continuous validation reduces per-batch QA costs. |
| R&D Investment Required | Traditional, well-understood | Higher initial process engineering | Flow requires upfront R&D, yielding downstream benefits. |
Experimental Protocols for Comparative Research
To generate the data points referenced above, the following core experimental methodologies are employed in exploratory research.
Protocol 1: Dynamic Capacity Utilization Analysis
- Objective: Quantify operational flexibility by measuring changeover efficiency and capacity utilization rates.
- Methodology:
- Setup: Instrument a pilot-scale batch reactor train and a continuous flow skid for a model API synthesis.
- Procedure: Execute three consecutive campaigns of different products on each system.
- Data Collection: Precisely log (a) End-of-campaign to start-of-next-campaign time (downtime), (b) Active processing time, and (c) Time to reach steady-state specification (for flow).
- Analysis: Calculate Effective Equipment Utilization (%) = (Active Processing Time / Total Campaign Time) * 100.
Protocol 2: Total Cost Modeling for Technology Selection
- Objective: Develop a granular cost model encompassing CapEx, OpEx, and campaign costs.
- Methodology:
- CapEx Estimation: Perform itemized quotation for both systems (e.g., reactor vessels, CIP systems, flow skids, pumps, sensors, control hardware/software).
- Operational Cost Tracking: Run a material balance for a target annual output. Track (a) Raw material consumption, (b) Labor hours (direct/indirect), (c) Utilities (solvent recycling impact), (d) Quality control sample numbers, and (e) Waste disposal volumes.
- Model Integration: Use Net Present Value (NPV) or similar financial model over a 10-year horizon, incorporating discount rates and maintenance costs.
Visualizations
Diagram Title: Decision Logic for Batch vs. Flow System Selection
Diagram Title: Comparative Cost Model Structure for Batch vs. Flow
The Scientist's Toolkit: Research Reagent & Equipment Solutions
Table 3: Essential Research Tools for Comparative Systems Research
| Item | Function in Research | Application Notes |
|---|---|---|
| Microreactor/Capillary Flow Skid | Enables lab-scale continuous reaction screening with precise residence time control. | Used for kinetic studies and parameter optimization for flow processes. |
| PAT Probes (FTIR, Raman) | In-line monitoring of reaction progress and intermediate detection in both batch and flow. | Critical for real-time understanding and control, especially in flow. |
| Automated Liquid Handling & Sampling | Enables high-throughput experimentation (HTE) for condition screening in batch mode. | Accelerates DOE for both systems, but essential for batch optimization. |
| Back Pressure Regulator (BPR) | Maintains system pressure above boiling point of solvents in flow systems. | Key for enabling high-temperature continuous reactions. |
| Static Mixer Elements | Provides rapid, efficient mixing of reagents in a continuous stream. | Crucial for achieving fast, homogeneous mixing in milliseconds. |
| Process Modeling Software | Simulates mass/energy balance, kinetics, and economic models for both systems. | Used for in-silico comparison of CapEx, OpEx, and performance. |
| CIP (Clean-in-Place) Test Rigs | Quantifies cleaning time and solvent usage for changeover studies. | Directly measures a major component of campaign cost and downtime. |
Regulatory Considerations for Continuous Manufacturing in Pharmaceutical Submissions
This whitepaper addresses the critical regulatory landscape for Continuous Manufacturing (CM) in pharmaceutical submissions, framed within the broader thesis of exploratory research comparing batch and continuous flow systems. As the industry moves toward advanced manufacturing paradigms, understanding regulatory expectations is paramount for successful drug development and approval.
Current Regulatory Framework and Quantitative Landscape
Regulatory agencies, including the U.S. FDA, EMA, and ICH, have developed evolving guidelines to support the implementation of CM. The following table summarizes key quantitative data and regulatory milestones.
Table 1: Regulatory Milestones and Adoption Metrics for Continuous Manufacturing
| Aspect | Data / Metric | Source / Significance |
|---|---|---|
| FDA Approvals (CM) | >20 approved NDAs/MAAs as of 2024 | FDA Emerging Technology Program |
| FDA CDER Projects | ~60% increase in CM-related meetings (2021-2023) | FDA Annual Report |
| Key ICH Guideline | ICH Q13 on Continuous Manufacturing (Finalized 2022) | International harmonization for development and control |
| Typical Review Times | Comparable to batch; potential for reduced timeline due to richer data | Industry case studies |
| Real-Time Release Testing (RTRT) Adoption | >80% of CM applications incorporate some form of RTRT | Regulatory submissions analysis |
| Common CM Technologies | 45% Direct Compression, 30% Hot Melt Extrusion, 25% Wet Granulation | Industry survey data |
Core Regulatory Considerations: A Detailed Guide
Control Strategy and Real-Time Assurance
The control strategy for CM must be more dynamic and risk-based than for batch. It relies heavily on Process Analytical Technology (PAT) for real-time monitoring and control. The foundation is defined in ICH Q10 and elaborated in ICH Q13.
Experimental Protocol 1: Establishing a PAT-Based Control Loop for a Continuous Blender
- Objective: To demonstrate real-time content uniformity control using NIR spectroscopy.
- Materials: Continuous powder blender, API, Excipients, NIR probe interfaced with PLC.
- Method:
- Calibration Model Development: Prepare blends with known API concentrations (70-130% of target). Acquire NIR spectra. Use multivariate analysis (e.g., PLS) to develop a calibration model correlating spectral data to concentration.
- Integration & Control Logic: Integrate the NIR probe into the blender outlet. Set control limits for API concentration (e.g., 95-105%). Program the PLC to adjust feeder speeds if the NIR-predicted concentration trends outside control limits.
- Challenge Test: Introduce deliberate feeder disturbances (e.g., ±10% feeder rate change). Record the system's ability to detect the deviation via NIR and automatically correct feeder rates to maintain output within specifications.
- Data Collection: Continuously log NIR spectra, predicted concentration, feeder speeds, and controller actions.
- Regulatory Submission Focus: Document the model validity, control algorithm, and results of challenge tests to prove the control loop's robustness.
Process Validation and Lifecycle Approach
Regulators endorse a lifecycle approach (Stage 1: Process Design, Stage 2: Process Qualification, Stage 3: Continued Process Verification) per FDA guidance and ICH Q12. For CM, this involves extensive use of modeling and simulation.
Experimental Protocol 2: Using Residence Time Distribution (RTD) for Scale-up and Qualification
- Objective: To characterize the mixing dynamics and establish equivalence between clinical and commercial scale CM lines using RTD.
- Materials: CM system (e.g., twin-screw granulator), tracer material (e.g., MgStearate with dye), UV-Vis spectrometer or PAT tool for detection.
- Method:
- Pulse Injection Experiment: At steady-state operation, inject a small, sharp pulse of tracer into the feed stream.
- Outlet Measurement: Continuously measure tracer concentration at the process outlet using a suitable PAT method.
- Data Analysis: Plot tracer concentration vs. time to obtain the RTD curve (E(t) curve). Calculate key parameters: mean residence time (MRT) and variance (σ²).
- Modeling: Fit the data to a tanks-in-series or dispersion model. Use the model to predict the distribution of material ages within the system, critical for understanding the fate of disturbances.
- Scale-up: Perform identical experiments on different equipment scales. Demonstrate equivalent RTD profiles, ensuring consistent mixing and material transport dynamics.
- Regulatory Submission Focus: Submit RTD models and data as part of the process understanding package. Use it to define the "state of control" and to set criteria for the handling of transient events (e.g., start-up, shutdown, feeder disturbances).
Handling of Transients, Start-up, and Shutdown
A distinct regulatory consideration for CM is the management of material produced during non-steady-state periods.
Experimental Protocol 3: Defining and Testing a Proven Acceptable Range (PAR) for Start-up
- Objective: To define the duration and conditions of start-up before steady-state is achieved and to establish the disposition of material produced during this period.
- Materials: Full CM line, PAT tools for critical quality attributes (CQAs).
- Method:
- Define Start-up Procedure: Establish a fixed, automated sequence for equipment activation, feed initiation, and ramp-up to target rates.
- Instrumentation: Place PAT probes at strategic unit operations to monitor CQAs (e.g., blend uniformity, tablet hardness) from time zero.
- Multiple Runs: Execute the start-up procedure multiple times (n≥3). Continuously sample and test material from the outlet until all PAT signals and unit operation parameters stabilize.
- Data Analysis: Plot CQAs vs. time. Statistically determine the time point (Tss) at which all attributes consistently meet specifications. The period 0 to Tss is the start-up transient.
- Material Disposition Strategy: Based on data, justify whether transient material is diverted to waste, reprocessed, or, if data supports, included in the batch. The strategy must be predefined and validated.
- Regulatory Submission Focus: Clearly document the start-up/shutdown SOPs, the data justifying T_ss, and the scientifically sound material disposition strategy.
Visualization of Regulatory and Scientific Workflows
Diagram Title: PAT-Enabled Control Strategy in CM
Diagram Title: CM Process Validation Lifecycle (ICH Q13)
The Scientist's Toolkit: Key Research Reagent Solutions
Table 2: Essential Materials for CM Research and Development
| Item | Function in CM Research | Example/Notes |
|---|---|---|
| Tracer Materials (e.g., Colored API surrogate, MgStearate with dye) | Used in Residence Time Distribution (RTD) studies to characterize mixing efficiency, holdup mass, and identify dead zones in continuous equipment. | Must be chemically inert and easily detectable (UV, NIR, visual). |
| PAT Calibration Standards | Precisely prepared mixtures of API and excipients at known concentrations for developing and validating NIR, Raman, or other spectroscopic models for real-time monitoring. | Range should cover 70-130% of target concentration to model disturbances. |
| Engineered Excipients (e.g., silicified microcrystalline cellulose) | Provide consistent and superior flow properties, which are critical for reliable feeding in continuous powder processes, reducing variability. | Key CMA for robust process performance. |
| Model APIs (e.g., Acetaminophen, Caffeine) | Well-characterized, safe-to-handle active substances used in feasibility studies, equipment testing, and protocol development before using the actual development compound. | Allows for de-risking and optimization. |
| Process Modeling Software | Digital tools for designing flowsheets, simulating mass/energy balance, and performing computational fluid dynamics (CFD) to predict process behavior. | gPROMS FormulatedProducts, ANSYS, COMSOL. |
| Data Analytics Platform | Software for multivariate analysis of PAT data, statistical process control (SPC), and handling large, continuous datasets generated by CM processes. | MATLAB, SIMCA, Python (SciKit-learn), JMP. |
Integrating Continuous Manufacturing into pharmaceutical submissions requires a proactive, science-and-risk-based regulatory strategy centered on deep process understanding, advanced control strategies, and a holistic lifecycle approach. The exploratory research comparing batch and continuous systems conclusively demonstrates that while the regulatory framework is demanding, it is supportive and clearly defined in guidelines like ICH Q13. Success hinges on early and transparent engagement with regulators through programs like the FDA's Emerging Technology Program, coupled with robust data generation from well-designed experiments as outlined in this guide.
This whitepaper examines the paradigm shift from batch to continuous manufacturing (CM) within the pharmaceutical industry, framed by exploratory research into their comparative advantages. The core thesis posits that while pure continuous flow systems offer significant theoretical benefits in efficiency, quality, and footprint, the immediate and pragmatic future lies in the strategic implementation of Hybrid Systems as a critical stepping stone toward fully End-to-End Integrated Continuous Manufacturing (ICM). This evolution addresses the technical, regulatory, and cultural complexities inherent in transforming established pharmaceutical production paradigms.
The Hybrid System Paradigm: Bridging Batch and Continuous
Hybrid systems selectively integrate continuous unit operations with traditional batch steps, mitigating risk while accruing benefits. Common architectures involve continuous upstream synthesis or bioprocessing coupled with batch purification, or vice-versa.
Key Experimental Protocol: Residence Time Distribution (RTD) Analysis for Hybrid Characterization
Objective: To characterize the mixing and flow behavior of a hybrid system, ensuring it meets the regulatory definition of "continuous" and identifying potential segregation (i.e., batch-like behavior).
Methodology:
- Tracer Selection: A non-reactive tracer (e.g., saline solution, acetone, or a fluorescent dye like riboflavin) is chosen that does not affect process chemistry and is easily detectable.
- Injection: A sharp, pulse input of the tracer is introduced into the feed stream at time t=0.
- Detection: An in-line or at-line analytical probe (e.g., UV-Vis, conductivity, PAT) measures tracer concentration C(t) at the outlet of the unit operation or system.
- Data Processing: The RTD function E(t) is calculated: E(t) = C(t) / ∫₀^∞ C(t)dt. Key metrics are derived:
- Mean Residence Time (τ): τ = ∫₀^∞ tE(t)dt
- Variance (σ²): σ² = ∫₀^∞ (t-τ)²E(t)dt
- Bo (Bodenstein) Number: Bo = (uL)/D_ax, estimated from RTD shape, indicating dispersion.
Quantitative Comparison: Batch vs. Hybrid vs. Continuous
Table 1: Comparative Analysis of Manufacturing Modalities for a Monoclonal Antibody (mAb) Process
| Metric | Traditional Batch | Hybrid (Continuous Upstream + Batch Downstream) | Fully Integrated Continuous |
|---|---|---|---|
| Campaign Duration | ~30 days | ~18 days | ~20-40 days (perpetual) |
| Volumetric Productivity | 0.5 – 1 g/L/day | 1 – 3 g/L/day | 2 – 5 g/L/day |
| Bioreactor Scale | 10,000 – 20,000 L | 500 – 2,000 L (N-1 perfusion) | 200 – 500 L (Perfusion) |
| Buffer Consumption | ~10,000 L/kg mAb | ~7,000 L/kg mAb | ~3,000 L/kg mAb |
| Facility Footprint | Large (Multiple suites) | Moderate (Reduced bioreactor scale) | Small (Single train, skid-based) |
| Process Data Points | Low (End-point testing) | Medium (PAT at key steps) | High (Real-time, multivariate) |
End-to-End Integrated Continuous Manufacturing (ICM)
ICM connects all unit operations—from raw material input to final drug product—into a single, uninterrupted process train. This requires advanced process analytical technology (PAT), real-time release testing (RTRT), and robust control strategies.
Experimental Protocol: PAT-Based Closed-Loop Control for Direct Compression
Objective: To maintain critical quality attributes (CQA) of a tablet in a continuous direct compression line via real-time feedback control.
Methodology:
- PAT Integration: A near-infrared (NIR) probe is installed on the feed frame of the tablet press to collect spectra of the powder blend before compression.
- Model Calibration: A multivariate calibration model (e.g., PLS regression) is developed offline correlating NIR spectra to API concentration.
- Control Logic: The measured API concentration is fed to a PID (Proportional-Integral-Derivative) controller.
- Actuation: The controller adjusts the feed rate of the API or excipient loss-in-weight feeders to correct any deviation from the target concentration.
- Verification: Periodically, tablets are sampled for offline reference analysis (e.g., HPLC) to validate and update the PAT model.
ICM Architecture and Control Logic
The Scientist's Toolkit: Key Research Reagent Solutions
Table 2: Essential Materials for Hybrid/Continuous Flow Chemistry Research
| Reagent/Category | Function in Research | Example/Note |
|---|---|---|
| Immobilized Enzymes/Catalysts | Enable continuous biocatalysis/chemocatalysis in packed-bed reactors (PBRs). | Immobilized Candida antarctica Lipase B (CAL-B); Pd on porous polymer supports. |
| Solid-Supported Reagents & Scavengers | Facilitate telescoped reactions by removing impurities inline without quenching. | Polymer-supported phosphazene bases; quadrapure TU metal scavengers. |
| Continuous Flow Photoredox Catalysts | Drive photochemical reactions with efficient, consistent light penetration. | [Ir(dF(CF₃)ppy)₂(dtbbpy)]PF₆; organic dyes like Eosin Y. |
| PAT Calibration Standards | Develop and validate in-line sensors (NIR, Raman, UV) for concentration monitoring. | Synthetic mixtures with varying API/excipient ratios; standardized reflectance tiles. |
| Residence Time Distribution (RTD) Tracers | Characterize flow hydraulics and validate mixing models. | Fluorescein (UV/Fluorescence); deuterated solvents (ATR-FTIR); lithium salts (Conductivity). |
| Model Active Pharmaceutical Ingredients (APIs) | Benchmark processes using well-understood molecules. | Ibuprofen (small molecule); Lysozyme (model protein). |
Critical Pathways for Implementation Success
The future outlook for pharmaceutical manufacturing is unequivocally pointed toward greater continuity and integration. Exploratory research must now focus on de-risking this transition. Hybrid systems serve as the essential empirical testbed, generating the process understanding and regulatory confidence required to realize the full potential of End-to-End ICM. Success hinges on the convergence of advanced engineering, robust data science, and adaptive regulatory science, ultimately enabling more agile, efficient, and resilient drug production.
Conclusion
The choice between batch and continuous flow is not binary but strategic, hinging on specific reaction requirements, development stage goals, and ultimate commercialization plans. Foundational understanding reveals flow's superiority for intensified, hazardous, or photochemical transformations, while batch retains value for highly complex or viscous systems. Methodological advances in automation and analytics are blurring the lines, enabling more informed platform selection. Troubleshooting is system-specific but increasingly guided by predictive modeling. Comparative validation consistently shows flow chemistry can offer significant advantages in sustainability, speed, and control, driving its adoption in regulatory frameworks for continuous manufacturing. The future lies in intelligent, hybrid approaches that leverage the strengths of both paradigms to accelerate the delivery of new therapeutics from discovery to patient.