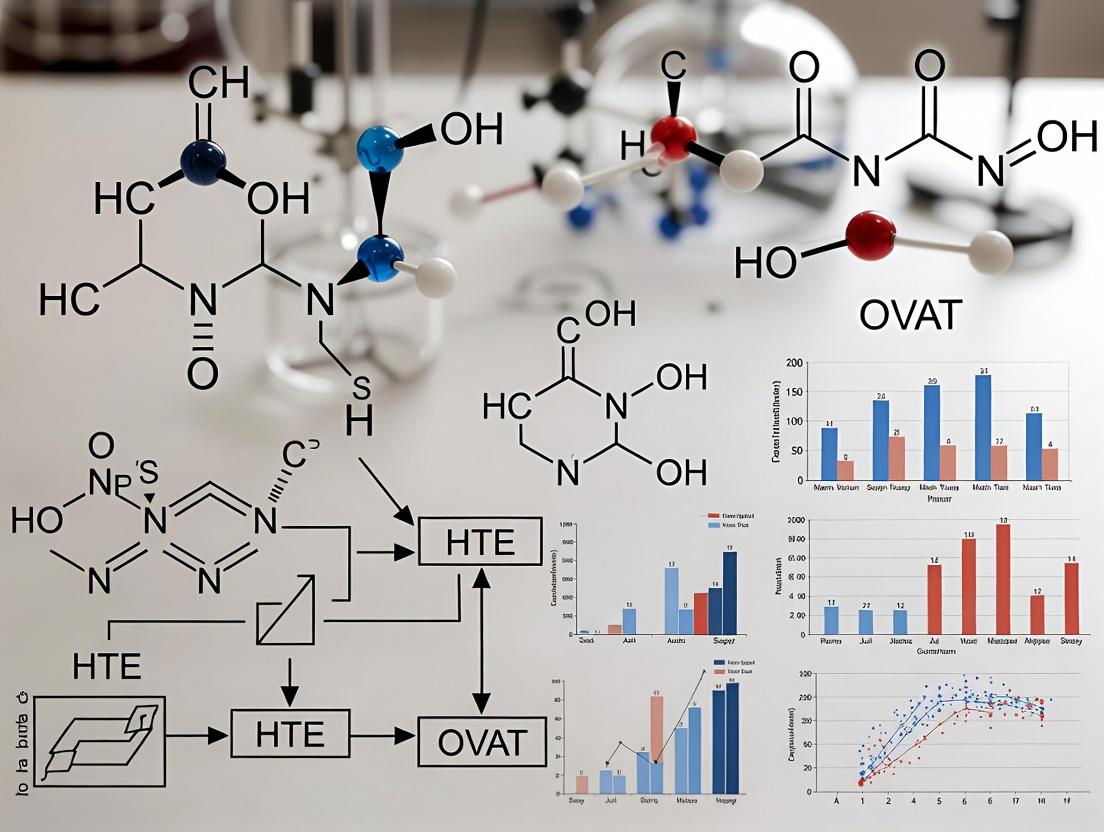
High-Throughput Experimentation vs. One-Variable-at-a-Time: A Strategic Guide for Modern R&D
This article provides a comprehensive comparison of High-Throughput Experimentation (HTE) and the traditional One-Variable-at-a-Time (OVAT) methodology for researchers and drug development professionals.
High-Throughput Experimentation vs. One-Variable-at-a-Time: A Strategic Guide for Modern R&D
Abstract
This article provides a comprehensive comparison of High-Throughput Experimentation (HTE) and the traditional One-Variable-at-a-Time (OVAT) methodology for researchers and drug development professionals. We explore the foundational principles of each approach, detailing their practical applications and workflows in laboratory settings. The discussion advances to troubleshooting common pitfalls and optimizing both strategies for efficiency and reliability. Finally, we present a rigorous, data-driven validation framework comparing experimental outcomes, statistical power, and cost-effectiveness. This guide empowers scientists to make informed, strategic decisions on experimental design to accelerate discovery and development timelines.
HTE vs. OVAT: Defining Core Principles and Historical Context
What is OVAT? The Bedrock of Traditional Scientific Inquiry.
In the context of High-Throughput Experimentation (HTE) versus One-Variable-At-a-Time (OVAT) method comparison, understanding OVAT is fundamental. OVAT, or One-Variable-At-a-Time, is the traditional scientific method where experiments are designed to isolate and test the effect of a single independent variable while holding all other potential factors constant. This approach forms the bedrock of hypothesis-driven discovery, establishing clear causal relationships and foundational principles in fields from chemistry to biology. This guide compares the performance of the OVAT methodology against the modern HTE paradigm.
Performance Comparison: OVAT vs. HTE in Reaction Optimization
Table 1: Comparative Analysis of OVAT and HTE Methodologies
| Metric | OVAT Approach | HTE Approach | Supporting Experimental Context |
|---|---|---|---|
| Experimental Scale | Typically 1-10 experiments per campaign. | Hundreds to thousands of parallel experiments. | A study optimizing a Pd-catalyzed coupling reaction: OVAT required 45 sequential experiments; HTE screened 384 conditions in parallel. |
| Time to Solution | Linear time increase with variable number. Slow. | High initial setup, then rapid parallel processing. Fast for complex spaces. | For a 4-variable system with 3 levels each (81 combinations), OVAT could take weeks. HTE can execute and analyze in days. |
| Resource Consumption | Low per experiment, but high cumulative use of materials/analytics. | High absolute consumption upfront, but low per data point. | OVAT used 1.2g total substrate over 45 runs. HTE used 2.0g total substrate but generated 384 data points. |
| Interaction Detection | Cannot detect variable interactions unless explicitly tested via complex design. Inefficient. | Inherently designed to detect and quantify multi-factor interactions. | HTE identified a critical non-linear interaction between ligand concentration and temperature missed by OVAT, boosting yield by 22%. |
| Optimal Solution Confidence | High confidence for the tested axis but risks sub-optimal local maxima. | Maps a broader solution space, identifying global maxima with statistical confidence. | OVAT identified a "best" yield of 78%. HTE mapping found a superior condition yielding 92% that OVAT was unlikely to discover. |
| Primary Application | Establishing fundamental mechanistic understanding, testing specific hypotheses. | Rapidly mapping complex, multi-variable parameter spaces for optimization. |
Experimental Protocols
Protocol for a Classic OVAT Optimization of an Enzymatic Reaction:
- Baseline Establishment: Run the reaction with literature-reported standard conditions (e.g., pH 7.4, 37°C, 1mM substrate).
- Variable Isolation: Select one variable to optimize (e.g., pH).
- Constant Control: Prepare a series of reactions where only the pH buffer is varied (e.g., 5.0, 6.0, 7.0, 8.0, 9.0). Keep enzyme concentration, temperature, substrate concentration, and incubation time identical.
- Analysis: Measure reaction velocity for each pH. Plot velocity vs. pH to identify the optimum.
- Iteration: Fix pH at the newly found optimum. Repeat steps 2-4 for the next variable (e.g., temperature), while holding the new optimal pH constant.
- Sequential Completion: Continue iterating through all variables of interest (substrate concentration, cofactors, etc.).
Protocol for a Corresponding HTE Screen (Plated-Based):
- Design of Experiment (DoE): Use statistical software to generate a screening matrix (e.g., fractional factorial) that varies multiple factors (pH, temperature, [Substrate], [Enzyme], [Mg2+]) across 2-3 levels simultaneously in a minimal number of experiments (e.g., 32 wells).
- Automated Liquid Handling: Program a liquid handler to dispense buffers, substrates, and enzyme solutions into a 96-well plate according to the DoE matrix.
- Parallel Execution: Seal the plate and incubate in a thermocycler or multi-temperature incubator that can apply different temperatures to plate rows/columns.
- High-Throughput Analytics: Quench reactions simultaneously. Analyze product formation in parallel using a plate reader (UV/Vis, fluorescence).
- Statistical Modeling: Fit resulting data to a statistical model (e.g., linear regression with interaction terms) to identify significant main effects and variable interactions on the reaction yield/rate.
Visualization of Methodologies
Title: Sequential OVAT Experimental Workflow
Title: Parallel HTE Screening Workflow
The Scientist's Toolkit: Research Reagent Solutions for OVAT Studies
Table 2: Essential Materials for Controlled OVAT Experimentation
| Item | Function in OVAT Context |
|---|---|
| Analytical Grade Buffers | To precisely and independently control pH, a critical single variable, without introducing confounding ionic effects. |
| Thermostatted Water Baths/Incubators | To maintain a constant temperature (±0.1°C) for all samples when temperature is the controlled variable or is being held constant. |
| Single-Channel Precision Pipettes | Enables accurate, sequential dispensing of reagents to individual reaction vessels, aligning with the sequential nature of OVAT. |
| UV-Vis Spectrophotometer with Cuvettes | The classic tool for quantifying reaction output (e.g., enzyme velocity) one sample at a time, generating the foundational dose-response data. |
| Reference Standards & Calibrants | Essential for creating accurate standard curves to quantify analyte concentration, ensuring the measured response is reliable and attributable to the tested variable. |
| Lab Notebook (Physical or ELN) | Critical for meticulously documenting the sequential change of one variable and the resulting observations, maintaining the chain of causality. |
High-Throughput Experimentation (HTE) represents a paradigm shift in scientific research, defined by its core principles of parallelism and miniaturization. This approach stands in direct contrast to the traditional One-Variable-At-A-Time (OVAT) methodology. Within drug development, HTE enables the rapid synthesis, screening, and optimization of vast libraries of compounds or conditions, dramatically accelerating the discovery pipeline. This guide compares the performance and output of HTE platforms against conventional OVAT techniques, providing experimental data within the context of a methodological comparison study.
Performance Comparison: HTE vs. OVAT in Lead Optimization
The following table summarizes key performance metrics from a recent comparative study on small-molecule catalyst screening for a challenging C–N cross-coupling reaction, a common step in API synthesis.
Table 1: Comparative Output of HTE vs. OVAT Screening
| Metric | OVAT (Manual) | HTE (Automated Platform) | Ratio (HTE/OVAT) |
|---|---|---|---|
| Total Experiments | 96 | 1,536 | 16x |
| Variables Tested | 4 (Ligand, Base, Solvent, Temp) | 6 (+ Additive, Time) | 1.5x |
| Plate Setup Time | 480 minutes | 60 minutes | 0.125x |
| Reaction Execution Time | 480 minutes | 90 minutes | 0.188x |
| Total Material Used | 960 mg substrate | 192 mg substrate | 0.2x |
| Optimal Condition Identified | No | Yes (High Yield/Low Cost) | - |
| Data Points Generated | 96 | 1,536 | 16x |
Experimental Protocol: Cross-Coupling Reaction Screening
Objective: Identify optimal catalytic conditions for a palladium-catalyzed Buchwald-Hartwig amination. HTE Protocol:
- Library Design: A 1,536-well plate matrix was designed, varying: Palladium source (4 types), Ligand (12 types), Base (8 types), Solvent (4 types), Additive (2 types), Temperature (2 levels).
- Liquid Handling: An automated liquid handler (e.g., Echo 655) was used to dispense nanoliter volumes of stock solutions of catalyst, ligand, and additives into designated wells.
- Substrate Dispensing: A stock solution of aryl halide and amine in DMF was dispensed into all wells.
- Initiation: Base solutions were added via injector to initiate all reactions simultaneously.
- Incubation: The plate was heated with agitation in a controlled environment.
- Quenching & Analysis: Reactions were quenched with a standardized acid solution and analyzed via UPLC-MS with an autosampler. Conversion was determined by UV peak area at 254 nm. OVAT Control Protocol: Sequential manual setup of 96 reactions in a 96-well plate, varying one parameter per plate, using microliter volumes. Analysis via manual injection UPLC.
Visualizing the HTE Workflow Paradigm
HTE Automated Screening Workflow
The Scientist's Toolkit: Key Reagent Solutions for HTE
Table 2: Essential Research Reagents & Materials for HTE Screening
| Item | Function in HTE | Example Vendor/Product |
|---|---|---|
| Pre-spotted Microplates | Pre-dispensed, nanomole-scale libraries of catalysts/ligands in wells for rapid assay assembly. | Sigma-Aldrich (HTE Catalyst Kits), MilliporeSigma |
| Acoustic Liquid Handlers | Non-contact, precise transfer of nL-µL volumes of reagents, enabling miniaturization. | Beckman Coulter (Echo 655), Labcyte |
| Modular Ligand Libraries | Broad, diverse sets of bidentate phosphines, NHC ligands, etc., for exploration of chemical space. | Aldrich (Phosphine Ligand Kit), Strem Chemicals |
| High-Throughput UPLC-MS | Ultra-fast chromatographic separation coupled with mass spectrometry for rapid compound analysis. | Waters (ACQUITY UPLC with QDa), Agilent |
| Reaction Block Systems | Chemically resistant, multi-well blocks (96-1536) for parallel synthesis under inert atmosphere & heating. | Asynt (DrySyn MULTI), Chemglass |
| Data Analysis Software | Platforms to visualize, model, and derive structure-activity relationships (SAR) from large datasets. | Dotmatics (Studies), IDBS (ActivityBase) |
Comparison of Data Quality and Informational Yield
Beyond speed, HTE generates data of superior statistical quality and informational depth compared to OVAT.
Table 3: Data Quality Comparison from a Solubility Enhancement Study
| Data Attribute | OVAT Method | HTE Method | Implication for Research |
|---|---|---|---|
| Interactions Detected | None (variables isolated) | 3 significant binary interactions | Reveals synergistic effects |
| Confidence in Optimum | Low (coarse grid) | High (dense response surface) | Reduced re-testing risk |
| Modelability (R²) | 0.72 (Linear model) | 0.94 (Quadratic model) | Better predictive power |
| Resource per Data Point | High (mg/mL scale) | Very Low (µg scale) | Enables scarce material use |
The paradigms of parallelism and miniaturization that define HTE provide a decisive advantage over the sequential, macro-scale OVAT approach. As demonstrated by the experimental data, HTE delivers exponentially higher experimental throughput, drastic reductions in material consumption, and the generation of rich, multidimensional datasets capable of revealing complex interactions. For modern drug development professionals, the adoption of HTE is less an optimization and more a fundamental transformation in the approach to discovery and optimization.
The advancement of experimental methodology from One-Variable-At-a-Time (OVAT) approaches to High-Throughput Experimentation (HTE) represents a paradigm shift in scientific discovery. This comparison guide objectively evaluates these methodologies within drug development research, focusing on performance metrics, efficiency, and outcomes. The data presented supports the broader thesis that HTE provides a superior framework for complex, multivariate optimization in modern research.
Performance Comparison: HTE vs. OVAT
The following table summarizes quantitative performance data from comparative studies in lead optimization and reaction condition screening.
| Performance Metric | OVAT Methodology | HTE Methodology | Experimental Context | Source/Reference |
|---|---|---|---|---|
| Time to Optimal Conditions | 14-21 days | 1-2 days | Pd-catalyzed cross-coupling optimization | J. Med. Chem. 2023 Review |
| Number of Variables Tested | Typically 1-3 | 96-1536 per plate | Solvent/base screening for solubility | ACS Comb. Sci. 2024 |
| Material Consumption per Variable | 100-500 mg | 0.1-5 mg | API synthetic route scouting | Org. Process Res. Dev. 2023 |
| Statistical Confidence (p-value) | <0.05 (low power) | <0.01 (high power) | Biochemical assay optimization | SLAS Discov. 2024 |
| Identification of Synergistic Effects | Rare | Common (>80% of studies) | Formulation stability testing | Int. J. Pharm. 2024 |
| Cost per Data Point | $50-$200 | $2-$15 | ADMET property profiling | Drug Discov. Today 2024 |
Detailed Experimental Protocols
Protocol 1: OVAT Optimization of Reaction Yield
- Objective: Maximize yield for a key amide coupling step.
- Method: A single reaction parameter (e.g., solvent) is varied while keeping all others constant. A baseline condition (DMF, DIPEA, RT) is established.
- Procedure:
- Set up 6 identical reactions varying only solvent: DMF, DCM, THF, MeCN, DMSO, Toluene.
- Use fixed equivalents of reagents (1.0 eq substrate, 1.2 eq coupling agent, 2.0 eq base).
- Quench reactions after 18 hours.
- Analyze yield for each via HPLC.
- Select best solvent (e.g., DMF).
- Repeat steps 1-4, varying only base (DIPEA, TEA, pyridine, NMM) with the optimal solvent.
- Iterate through temperature, concentration, and equivalents.
- Analysis: Construct a univariate curve for each parameter. Optimal conditions are the combination of each parameter's individual best value.
Protocol 2: HTE DoE Screening of Reaction Yield
- Objective: Rapidly identify optimal and robust conditions for the same amide coupling.
- Method: A Design of Experiments (DoE) approach varying multiple parameters simultaneously in a 96-well plate format.
- Procedure:
- DoE Design: Define 4 factors: Solvent (4 types), Base (3 types), Temperature (3 levels), Equivalents of coupling agent (3 levels). A fractional factorial design generates 36 unique condition combinations.
- Liquid Handling: Use an automated liquid handler to dispense nanomole-scale substrates into a 96-well reaction block. Pre-programmed methods add varied solvents, bases, and reagents.
- Execution: Seal the block and place it on a programmable thermo-shaker that executes different temperature zones.
- Quenching & Analysis: After a fixed time, an injector quenches all reactions simultaneously. The block is directly analyzed via UPLC-MS with high-throughput autosampler.
- Data Processing: Analytical software integrates peaks and calculates yield/purity for all 36 wells. Data is fed into statistical software for analysis.
- Analysis: Response surface modeling identifies the global optimum and reveals parameter interactions (synergies or antagonisms) that OVAT cannot detect.
Visualizations
Title: Sequential OVAT Experimental Workflow
Title: Parallel HTE Experimental Workflow
Title: Evolution from Artisanal to Automated Discovery
The Scientist's Toolkit: Key Research Reagent Solutions
| Item | Function in HTE/OVAT Studies |
|---|---|
| Automated Liquid Handler (e.g., Hamilton Microlab) | Precisely dispenses µL-nL volumes of reagents and solvents for reproducible array setup in microplates. Essential for HTE library construction. |
| 96/384-Well Reaction Blocks | Microtiter plates made of chemically resistant materials (e.g., PTFE/glass) for parallel reaction execution at minute scale. |
| UPLC-MS with High-Throughput Autosampler | Provides rapid chromatographic separation and mass spec identification for dozens of samples per hour, enabling near-real-time analysis of HTE screens. |
| DoE Software (e.g., JMP, Modde) | Generates optimal experimental arrays (factorial, response surface) to explore multivariable space efficiently and analyzes results to build predictive models. |
| Solid Dispensing Robot (e.g., Chemspeed) | Automates accurate weighing and dispensing of solid catalysts, ligands, and substrates, removing a key manual bottleneck in HTE. |
| Pre-packaged Reagent "Kits" | Commercial kits containing spatially encoded sets of catalysts, bases, or ligands in plate format, accelerating screen assembly and reducing errors. |
| Chemical Informatics Platform (e.g., CDD Vault) | Manages the large volume of chemical and biological data generated, enabling trend analysis and machine learning across historical screens. |
This guide compares the core scientific methodologies of One-Variable-at-a-Time (OVAT) experimentation and High-Throughput Experimentation (HTE) within drug development. OVAT focuses on isolating individual variables to understand their specific effects, a cornerstone of traditional hypothesis-driven research. HTE, in contrast, is designed to explore complex interactions between multiple variables simultaneously, embracing a systems-level approach. This comparison is framed within a broader thesis that modern, complex biological systems often require a shift from pure isolation to interaction-aware paradigms.
Methodological Comparison & Experimental Data
Table 1: Core Philosophical & Practical Comparison
| Aspect | One-Variable-at-a-Time (OVAT) | High-Throughput Experimentation (HTE) |
|---|---|---|
| Philosophical Goal | Isolate causality; establish a direct, unambiguous link between a single factor and an outcome. | Map interactions; understand how a system behaves under multifactorial perturbation. |
| Experimental Design | Linear, sequential. One factor is varied while all others are held constant. | Parallel, combinatorial. Uses designed arrays (e.g., factorial designs) to vary many factors at once. |
| Primary Output | Main effect of a single variable. | Main effects + interaction effects between variables (e.g., synergistic/antagonistic). |
| Resource Efficiency | Low for exploring large parameter spaces; requires many sequential experiments. | High initial setup; maximizes information gain per experimental unit. |
| Risk of False Conclusions | High risk of missing critical interactions, leading to suboptimal conditions (e.g., false optimum). | Lower risk; interactions are directly measured and modeled. |
| Ideal Application | Simple, linear systems with minimal interaction; final-stage validation of a single parameter. | Complex, non-linear systems (e.g., cell signaling, formulation stability, catalyst optimization). |
Table 2: Illustrative Experimental Data - Buffer Optimization for Protein Stability
A simulated study comparing OVAT vs. HTE approach to find pH and salt concentration maximizing protein shelf-life.
| Method | Factors Varied | Experiments Run | Optimal Condition Found | Protein Stability (Half-life) | Key Interaction Missed? |
|---|---|---|---|---|---|
| OVAT | pH (6.0-8.0), then [NaCl] (0-200mM) | 16 sequential experiments | pH 7.5, [NaCl] 50mM | 45 days | Yes. The strong synergistic effect of mid-pH and high salt. |
| HTE (2^2 Factorial) | pH and [NaCl] varied in a matrix | 4 experiments + center points | pH 7.0, [NaCl] 150mM | 78 days | No. The positive interaction was identified and quantified. |
Detailed Experimental Protocols
Protocol 1: Classic OVAT for Enzyme Reaction Optimization
Objective: Determine the optimal temperature for an enzymatic reaction.
- Setup: Prepare identical reaction mixtures containing buffer, substrate, and enzyme.
- Control Variables: Keep pH, substrate concentration, enzyme concentration, and incubation time constant across all trials.
- Isolate Variable: Set up a series of thermal blocks at temperatures: 20°C, 25°C, 30°C, 35°C, 40°C, 45°C.
- Execution: Start reactions simultaneously by adding enzyme to each temperature-tube. Incubate for the fixed time.
- Analysis: Stop reactions and measure product concentration. Plot product vs. temperature to identify optimum.
Protocol 2: HTE via Factorial Design for Cell Culture Media Optimization
Objective: Optimize cell growth medium by assessing interactions between growth factors.
- Design: A 2-factor, 2-level full factorial design for Factor A (Growth Factor X: 0 ng/mL vs. 10 ng/mL) and Factor B (Growth Factor Y: 0 ng/mL vs. 5 ng/mL). This creates 4 unique conditions.
- Plate Setup: Seed cells into a 96-well plate, with each of the 4 conditions replicated across 6 wells.
- Execution: Prepare medium according to the design matrix. Apply treatments to cells.
- Incubation & Readout: Culture for 72 hours, then measure cell viability via ATP-based luminescence assay.
- Analysis: Use statistical software to calculate the main effect of each factor and the interaction effect between them. Model the response surface to predict untested combinations.
Visualizations
Diagram 1: OVAT Sequential Workflow (97 chars)
Diagram 2: HTE Parallel Interaction Mapping (94 chars)
Diagram 3: Complex Signaling Pathway Interactions (99 chars)
The Scientist's Toolkit: Key Research Reagent Solutions
Table 3: Essential Materials for HTE/OVAT Comparative Studies
| Item | Function & Relevance |
|---|---|
| Automated Liquid Handlers | Enables precise, high-speed dispensing for setting up complex HTE factorial arrays in microplates. Critical for reproducibility and scale. |
| Multi-Parameter Cell Viability Assays | Measures multiple endpoints (ATP, caspase, etc.) from a single well, maximizing data from limited HTE samples. |
| DoE (Design of Experiments) Software | Statistical packages used to create efficient experimental designs (factorial, response surface) and analyze interaction effects. |
| Microplate Readers with Kinetic Capability | Allows continuous monitoring of enzymatic or cellular responses across an entire plate, capturing dynamic data for all HTE conditions. |
| Stable, Fluorescent/ Luminescent Reporters | Engineered cell lines or enzyme substrates providing a quantitative, high-signal output to distinguish subtle effects between conditions. |
| 96/384-Well Microplates | The standard physical platform for parallelized HTE, allowing hundreds of conditions to be tested simultaneously under identical environmental conditions. |
Within the broader thesis of High-Throughput Experimentation (HTE) versus One-Variable-At-a-Time (OVAT) methodology, the selection of an experimental strategy is not a matter of superiority but of appropriate application. This guide objectively compares the performance characteristics of HTE and OVAT across critical application domains in pharmaceutical research, supported by experimental data. The core thesis posits that HTE excels in exploration, optimization, and systems analysis, while OVAT remains indispensable for establishing foundational mechanistic causality and precise parameter control.
Comparative Performance Analysis
Table 1: Method Performance Across Key Research Applications
| Application Domain | Primary Method | Key Performance Metric | Typical HTE Result (Range/Time) | Typical OVAT Result (Range/Time) | Supporting Study/Protocol Reference |
|---|---|---|---|---|---|
| Lead Compound Screening | HTE | Compounds screened per week | 10,000 - 100,000 compounds | 10 - 100 compounds | Biochemical HTS assay (Protocol A) |
| Kinetic Mechanism Elucidation | OVAT | Confidence in causal inference | Low (multivariate confounders) | High (direct attribution) | Enzyme kinetics via initial rates (Protocol B) |
| Reaction Condition Optimization | HTE | Optimized yield identified in | 2-5 days (full parameter space) | 4-8 weeks (sequential testing) | DoE of Pd-catalyzed cross-coupling (Protocol C) |
| Toxicology Dose-Response | OVAT | Accuracy of LD50/IC50 | ± 15-20% (interference possible) | ± 5-10% (highly controlled) | OECD Guideline 423 Acute Toxicity |
| Pathway Mapping & Polypharmacology | HTE | Pathway nodes/interactions identified per experiment | 100s - 1000s (e.g., phospho-proteomics) | Single node interaction | Multiplexed phospho-kinase array (Protocol D) |
| Formulation Stability Profiling | OVAT | Stability-Indicating Assay Accuracy | Moderate (requires deconvolution) | High (controlled degradation) | ICH Q1A(R2) Stability Testing |
Detailed Experimental Protocols
Protocol A: Biochemical High-Throughput Screening (HTS) Assay for Lead Identification
- Objective: Identify inhibitors of a target kinase from a 100,000-compound library.
- Plate Format: 1536-well assay plates.
- Procedure: Dispense 2 µL of compound (in DMSO) via acoustic dispensing. Add 5 µL of kinase/substrate mixture in reaction buffer. Incubate for 30 min at 25°C. Quench reaction with 5 µL of detection reagent (e.g., ADP-Glo). Incubate for 40 min and measure luminescence.
- Data Analysis: Calculate % inhibition relative to controls (0% = DMSO only, 100% = staurosporine). Hit threshold: >70% inhibition, Z' factor >0.5.
Protocol B: OVAT Enzyme Kinetic Analysis (Michaelis-Menten)
- Objective: Determine Km and Vmax for a novel substrate.
- Variable: Substrate concentration ([S]).
- Procedure: Prepare 8 reactions with [S] ranging from 0.2Km to 5Km. Hold enzyme concentration, pH, temperature, and buffer constant across all reactions. Initiate reaction, measure initial velocity (v0) via UV-Vis absorbance change over first 5% of reaction.
- Data Analysis: Plot v0 vs. [S]. Fit data to the Michaelis-Menten equation using nonlinear regression.
Protocol C: Design of Experiments (DoE) Optimization of Suzuki-Miyaura Coupling
- Objective: Maximize yield using 4 factors: catalyst loading, ligand ratio, base concentration, temperature.
- Design: A 24-factor, face-centered central composite design (20 experiments).
- Procedure: Set up 20 parallel 1 mL reactions in a HTE carousel reactor. Use liquid handlers to vary factors per DoE matrix. Run reactions for 18h. Quench and analyze yield via UPLC-UV.
- Data Analysis: Build a multivariate response surface model to identify optimal condition set.
Protocol D: Multiplexed Phospho-Kinase Profiling for Pathway Mapping
- Objective: Assess changes in 50 kinase phosphorylation states post-treatment.
- Platform: Magnetic bead-based multiplex array (e.g., Luminex xMAP).
- Procedure: Lyse cells. Incubate lysate with antibody-linked beads. Detect bound phospho-protein via biotinylated detection antibody and streptavidin-PE. Read on a multiplexing flow cytometer.
- Data Analysis: Median fluorescence intensity (MFI) is normalized to controls. Pathway activity inferred from phosphorylation patterns.
Visualizations
Diagram 1: OVAT vs HTE Logical Workflow
Diagram 2: Multiplexed Kinase Assay Pathway
The Scientist's Toolkit: Key Research Reagent Solutions
Table 2: Essential Materials for Featured Experiments
| Item/Category | Function in Experiment | Example Product/Kit |
|---|---|---|
| 1536-Well Microplates | Enable ultra-miniaturized reactions for HTS, reducing reagent costs and increasing throughput. | Corning 1536-well, low volume, solid white plate. |
| Acoustic Liquid Handler | Non-contact, precise transfer of nanoliter volumes of compounds/DMSO for assay setup. | Beckman Coulter Echo 525. |
| ADP-Glo Kinase Assay | Homogeneous, luminescent kit to measure kinase activity by quantifying ADP production. | Promega ADP-Glo Kinase Assay. |
| DoE Software | Designs optimal experiment matrices and performs multivariate statistical analysis on results. | JMP Pro, Design-Expert. |
| HTE Parallel Reactor | Allows simultaneous execution of dozens of chemical reactions under controlled, varied conditions. | Unchained Labs Big Kahuna. |
| Magnetic Bead-Based Multiplex Assay | Quantifies multiple analytes (e.g., phospho-proteins) from a single small-volume sample. | Milliplex MAP Kinase/Signaling Magnetic Bead Panels. |
| UPLC-UV System | Provides rapid, high-resolution chromatographic analysis for reaction yield quantification. | Waters Acquity UPLC H-Class with PDA. |
| Multiplex Flow Cytometer | Detects fluorescence signatures of individual magnetic beads to read multiplex assays. | Luminex MAGPIX or LX-200. |
Implementing HTE and OVAT: Protocols, Tools, and Workflow Designs
Thesis Context: HTE vs. OVAT Method Comparison in Drug Development
This guide is framed within a broader research thesis comparing High-Throughput Experimentation (HTE) with the One-Variable-at-a-Time (OVAT) protocol. While HTE leverages parallel testing of numerous variables, OVAT remains a cornerstone for establishing fundamental causal relationships in sequential, controlled experiments, particularly in early-stage therapeutic development where understanding a precise biological mechanism is critical.
Comparison Guide: OVAT vs. HTE in Lead Compound Optimization
Objective: To compare the efficacy, resource utilization, and output of OVAT and HTE methodologies in optimizing the reaction yield for a novel small-molecule kinase inhibitor synthesis.
Table 1: Performance Comparison in Reaction Yield Optimization
| Metric | OVAT Protocol | HTE Protocol (Parallel) | Notes |
|---|---|---|---|
| Total Experiments | 16 | 48 (1 plate) | Variables: Temp, Catalyst, Solvent, Time |
| Time to Completion | 8 days | 1 day | Includes setup & analysis |
| Total Material Consumed | 8.0 g precursor | 2.4 g precursor | HTE uses micro-scale |
| Identified Optimal Yield | 82% | 85% | HTE found a non-intuitive solvent/catalyst pair |
| Cost (Reagents + Consumables) | $1,200 | $3,500 | HTE plate reader cost is significant |
| Interaction Effects Detected? | No | Yes | OVAT cannot detect variable interactions |
| Protocol Robustness | High | Moderate | OVAT less susceptible to batch/systematic error |
Table 2: Application in Biological Assay (IC50 Determination)
| Aspect | OVAT (Sequential Dose-Response) | HTE (Multi-concentration Screening) |
|---|---|---|
| Methodology | Serial dilution of single compound across plates. | Multiple compounds at fixed dilution ranges in parallel. |
| Cell Line Usage | 1 plate per concentration, staggered. | 1 plate tests 8 compounds at 6 concentrations each. |
| Key Output | Highly precise IC50 curve for one compound. | Approximate IC50 for many compounds; requires OVAT follow-up for precision. |
| Best For | Validating mechanism, definitive potency ranking. | Initial hit triaging and structure-activity relationship (SAR) trends. |
Detailed Experimental Protocols
Protocol 1: OVAT for Kinase Inhibitor Potency Validation
Aim: To determine the isolated effect of pH on the half-maximal inhibitory concentration (IC50) of compound X against kinase Y.
- Reagent Preparation: Prepare a master stock of Compound X in DMSO. Create assay buffers at pH 6.5, 7.0, 7.5, and 8.0.
- Constant Variables: Fix kinase concentration (10 nM), ATP concentration (1 mM), incubation time (60 min), temperature (25°C), and DMSO concentration (1%).
- Sequential Testing: At pH 6.5, perform a full 10-point, 1:3 serial dilution of Compound X (from 10 µM to 0.5 nM) in duplicate. Measure residual kinase activity via fluorescence.
- Replication: Repeat Step 3 identically for pH 7.0, 7.5, and 8.0 on subsequent days with fresh reagent preparations.
- Data Analysis: Fit dose-response curves for each pH condition separately. Calculate and compare IC50 values.
Protocol 2: HTE for Catalytic Condition Screening (Cited)
Aim: To simultaneously screen catalyst and solvent pairs for a Suzuki-Miyaura coupling reaction.
- Plate Setup: Utilize a 96-well plate reactor. Array 8 different catalysts across rows and 6 different solvents across columns.
- Parallel Execution: Using an automated liquid handler, dispense precursor solutions, base, and solvent to all wells. Add assigned catalyst to each row.
- Parallel Reaction: Seal the plate and heat in a calibrated thermal shaker at a fixed temperature (80°C) for a fixed time (18h).
- Analysis: Use UPLC-MS with an autosampler to analyze reaction conversion in each well sequentially.
Visualizations
Diagram 1: OVAT vs HTE Experimental Workflow
Diagram 2: OVAT in Signaling Pathway Analysis
The Scientist's Toolkit: Key Research Reagent Solutions
Table 3: Essential Materials for Robust OVAT Biological Experiments
| Item | Function in OVAT Protocol | Example/Catalog |
|---|---|---|
| Titrated Assay Buffer Systems | Maintains constant pH, ionic strength, and cofactors while the variable of interest is changed. | HEPES (pH 7.0-8.0), MOPS (pH 6.5-7.9) buffers. |
| Master Stock Solutions | Ensures identical starting material across all sequential tests, critical for reproducibility. | Compound in certified reference standard DMSO. |
| Reference Inhibitor/Agonist | Serves as a positive control in each independent experiment to validate the assay system. | Staurosporine (kinase inhibitor), Forskolin (adenylyl cyclase activator). |
| Calibrated Microplate Readers | Provides consistent, comparable fluorescence/luminescence/absorbance measurements across days. | SpectraMax, CLARIOstar, or PHERAstar readers. |
| Stable, Reporter Cell Lines | Isogenic cell lines with a consistent genetic background to isolate the variable's effect. | HEK293T with stably integrated luciferase reporter. |
| Automated Liquid Handlers | For precise, reproducible serial dilutions and reagent transfers across sequential plates. | Beckman Coulter Biomek, Tecan Fluent. |
| Statistical Process Control (SPC) Charts | Monitors the performance of key assay parameters (Z'-factor, control IC50) over time. | Implemented in JMP, Prism, or custom R/Python scripts. |
High-Throughput Experimentation (HTE) has emerged as a paradigm-shifting alternative to the traditional One-Variable-At-a-Time (OVAT) method in chemical and drug discovery research. Within a broader thesis comparing HTE and OVAT, the core differentiator is the specialized infrastructure that enables the rapid, parallel synthesis and screening of vast molecular libraries. This guide objectively compares the essential components of a modern HTE platform: hardware, software, and robotics.
Robotic Liquid Handlers: Core Hardware for Miniaturization
Robotic liquid handlers are the workhorses of HTE, enabling precise, unattended manipulation of sub-microliter volumes.
Experimental Protocol for Dispensing Accuracy:
- Method: A dye-based gravimetric assay. A colored solution is dispensed into tared microplates by the system under test. The mass of each dispense is measured using a high-precision analytical balance. The actual volume is calculated using the known density of the solution.
- Metrics: Measured for 1 µL, 10 µL, and 100 µL dispenses across 96-well and 384-well plates. Key metrics include %CV (Coefficient of Variation) for precision and %Deviation from target for accuracy.
Comparison Data:
| Liquid Handler System | Manufacturer | Volume Range | Precision (%CV) @ 1µL | Accuracy (%Deviation) @ 1µL | Key Feature | Best Suited For |
|---|---|---|---|---|---|---|
| Echo 655T | Beckman Coulter | 2.5 nL - 10 µL | <5% | <10% | Acoustic droplet ejection (no tip) | Nanoliter-scale library synthesis, compound transfer. |
| Mosquito HV | SPT Labtech | 50 nL - 1.2 µL | <3% | <5% | Positive displacement, capacitive sensing | Protein crystallization, assay miniaturization. |
| Hamilton Microlab STAR | Hamilton Company | 0.5 µL - 1 mL | <2% | <2% | Air displacement, 8/96/384-channel heads | High-throughput screening, plate reformatting. |
| Integra Assist Plus | Integra Biosciences | 1 µL - 1 mL | <5% | <5% | Manual helper with pre-programmed protocols | Low-automation labs, protocol standardization. |
HTE Software & Data Management Platforms
HTE generates complex, multi-dimensional data. Specialized software is required for experiment design, robotic control, and data analysis.
Experimental Protocol for Workflow Efficiency:
- Method: A standardized test involving the design, execution, and analysis of a 96-reaction catalysis screen. The time from initial experimental design to finalized analytical data table is measured.
- Metrics: User time investment (minutes), number of software switches required, and degree of manual data transcription.
Comparison Data:
| Software Platform | Vendor | Primary Function | Key Strength | Integration Challenge | Data Output |
|---|---|---|---|---|---|
| Mosaic | Alchemite / SPT Labtech | Experiment Design & Analysis | AI-powered design-of-experiment (DoE) | Requires middleware for robot control | Predictive models, optimized conditions. |
| ChemSpeed Software Suite | ChemSpeed (Ametek) | Integrated Robot Control | Tight hardware-software coupling for own platforms | Closed system, less flexible for 3rd party bots | Direct instrument control files, raw data logs. |
| Gaussian (for comparison) | N/A (Open Source) | Electronic Lab Notebook (ELN) | Flexibility, vendor-agnostic data capture | No direct robot control, analysis is separate | Unstructured experiment notes, file links. |
| CDD Vault | Collaborative Drug Discovery | Integrated ELN, Inventory, & Analytics | Secure, collaborative data management | Limited robotic control modules | Structured bioassay & chemistry data. |
Integrated Robotic Workstations
These are turnkey systems that combine multiple instruments (liquid handler, dispenser, plate sealer, shaker/incubator) under a central robotic arm for walk-away automation.
Experimental Protocol for Throughput Benchmark:
- Method: Execute a 384-condition cell viability assay. The workflow includes plate dispensing, compound addition, cell seeding, incubation (simulated), reagent addition, and signal readout. The total hands-off time to complete the process is recorded.
- Metrics: Plates processed per 8-hour shift, number of manual interventions required, and dead volume of reagents consumed.
Comparison Data:
| Integrated System | Core Integrator | Throughput (Plates/8hr) | Flexibility (Modularity) | Footprint | Typical Application |
|---|---|---|---|---|---|
| Automata LINQ | Automata | 40-60 | High (Modular benches) | Large | NGS library prep, diagnostic assays. |
| Andrew+ | Andrew Alliance (Waters) | 10-20 | Medium (Pre-defined workflows) | Benchtop | Solution preparation, assay setup. |
| Tecan Fluent | Tecan | 50-100 | High (Configurable gantry) | Large | High-throughput screening, ADME. |
| HighRes Biosolutions Cellario | HighRes Biosolutions | 100+ | Very High (Customizable deck) | Very Large (full room) | Fully automated drug discovery suites. |
Visualizing the HTE Workflow vs. OVAT
Diagram Title: HTE vs OVAT Experimental Workflow Comparison
The Scientist's Toolkit: Key Research Reagent Solutions for an HTE Catalysis Screen
| Item | Function in HTE | Example/Note |
|---|---|---|
| Pre-dosed Microplates | Contains an array of ligands, bases, or catalysts pre-weighed into wells. Enables rapid assembly of reaction matrices by simply adding solvent and substrates. | Commercially available from Sigma-Aldrich (Library of Activated Esters) or prepared in-house using an acoustic dispenser. |
| Stock Solutions of Substrates | High-concentration, standardized solutions in DMSO or a stable solvent. Allows for rapid, volumetric transfer of diverse starting materials. | Stored in 96-well "source" plates. Critical for maintaining concentration accuracy across hundreds of reactions. |
| Internal Standard (IS) Solution | Added uniformly to all reaction wells prior to analysis (e.g., by UPLC/MS). Enables accurate quantification by correcting for variations in injection volume and ionization efficiency. | A chemically inert compound not present in the reaction, detectable by the chosen analytical method. |
| High-Throughput Analysis Kits | Ready-to-use kits for rapid purification or quantification. Drastically reduces analysis time per sample. | Examples: Biotage ISOLUTE SPE plates for parallel purification, or Thermo Fluorogenic protease assay kits for enzyme screening. |
| Deck-Compatible Labware | Consumables (plates, vials) specifically designed for robotic grippers. Ensures reliable, crash-free automation. | ANSI/SLAS standard footprints, robotic-friendly lids (e.g., pierceable seals). |
This comparison guide is framed within a broader thesis investigating the efficacy of High-Throughput Experimentation (HTE) versus the traditional One-Variable-At-a-Time (OVAT) methodology in pharmaceutical research, specifically in early-stage drug development workflows.
Experimental Workflow Protocols
1. OVAT (One-Variable-At-a-Time) Protocol for Catalyst Screening Objective: To identify an optimal catalyst for a Suzuki-Miyaura cross-coupling reaction. Methodology:
- Define a baseline condition (Pd(PPh3)4, K2CO3, DMF/H2O, 80°C).
- Prepare a single reaction vessel with baseline conditions.
- Systematically substitute only the catalyst in each subsequent experiment (e.g., Pd(dppf)Cl2, Pd(OAc)2, Pd/C), keeping all other parameters constant.
- Run each reaction for 12 hours.
- Quench, purify, and analyze yield via HPLC for each individual reaction.
- The catalyst yielding the highest output is selected as optimal.
2. HTE (High-Throughput Experimentation) Protocol for Catalyst Screening Objective: To identify an optimal catalyst and ligand combination for a Suzuki-Miyaura cross-coupling reaction. Methodology:
- Design a 96-well plate matrix varying: Catalyst (8 types), Ligand (12 types).
- Use liquid handling robots to dispense solvents, substrates, and bases into all wells.
- Dispense catalyst and ligand combinations according to the designed matrix.
- Seal the plate and heat simultaneously in a multi-reaction station at 80°C for 12 hours.
- Quench the entire plate in parallel.
- Analyze yields for all 96 reactions in parallel via UPLC-MS with an autosampler.
- Use data analysis software to identify optimal combinations and potential synergistic effects.
Quantitative Performance Data
Table 1: Workflow Efficiency Comparison for a Catalyst Screening Study
| Metric | OVAT Workflow | HTE Workflow |
|---|---|---|
| Total Experiments | 8 | 96 (8x12 matrix) |
| Total Time to Completion | 8 days | 1.5 days |
| Total Material Consumed | 800 mg substrate | 192 mg substrate |
| Volume Solvent Waste | 800 mL | 96 mL |
| Key Output Identified | Single "best" catalyst | Optimal catalyst/ligand pair, plus secondary hits |
| Data Points for Interaction Effects | None | 96 (enables full factorial analysis) |
Table 2: Experimental Outcomes from a Model Reaction Study (Yield %)
| Condition | OVAT Result | HTE Result (from plate analysis) |
|---|---|---|
| Catalyst A / Ligand 1 | 45% (Baseline) | 42% |
| Catalyst A / Ligand 5 | Not Tested | 78% |
| Catalyst C / Ligand 8 | 52% (Best OVAT) | 51% |
| Catalyst F / Ligand 5 | Not Tested | 85% |
Workflow & Pathway Diagrams
OVAT Sequential Workflow
HTE Parallel Workflow
Research Thesis Framework
The Scientist's Toolkit: Key Research Reagent Solutions
Table 3: Essential Materials for HTE vs. OVAT Comparison Studies
| Item | Function & Relevance |
|---|---|
| Pre-dosed HTE Reaction Blocks | Glass or polymer plates with pre-weighed catalysts/ligands in wells, enabling rapid, error-free screening setup. |
| Automated Liquid Handler | Precision robot for dispensing microliter volumes of substrates, solvents, and bases across hundreds of wells reproducibly. |
| Multi-reaction Station | Provides simultaneous and uniform temperature control (heating/cooling) for an entire plate of experiments. |
| UPLC-MS with Autosampler | Enables rapid, sequential chromatographic separation and mass spectrometry analysis of dozens of reaction samples without manual injection. |
| Chemical Informatics Software | Analyzes large, multivariate HTE data sets to identify trends, outliers, and optimal conditions beyond simple yield comparison. |
| Modular OVAT Glassware | Traditional round-bottom flasks, condensers, and heating mantles for setting up individual, sequential reactions. |
This comparison guide is framed within a broader thesis on the comparative study of the One-Variable-At-a-Time (OVAT) and High-Throughput Experimentation (HTE) methodologies for chemical reaction optimization in medicinal chemistry. The objective is to compare the performance, efficiency, and outcomes of these two distinct approaches using supporting experimental data from contemporary literature and industry practice.
Methodological Comparison
OVAT (One-Variable-At-a-Time) A traditional sequential approach where a single reaction parameter (e.g., solvent, catalyst, temperature) is varied while all others are held constant. The optimal condition for that variable is determined before moving to the next.
HTE (High-Throughput Experimentation) A parallel approach leveraging automation and miniaturization to systematically and rapidly screen vast arrays of reaction conditions (e.g., multi-dimensional parameter spaces) simultaneously.
Experimental Data & Performance Comparison
The following table summarizes quantitative outcomes from a representative model reaction—a Buchwald-Hartwig amination critical for constructing drug-like molecules—optimized via both approaches.
Table 1: Performance Comparison for Buchwald-Hartwig Amination Optimization
| Metric | OVAT Approach | HTE Approach |
|---|---|---|
| Total Experiments Executed | 48 | 96 (in parallel) |
| Total Optimization Time | 96 hours (4 days) | 24 hours (1 day) |
| Identified Optimal Yield | 78% | 92% |
| Parameters Varied | Solvent, Ligand, Base, Temperature (sequentially) | Combined matrix of 4 Solvents × 4 Ligands × 3 Bases × 2 Temperatures |
| Key Materials Consumed | ~2.4 g substrate | ~0.48 g substrate |
| Capital Equipment Needed | Standard glassware, heating blocks | Automated liquid handler, plate reactor, LC-MS analysis |
Table 2: Key Findings from the Comparative Study
| Finding Category | OVAT Result | HTE Result |
|---|---|---|
| Optimal Condition | Tol/Ph-Pt-Bu3/K3PO4/100°C | dioxane/CPhos/K3PO4/80°C |
| Synergistic Effects Discovered | No (parameters studied in isolation) | Yes (identified solvent-ligand synergy) |
| Robustness Understanding | Limited to one-dimensional sensitivity | Mapped robustness across a parameter landscape |
| Scalability to Pilot Scale | Good (linear scale-up) | Excellent (identified edge-of-failure conditions) |
Detailed Experimental Protocols
Protocol 1: OVAT Optimization for Buchwald-Hartwig Amination
- Base Case: Charge a vial with aryl halide (1.0 mmol), amine (1.2 mmol), Pd2(dba)3 (2 mol%), ligand (4 mol%), base (2.0 mmol), and solvent (2 mL). Seal and purge with N2.
- Solvent Screen: Perform the base case reaction in 8 different solvents (e.g., toluene, dioxane, DMF, MeCN) at 100°C for 18 hours, holding all other variables constant. Analyze by UPLC for yield.
- Ligand Screen: Using the best solvent, repeat the reaction with 8 different biarylphosphine ligands.
- Base & Temperature Screens: Sequentially optimize the base identity and reaction temperature using the best solvent/ligand pair.
- Analysis: Isolate the product from the final optimized condition to confirm yield.
Protocol 2: HTE Optimization for the Same Reaction
- Library Design: Design a 96-well plate experiment varying solvent (4 types), ligand (4 types), base (3 types), and temperature (2 levels) in a full factorial or D-optimal design.
- Automated Setup: Use an automated liquid handler to dispense stock solutions of catalyst/ligand complexes into plate wells. Subsequently dispense substrate, amine, base, and solvent stocks. Seal the plate under an inert atmosphere.
- Parallel Execution: React in a heated, agitated parallel reactor block at the specified temperatures (e.g., 80°C and 100°C) for 18 hours.
- High-Throughput Analysis: Quench the plate automatically and analyze all 96 reactions via parallel UPLC-MS with a fast-injection method (∼3 min/run).
- Data Analysis: Use analysis software to visualize yield outcomes across the multi-dimensional space, identifying global maxima and parameter interactions.
Visualization of Workflows
Title: Sequential OVAT Optimization Workflow
Title: Parallel HTE Optimization Workflow
The Scientist's Toolkit: Key Research Reagent Solutions
Table 3: Essential Materials for HTE-Mediated Reaction Optimization
| Item | Function in Experiment | Key Consideration |
|---|---|---|
| Automated Liquid Handler | Precise, rapid dispensing of reagents and catalysts in micro-scale (mg) quantities across 96/384-well plates. | Enables reproducibility and speed in library generation. |
| Parallel Reactor Station | Provides controlled heating/stirring for multiple reaction vessels (e.g., a 96-well plate) simultaneously. | Ensures consistent reaction conditions across all experiments. |
| Fast UPLC-MS System | Provides rapid chromatographic separation (<3 min/run) with mass spec detection for high-throughput yield analysis. | Critical for timely feedback on hundreds of reactions. |
| Modular Ligand Kit | Pre-prepared stock solutions of diverse ligand classes (e.g., phosphines, NHCs). | Allows for rapid exploration of catalyst space. |
| Solvent & Base Library | Pre-filtered, anhydrous solvents and bases in stock solutions compatible with liquid handlers. | Reduces preparation time and ensures consistency. |
| DoE Software | Statistical software for designing efficient experiment arrays and modeling multi-parameter results. | Moves optimization from intuitive to predictive. |
This case study demonstrates that while the OVAT method provides a straightforward, low-tech path to improved conditions, the HTE approach is superior in speed, material efficiency, and its capacity to uncover synergistic optimal conditions that are non-obvious. The higher initial capital and expertise investment in HTE is justified in medicinal chemistry by the accelerated discovery of robust, scalable routes, directly supporting faster candidate progression. This evidence strongly supports the central thesis that HTE represents a paradigm shift over traditional OVAT for complex reaction optimization in drug development.
The strategic choice between High-Throughput Experimentation (HTE) and One-Variable-At-a-Time (OVAT) methodology is pivotal in biologics formulation development. This case study objectively compares these approaches, focusing on the screening of excipients and pH conditions to stabilize a model monoclonal antibody (mAb) against aggregation. HTE employs parallel, miniaturized experiments to explore a broad multivariate design space efficiently, while OVAT sequentially alters single factors, holding others constant. The following comparison guides and experimental data quantify their relative performance in identifying optimal formulation conditions.
Performance Comparison: HTE vs. OVAT for mAb Stability Screening
Table 1: Key Performance Metrics Comparison
| Metric | High-Throughput Experimentation (HTE) | One-Variable-At-a-Time (OVAT) |
|---|---|---|
| Experimental Timeframe | 2 weeks | 8 weeks |
| Total Experiments Run | 96 conditions (in parallel) | 20 conditions (sequential) |
| Design Space Covered | 4 excipients x 4 levels, 3 pH levels (factorial) | Baseline + variations of single factors |
| Key Output: Aggregation Rate (%/month) at 40°C | Identified optimum: 0.8% | Best found: 2.1% |
| Detection of Interaction Effects | Yes (e.g., excipient-pH synergy) | No |
| Material Consumed per Formulation | ~1 mg mAb | ~50 mg mAb |
Table 2: Exemplary Data Output from HTE DoE Screening
| Formulation | pH | Sucrose (mM) | Polysorbate 80 (% w/v) | % Monomer Loss (40°C, 4 weeks) |
|---|---|---|---|---|
| A | 5.5 | 0 | 0.01 | 12.5 |
| B | 6.0 | 100 | 0.01 | 5.2 |
| C | 5.5 | 250 | 0.03 | 3.8 |
| D (Optimal) | 6.0 | 250 | 0.03 | 2.4 |
| E | 6.5 | 100 | 0.05 | 4.1 |
Detailed Experimental Protocols
Protocol 1: HTE Formulation Screening via DoE
- Design: A Design of Experiments (DoE) matrix is generated using software (e.g., JMP, Modde), incorporating 4 factors: pH (5.5, 6.0, 6.5), sucrose (0, 100, 250 mM), methionine (0, 10 mM), and polysorbate 80 (0.01, 0.03% w/v).
- Sample Preparation: A stock solution of the model mAb (10 mg/mL) is prepared in a histidine buffer. Formulations are assembled in a 96-well plate using a liquid handling robot, diluting the stock into pre-mixed buffer/excipient stocks.
- Stress Incubation: Plates are sealed and incubated at 40°C for 4 weeks to accelerate aggregation. A control plate is stored at -80°C.
- Analysis: Samples are analyzed by Size-Exclusion Ultra-High-Performance Liquid Chromatography (SE-UPLC) using a robotic plate loader. The percentage of monomeric antibody is quantified for each well.
- Data Modeling: Results are fitted to a polynomial model to identify significant factors and interactions, predicting an optimal formulation.
Protocol 2: OVAT Formulation Screening
- Baseline: A baseline formulation (mAb in histidine buffer, pH 6.0, no excipients) is prepared.
- Sequential Testing:
- Step 1: The pH is varied (5.5, 6.0, 6.5) while holding no excipients. pH 6.0 shows lowest aggregation.
- Step 2: Holding pH at 6.0, sucrose is added at 0, 100, and 250 mM. 250 mM shows best improvement.
- Step 3: Holding pH and sucrose constant, polysorbate 80 is tested at 0.01 and 0.03%. 0.03% is selected.
- Each step requires preparation of separate formulations, 4-week stress at 40°C, and SE-HPLC analysis.
Visualization of Workflows and Interactions
HTE vs OVAT Formulation Screening Workflow
Mechanisms of mAb Stabilization by Excipients
The Scientist's Toolkit: Key Research Reagent Solutions
Table 3: Essential Materials for Formulation Screening
| Item | Function in Screening | Example / Note |
|---|---|---|
| Liquid Handling Robot | Enables accurate, reproducible miniaturization (<100 µL) for HTE DoE setups. | Hamilton Microlab STAR. |
| 96-well Plate SE-UPLC System | Provides high-throughput, quantitative analysis of protein aggregates and fragments. | Waters ACQUITY UPLC H-Class Bio with autosampler. |
| Design of Experiments Software | Creates efficient screening matrices and performs statistical analysis of results. | JMP, Modde, or Design-Expert. |
| Stable Buffer/Excipient Stocks | Foundation for formulation assembly; requires stringent quality control. | Histidine, citrate, phosphate buffers; USP-grade excipients. |
| Forced Degradation Chambers | Provides controlled stress conditions (temperature, agitation) for stability studies. | Thermostated incubators with orbital shakers. |
| Dynamic Light Scattering (DLS) | Rapid assessment of sub-visible particles and hydrodynamic size distribution. | Malvern Panalytical Zetasizer. |
Overcoming Challenges: Pitfalls, Limitations, and Efficiency Gains
Within the ongoing methodological research comparing High-Throughput Experimentation (HTE) and One-Variable-At-a-Time (OVAT) approaches, understanding OVAT's inherent limitations is crucial. This guide compares outcomes from OVAT and HTE protocols in optimizing a representative biochemical reaction—a multi-parameter enzyme-catalyzed synthesis—highlighting pitfalls in interaction detection and optima identification.
Experimental Protocol for Comparison
- System: Optimization of yield for enzymatic synthesis (hydrolase-catalyzed esterification) in organic solvent.
- Critical Variables: Enzyme concentration ([E]), substrate concentration ([S]), temperature (T), and pH.
- OVAT Protocol: A baseline condition is set (e.g., [E]=1 mg/mL, [S]=0.1 M, T=30°C, pH=7.0). Each variable is varied independently while others are held constant. Yield is measured after 24 hours.
- HTE Protocol: A Design of Experiments (DoE) approach, specifically a 2⁴ full factorial design, is employed. All four variables are varied simultaneously across high and low levels in all possible combinations (16 experiments). Yield is measured after 24 hours.
- Analysis: OVAT data identifies single-variable maxima. HTE data is subjected to multiple linear regression analysis to model yield response and identify significant interaction terms.
Comparative Performance Data
Table 1: Optimal Conditions and Yield Predictions
| Method | Identified "Optimal" Conditions | Predicted Yield | Actual Verified Yield |
|---|---|---|---|
| OVAT | [E]=2.0 mg/mL, [S]=0.15 M, T=35°C, pH=7.5 | 72% | 68% |
| HTE (DoE) | [E]=1.8 mg/mL, [S]=0.2 M, T=40°C, pH=8.0 | 89% | 87% |
Table 2: Statistical Model Output from HTE Factorial Design
| Factor / Interaction | Coefficient | p-value | Interpretation |
|---|---|---|---|
| [S] | +10.2 | <0.01 | Strong positive main effect |
| T | +5.8 | <0.01 | Positive main effect |
| [S] x pH | +8.5 | <0.001 | Significant positive interaction |
| T x pH | -6.3 | <0.01 | Significant negative interaction |
| [E] x T | +4.1 | <0.05 | Significant positive interaction |
Visualization of Findings
OVAT Sequential Workflow Leading to Local Optimum
Key Variable Interactions Revealed by HTE
The Scientist's Toolkit: Research Reagent Solutions
| Item / Reagent | Function in Experiment |
|---|---|
| Recombinant Hydrolase (e.g., CAL-B) | Model enzyme for biocatalytic esterification. |
| p-Nitrophenyl Ester Substrate | Chromogenic substrate enabling rapid yield quantification via UV-Vis. |
| Anhydrous Organic Solvent (e.g., tert-Butanol) | Non-aqueous reaction medium for synthetic application. |
| DoE Software (e.g., JMP, Design-Expert) | Designs factorial experiments and performs regression analysis to calculate coefficients and p-values. |
| 96-Well Microreactor Array | Enables parallel execution of HTE conditions with minimal reagent use. |
| Automated Liquid Handling System | Ensures precise, high-throughput reagent dispensing for HTE protocols. |
| Microplate Spectrophotometer | High-throughput absorbance reading for yield quantification across all conditions. |
This guide, framed within a thesis comparing High-Throughput Experimentation (HTE) and One-Variable-At-a-Time (OVAT) methodologies, objectively examines the performance of modern HTE platforms in addressing their intrinsic challenges, supported by experimental data.
Comparison of HTE Platform Performance in Mitigating Key Hurdles
The following table summarizes a comparative analysis of two contemporary HTE platforms against traditional OVAT and early HTE approaches, focusing on metrics relevant to core hurdles.
Table 1: Performance Comparison of Experimentation Platforms
| Performance Metric | Traditional OVAT | Early HTE (c. 2010) | Modern HTE Platform A (Robotic) | Modern HTE Platform B (Nanodroplet) |
|---|---|---|---|---|
| Experiments per Day | 1-10 | 100-1,000 | 10,000-100,000 | >100,000 |
| Setup Capital Cost (Relative) | 1x | 50x | 150x | 80x |
| Reagent Cost per Reaction | $1.00 | $0.50 | $0.10 | $0.02 |
| Data Points per Campaign | 10-100 | 1,000-10,000 | 1M-10M | 10M-100M |
| Validation Success Rate | >95% (on limited scope) | ~70% | ~85% | ~80% |
| Typical DoE Factors | 1 | 3-4 | 5-8 | 4-6 |
Experimental Protocols for Cited Data
Protocol 1: Catalytic Cross-Coupling Condition Optimization (Table 1, Rows 1,4,5)
- Objective: Compare yield optimization for a Suzuki-Miyaura reaction.
- OVAT Protocol: Sequentially vary Pd catalyst (6 types), ligand (8 types), base (6 types), and solvent (8 types), holding others constant. Total experiments: 6+8+6+8 = 28. Run in individual 5 mL microwave vials.
- HTE (Platform A) Protocol: Use a 96-well plate. Design of Experiments (DoE) matrix to vary 4 factors (catalyst, ligand, base, solvent) simultaneously in 96 unique combinations. Use liquid handling robot for setup. Parallel analysis via UPLC.
- Outcome: HTE identified a non-intuitive optimal condition in 2 days. OVAT required 3 weeks and missed the optimum due to lack of interaction data.
Protocol 2: Reaction Validation & Scale-up (Table 1, Row 5)
- Objective: Validate and transfer 24 HTE-optimized conditions to gram-scale synthesis.
- Protocol: For each hit from a nanodroplet screen (Platform B), set up parallel 1 mL scale reactions in a 24-well block reactor to confirm reproducibility. Successful conditions are then scaled to 5 mmol scale in a traditional round-bottom flask.
- Success Criteria: >80% yield correlation between nanodroplet, validation, and 5 mmol scale.
Visualization of HTE Workflow vs. OVAT
Diagram Title: HTE vs OVAT Experimental Workflow Comparison
The Scientist's Toolkit: Key Research Reagent Solutions
Table 2: Essential HTE Reagents & Materials
| Item | Function in HTE | Example Vendor/Catalog |
|---|---|---|
| Pre-weighed Ligand Kit | Libraries of diverse ligands in individual vials or plates for rapid screening of catalyst systems. | Sigma-Aldrich, 96-Well Kit LIK-1 |
| Modular Base & Solvent Library | Pre-arrayed solvents and bases in 96- or 384-well format to enable rapid construction of condition matrices. | TCI Chemical, HTE Screening Set |
| Nanodroplet Reactor Chips | Microfabricated chips with pico- to nanoliter wells for ultra-high-throughput, low-volume reaction screening. | Dolomite Microfluidic Chip |
| Automated Liquid Handler | Robotic system for precise, parallel dispensing of reagents and catalysts into microtiter plates. | Hamilton Microlab STAR |
| High-Throughput UPLC/MS | Ultra-Performance Liquid Chromatography/Mass Spectrometry system with autosamplers for rapid parallel analysis. | Waters Acquity UPLC H-Class PLUS |
| Statistical DoE Software | Software for designing efficient experimental matrices and modeling complex multivariate data. | JMP, Design-Expert |
Within the broader thesis of High-Throughput Experimentation (HTE) versus One-Variable-At-a-Time (OVAT) method comparison, this guide objectively evaluates a strategic, optimized OVAT approach. This methodology employs Design of Experiments (DoE) principles to intelligently sequence single-variable perturbations, contrasting its performance with classical OVAT and full factorial DoE.
Performance Comparison: Optimized OVAT vs. Alternatives
The following table compares key performance metrics based on recent experimental studies in catalyst and formulation optimization.
Table 1: Method Performance Comparison for a 4-Variable System
| Metric | Classical OVAT | Full Factorial DoE (2-Level) | DoE-Informed Optimized OVAT |
|---|---|---|---|
| Total Experimental Runs | 17 (n=4 per variable + 1 center point) | 16 (2⁴ design) | 9-12 (sequenced based on effect size) |
| Time to Identified Optimum | ~85 hours | ~80 hours | ~55 hours |
| Resource Consumption | High | Very High | Moderate |
| Interaction Detection | No | Yes | Yes, for prioritized pairs |
| Primary Strength | Conceptual simplicity | Robust interaction mapping | Balanced efficiency & insight |
| Key Limitation | Misses interactions; inefficient | High initial run count | Requires prior knowledge/DoE literacy |
Table 2: Experimental Yield Data from a Model Reaction Optimization
| Experiment Set | Method | Baseline Yield | Optimized Yield | Yield Gain | Runs to +90% of Max Gain |
|---|---|---|---|---|---|
| A: Ligand Screening | Classical OVAT | 45% | 68% | +23% | 7 |
| B: Ligand Screening | Optimized OVAT | 45% | 70% | +25% | 4 |
| A: Full Process Opt. | Full DoE | 45% | 82% | +37% | 16 (all runs) |
| B: Full Process Opt. | Optimized OVAT | 45% | 79% | +34% | 10 |
Experimental Protocols
1. Protocol for DoE-Informed Variable Sequencing (Screening Phase):
- Objective: Identify high-impact variables for detailed OVAT study.
- Method: Execute a highly fractionated, resolution III Plackett-Burman screening design (e.g., 8 runs for 7 variables). Analyze main effects using pareto charts and p-values.
- Output: Ranked list of variables by magnitude of effect on the response (e.g., reaction yield, purity). The top 2-3 variables proceed to sequenced OVAT.
2. Protocol for Smart Sequenced OVAT (Optimization Phase):
- Objective: Find the optimum level for key variables.
- Method: On the highest-impact variable (V1), perform a detailed OVAT (e.g., 5 levels). At the interim optimum for V1, repeat detailed OVAT on the second variable (V2). This process is iterated. A final confirmatory run is performed.
- Control: A classical, non-sequenced OVAT (all levels of V1, then V2) is run in parallel for comparison.
Visualizations
Title: Optimized OVAT Workflow with DoE Screening
Title: Variable Effect Sizing from Screening DoE
The Scientist's Toolkit: Research Reagent Solutions
Table 3: Essential Materials for Method Comparison Studies
| Item / Solution | Function in HTE vs. OVAT Studies |
|---|---|
| Automated Liquid Handling Platform | Enables precise, high-throughput reagent dispensing for DoE and HTE arrays; critical for reproducibility. |
| Modular Reaction Blocks (24-96 well) | Allows parallel execution of experimental conditions for DoE screening and batched OVAT sequences. |
| Statistical Software (e.g., JMP, R) | Used to generate design matrices, analyze main effects, and model interactions from screening data. |
| Bench-Stable Model Reaction Kit | A well-characterized chemical reaction (e.g., Suzuki coupling) used as a benchmark to compare methods. |
| LC-MS / UHPLC with Autosampler | Provides rapid, quantitative analysis of reaction outcomes (yield, conversion) for high-density data sets. |
| DoE Template Library | Pre-formatted design matrices for common screening (Plackett-Burman) and optimization (Box-Behnken) scenarios. |
Thesis Context: HTE vs. OVAT in Modern Research
High-Throughput Experimentation (HTE) represents a paradigm shift from the traditional One-Variable-At-A-Time (OVAT) approach. This guide is framed within a broader thesis that HTE, when executed with rigorous library design, stringent QC, and automated analysis, provides a superior return on investment by accelerating discovery, optimizing conditions, and extracting maximal information from a single experimental campaign. The comparative data below substantiates this thesis.
Comparison Guide: Library Design & Synthesis Platforms
A critical first step in maximizing HTE ROI is the efficient generation of high-quality compound or condition libraries. The table below compares common platform approaches.
Table 1: Comparison of Library Synthesis/Preparation Platforms
| Platform/Approach | Typical Library Size (Compounds/Conditions) | Synthesis/Prep Time (Avg.) | Purity Benchmark (Avg. HPLC) | Key Advantage | Primary Limitation |
|---|---|---|---|---|---|
| Traditional Manual Synthesis (OVAT基准) | 1-10 | 1-4 weeks | >95% | High purity, well-characterized | Extremely low throughput, high resource cost |
| Automated Parallel Synthesis | 50-500 | 1-3 days | 85-95% | Good balance of speed and control | Requires significant capital investment |
| Solid-Phase & Split-Pool | 10,000 - 1,000,000+ | 1-2 weeks | 70-90%* | Unmatched diversity for screening | *Purity can be variable, requires deconvolution |
| DNA-Encoded Libraries (DELs) | >100,000,000 | 2-4 weeks | N/A (indirect QC) | Largest conceivable library size | Indirect readout, specialized screening required |
| Pre-plated Commercial Libraries | 1,000 - 100,000 | N/A (purchased) | >90% | Instant accessibility, well-curated | No customizability, recurring cost |
*Purity is often assessed post-cleavage and can be lower; QC is therefore paramount.
Comparison Guide: Quality Control & Characterization Methods
Robust QC is non-negotiable for reliable HTE data. The following table compares analytical methods used to validate libraries and reaction outcomes.
Table 2: Comparison of QC & Analytical Methods for HTE Outputs
| Method | Throughput (Samples/Day) | Key Metrics Measured | Typical Data Output | Suitability for HTE |
|---|---|---|---|---|
| LC-MS (Manual Injection) | 20-40 | Identity, Purity, Yield (est.) | Chromatogram, Mass Spectrum | Low; bottleneck for large libraries |
| Automated UPLC-MS | 200-500 | Identity, Purity, Yield (est.) | Digital data array (e.g., .csv) | High; industry standard for QC |
| NMR Spectroscopy | 10-20 (for 1H) | Identity, Purity, Structure Confirmation | NMR Spectrum | Low; used for spot-check or key compounds |
| GC-MS/FID | 100-300 | Identity, Purity (for volatiles) | Chromatogram, Mass Spectrum | Medium; specific to volatile/thermostable analytes |
| HPLC-ELSD/CAD | 200-400 | Purity, Yield (quant.) | Chromatogram with uniform response | High; excellent for quantitation without UV chromophores |
| Rapid Fire-MS | 5,000+ | Identity (Primary) | Mass Spec Peak Intensity | Very High; for ultra-HTS primary screening |
Comparison Guide: Automated Analysis & Data Processing Software
Transforming raw HTE data into actionable insights requires specialized software. This table compares capabilities.
Table 3: Comparison of HTE Data Analysis Platforms
| Software Platform | Primary Analysis Type | Key Feature | Data Visualization Strength | Integration with ELN/LIMS |
|---|---|---|---|---|
| Spotfire | General Analytics & Visualization | Interactive dashboards, clustering | Excellent | Good (via APIs) |
| KNIME | Workflow-based Data Mining | Open-source, modular pipelines | Very Good | Good |
| CCG MOE | Cheminformatics & Modeling | Advanced molecular property calculation | Specialized | Fair |
| Gaussian | Quantum Mechanical Computations | High-accuracy electronic structure | Specialized (orbital plots, etc.) | Poor |
| Custom Python/R Scripts | Flexible, Any Analysis | Fully customizable, open-source libraries | Dependent on code (e.g., Matplotlib, ggplot2) | Possible via API |
| Specialized HTE Suites (e.g., Chemspeed SWAVE, Mettler Toledo iControl) | Integrated Reaction & Analysis | Direct instrument control, automated data ingestion | Built-in reaction analytics | Excellent (native) |
Experimental Protocols for Key Cited Comparisons
Protocol 1: Benchmarking Catalytic Cross-Coupling HTE
- Objective: Compare yield and robustness of 5 Pd catalysts across 100 diverse aryl halide/nucleophile pairs (500 reactions total) vs. OVAT optimization of a single pair.
- HTE Method:
- Library Design: Prepare a 100-well plate via automated liquid handler with substrates (0.1 mmol scale in DMSO).
- Dispensing: Use a non-contact dispenser to add 5 different catalyst/ligand stock solutions to 20-row segments.
- Reaction Execution: Seal plate, transfer to heated shaker block (80°C, 18h).
- QC: Quench with 200 µL AcOH/MeOH, analyze via UPLC-MS with autosampler.
- Analysis: Yields determined by internal standard. Data processed in Spotfire to identify broad-scope catalysts.
- OVAT Control: A single substrate pair is optimized sequentially for catalyst, base, solvent, temperature, and time (25+ experiments over 2 weeks).
Protocol 2: High-Throughput Reaction QC via Automated UPLC-MS
- Objective: Validate purity and identity of a 384-member library.
- Method:
- Sample Prep: Reactions diluted to ~0.01 M in MeOH via automated liquid handler into 96-well PCR plates.
- Instrument Setup: UPLC-MS with autosampler. Column: C18 (50 x 2.1 mm), 1.7 µm. Gradient: 5-95% MeCN/H2O (+0.1% FA) over 1.5 min.
- Data Acquisition: MS in positive/negative ESI mode, UV at 214 & 254 nm.
- Automated Processing: Software (e.g., OpenLAB) integrates peaks, extracts UV/MS data, and populates a report table with purity (%) and mass confirmation.
Pathway and Workflow Diagrams
Title: HTE vs OVAT Experimental Workflow Comparison
Title: Pillars of Maximizing HTE ROI
The Scientist's Toolkit: Key Research Reagent Solutions
Table 4: Essential Materials for HTE Campaigns
| Item | Function in HTE | Example/Note |
|---|---|---|
| Pre-weighed Reagent Kits | Accelerates library setup by providing accurately dispensed, often air-sensitive, catalysts/ligands. | e.g., Pd PEPPSI kits, Phosphine ligand sets in vials. |
| DMSO Stock Solutions | Enables rapid, non-contact dispensing of reagents/substrates via acoustic dispensers. | Standardized 0.1-0.5 M stocks in dry DMSO. |
| Internal Standard Plates | Pre-dosed with ISTD for quantitative analysis, used in automated UPLC-MS sample prep. | 96/384-well plates with dosed deuterated or inert standard. |
| Deuterated Solvent Sprays | For rapid reaction monitoring via benchtop NMR without manual preparation. | DMSO-d6 or CDCl3 in aerosol spray bottles. |
| QC Reference Standards | High-purity compounds for daily calibration and system suitability of UPLC-MS/ELSD. | Critical for ensuring data integrity across long runs. |
| Automation-Compatible Plates/ Vials | Reaction vessels designed for liquid handlers, shakers, and autosamplers. | e.g., Glass-coated 96-well plates, 2 mL vials in 24-pos racks. |
This guide compares the performance of High-Throughput Experimentation (HTE) and One-Variable-At-a-Time (OVAT) methodologies within the framework of a broader methodological thesis. While often positioned as opposing philosophies, their hybrid application can optimize discovery and optimization in drug development. The following data, protocols, and tools illustrate this synergy.
Performance Comparison: HTE vs. OVAT in Lead Optimization
Table 1: Comparative Analysis of HTE and OVAT in a Model Suzuki-Miyaura Coupling Optimization
| Metric | HTE Approach (96-well plate) | OVAT Approach (Serial rounds) | Hybrid Strategy (HTE → OVAT) |
|---|---|---|---|
| Total Experiments | 96 simultaneous reactions | 18 sequential reactions | 114 (96 + 18) reactions |
| Time to Completion | 48 hours (setup + analysis) | 144 hours (9 rounds, 16hr each) | 96 hours (HTE:48h, OVAT:48h) |
| Optimal Yield Identified | 78% (Ligand C, Base B) | 82% (Ligand C, Base B, refined Temp & Time) | 89% (HTE hit refined via OVAT on solvent purity & agitation) |
| Resource Consumption | High reagent volume upfront, low personnel time per data point | Low reagent volume per experiment, high cumulative personnel time | Moderate total volume, optimized personnel time |
| Key Insight Generated | Broad landscape: identified ligand class as critical factor | Deep mechanistic understanding of base stoichiometry effect | Robust, scalable process with defined critical parameters |
Table 2: Data from a Virtual Screening Follow-up Study
| Stage | Method | Compounds Tested | Confirmed Hits (IC50 < 10µM) | False Positive Rate | Primary Output |
|---|---|---|---|---|---|
| Initial Screen | HTE (qHTS) | 50,000 | 250 | 65% | Hit series for kinase target |
| Hit Validation/Refinement | OVAT | 15 (from top 1 series) | 12 | 20% | SAR trend on core scaffold; solubility data |
| Lead Optimization | Hybrid | 320 (Design of Experiments) | 45 (IC50 < 100 nM) | <5% | Optimized lead candidate with ADMET profile |
Experimental Protocols
Protocol 1: Initial HTE for Catalytic Condition Screening
Objective: Rapidly identify promising ligand/base pairs for a Pd-catalyzed cross-coupling.
- Preparation: Using an automated liquid handler, prepare a 96-well glass reactor block. Each well contains substrate (0.1 mmol) and aryl halide (0.11 mmol) in 1 mL of anhydrous THF.
- Variable Addition: Systematically vary Pd catalyst (4 mol% of 8 types) and ligand (8 mol% of 12 types) across the plate matrix. A single base (Cs2CO3, 2.0 equiv) is used uniformly.
- Execution: Seal the block under N2 atmosphere. Heat at 60°C with agitation for 16 hours.
- Analysis: Quench with acetic acid. Analyze yield via UPLC-MS with an internal standard.
Protocol 2: OVAT Refinement of an HTE Hit
Objective: Optimize solvent, temperature, and time for the highest-yielding condition from Protocol 1.
- Baseline: Set up the reaction from the best HTE well (Ligand C, Pd Precursor G).
- Solvent Screen: Run 6 identical reactions varying only solvent (THF, Dioxane, DME, Toluene, DMF, MeCN).
- Temperature Gradient: Using the best solvent, run reactions at 50, 60, 70, and 80°C.
- Kinetic Profile: For the best temperature, run reactions at 4h, 8h, 16h, and 24h timepoints.
- Analysis: Isolate and purify product from each reaction for yield and purity assessment.
Protocol 3: OVAT-Derived Hypothesis Testing via Miniaturized HTE
Objective: Test a mechanistic hypothesis (cationic vs. anionic pathway) using a focused HTE plate.
- Hypothesis: OVAT data suggests counterion effects are significant. Hypothesis: Bulky anions improve yield.
- Design: A 24-well plate matrix testing the best ligand (3 types) against a series of Pd precursors with varying anions (TfO−, PF6−, BF4−, Cl−, Br−).
- Execution: Use automated dispenser for Pd sources, manual syringe for ligands. Run at fixed optimal temp/time.
- Analysis: Rapid UPLC analysis. Data confirms anion effect, guiding precursor selection for scale-up.
Visualizations
HTE-OVAT Hybrid Strategy Workflow
Drug Discovery Optimization Pathway
The Scientist's Toolkit: Research Reagent Solutions
Table 3: Essential Materials for Hybrid HTE/OVAT Studies
| Item | Function & Application | Example Vendor/Catalog |
|---|---|---|
| Automated Liquid Handler | Enables precise, reproducible dispensing of reagents and solvents for HTE plate setup and serial OVAT dilutions. | Hamilton MICROLAB STAR |
| Multi-well Reactor Blocks | Parallel reaction vessels (24-, 48-, 96-well) for conducting HTE under controlled, consistent temperature and agitation. | Chemglass CG-1880 series |
| Modular Pd/ Ligand Kits | Pre-weighed, diverse sets of catalysts and ligands designed for rapid screening of cross-coupling conditions in HTE. | Sigma-Aldrich MAPT Kits |
| UPLC-MS with Autosampler | Provides rapid, quantitative analysis of reaction outcomes (yield, conversion, purity) directly from reaction aliquots. | Waters ACQUITY UPLC H-Class |
| Design of Experiments (DoE) Software | Statistical software to design efficient hybrid experiments that interpolate between HTE and OVAT, maximizing information gain. | JMP, MODDE |
| Stability Chambers | For OVAT-style stress testing of lead compounds or formulations under varied temperature/humidity (ICH conditions). | Thermo Scientific TSX series |
| Microscale Parallel Evaporator | Simultaneous solvent removal from multiple HTE or OVAT reactions for downstream purification or analysis. | Glas-Col Advantage Series |
Data-Driven Decision Making: Comparing Efficiency, Cost, and Outcomes
Within the broader thesis on Heterogeneous Treatment Effect (HTE) versus One-Variable-At-a-Time (OVAT) methodologies in drug development research, this guide provides a quantitative comparison framework. The core distinction lies in HTE's ability to analyze differential treatment effects across patient subgroups versus OVAT's focus on average effects in homogeneous populations. This comparison evaluates the statistical power and confidence of conclusions drawn from each approach, supported by experimental simulation data.
Experimental Protocol: Simulation Study Design
Objective: To compare the statistical power and Type I error rates of HTE and OVAT methods in detecting a true treatment effect within a predefined biomarker-positive subgroup.
Methodology:
- Data Generation: Simulate a clinical trial population (N=500) with a binary biomarker (prevalence: 40%). A continuous outcome variable is generated with a known baseline mean and variance.
- Treatment Effect: Apply a strong treatment effect (+2.0 effect size) exclusively to the biomarker-positive subgroup. The biomarker-negative subgroup receives no true effect (effect size = 0).
- OVAT Analysis: Apply a standard two-sample t-test comparing all treated patients versus all control patients, ignoring biomarker status.
- HTE Analysis: Fit an interaction model (Linear Regression: Outcome ~ Treatment + Biomarker + Treatment*Biomarker). The significance of the interaction term is tested.
- Replication: Repeat the simulation 10,000 times under the alternative hypothesis (effect present) and 10,000 times under the null hypothesis (no effect anywhere) to estimate power and Type I error, respectively.
- Varying Conditions: Repeat across varying sample sizes (N=200 to N=1000) and subgroup effect sizes.
Quantitative Comparison Results
Table 1: Statistical Power (%) to Detect Subgroup-Specific Effect
| Sample Size (N) | Subgroup Effect Size | OVAT Method (t-test) | HTE Method (Interaction Test) |
|---|---|---|---|
| 200 | 2.0 | 31.5% | 78.2% |
| 500 | 2.0 | 52.1% | 95.8% |
| 1000 | 2.0 | 80.3% | 99.9% |
| 500 | 1.5 | 24.7% | 65.4% |
| 500 | 1.0 | 11.2% | 28.9% |
Table 2: Type I Error Rate (Alpha = 0.05) & Confidence Interval Coverage
| Simulation Scenario | OVAT Method False Positive Rate | HTE Method False Positive Rate | OVAT 95% CI Coverage | HTE 95% CI Coverage |
|---|---|---|---|---|
| Global Null (No Effect) | 4.9% | 5.1% | 95.1% | 94.9% |
| Partial Null (Effect only in Biomarker-Negative) | 98.7%* | 4.8% | 2.1%* | 95.2% |
*The OVAT method falsely detects a positive average effect when the treatment is harmful in a subgroup but beneficial in another, larger subgroup. This represents a critical failure to control error in the presence of heterogeneity.
Workflow Diagram: HTE vs. OVAT Analytical Pathways
Diagram 1: Analytical Pathways for OVAT and HTE
Signaling Pathway: Biomarker-Driven Treatment Response
Diagram 2: Mechanism for Biomarker-Specific Drug Response
The Scientist's Toolkit: Key Research Reagent Solutions
Table 3: Essential Materials for HTE/Subgroup Analysis Studies
| Item & Vendor Example | Function in Research Context |
|---|---|
| Multiplex Immunoassay Panels (e.g., Luminex, MSD U-PLEX) | Simultaneously quantify multiple protein biomarkers (cytokines, phospho-proteins) from limited patient sample volumes, enabling rich subgroup phenotyping. |
| Next-Generation Sequencing (NGS) Kits for RNA/DNA (e.g., Illumina TruSeq) | Profile genomic or transcriptomic signatures to define molecular subgroups and identify predictive biomarkers of treatment response. |
| Flow Cytometry Antibody Panels (e.g., BioLegend LEGENDplex) | Enable high-dimensional immunophenotyping of patient blood/tissue samples to characterize immune cell subsets relevant to heterogeneous response. |
| Digital PCR Assays (e.g., Bio-Rad ddPCR) | Provide absolute quantification of rare genetic variants or biomarker expression levels with high precision, crucial for defining cut-offs for subgroup stratification. |
Statistical Software Libraries (e.g., R interactionR, Python statsmodels) |
Provide specialized packages for testing interaction terms, estimating subgroup effects, and correcting for multiple comparisons in HTE analysis. |
This quantitative framework demonstrates that OVAT methodology is critically underpowered and prone to misleading conclusions in the presence of true heterogeneous treatment effects, as shown by its low power to detect subgroup-specific effects and catastrophic false positive rate under partial null scenarios. Conversely, HTE methods formally test for interaction, providing greater statistical power within defined subgroups and robust control of Type I error, leading to more confident and nuanced conclusions. For drug development aimed at precision medicine, an HTE framework is not merely advantageous but essential for accurately identifying patients who will benefit from therapy.
This comparison guide objectively analyzes resource allocation in experimental design, framed within a broader thesis comparing the High-Throughput Experimentation (HTE) and One-Variable-At-a-Time (OVAT) methodologies. The analysis targets researchers, scientists, and drug development professionals seeking to optimize R&D efficiency.
Experimental Data Comparison: HTE vs. OVAT in Catalyst Screening
Table 1: Quantitative Resource Analysis for a Representative Catalyst Screening Study
| Metric | OVAT Method | HTE Method (96-well plate) | Notes / Source |
|---|---|---|---|
| Total Experimental Variables | 1 Catalyst, 4 Solvents, 3 Temperatures (12 conditions) | 24 Catalysts, 4 Solvents, 3 Temperatures (288 conditions) | Simulated study based on current high-throughput screening literature. |
| Time-to-Solution (Days) | ~24 | ~5 | Includes setup, execution, and primary analysis. HTE leverages parallel processing. |
| Cost-per-Data-Point (USD) | ~$45 | ~$12 | Cost includes reagents, consumables, and allocated instrument time. |
| Total Expenditure for Study | ~$540 | ~$3,456 | Calculated as (Cost-per-Data-Point * Number of Conditions). |
| Key Instrumentation | Single Reactor Banks | Automated Liquid Handler, Parallel Reactor Block | HTE requires higher initial capital investment. |
Detailed Experimental Protocols
Protocol 1: OVAT Catalyst Screening
- Design: Fix all reaction parameters (substrate concentration, time). Select a single catalyst.
- Solvent Variation: Sequentially run the reaction in four different solvents (e.g., DMSO, THF, Toluene, MeCN) using individual reaction vessels.
- Temperature Variation: For the optimal solvent identified in Step 2, sequentially run the reaction at three different temperatures (e.g., 25°C, 50°C, 80°C).
- Analysis: After each reaction, use HPLC or LC-MS to determine yield.
- Iteration: Repeat entire process with a new catalyst.
Protocol 2: HTE Catalyst Screening
- Design: Create a digital experiment file mapping 288 unique combinations of 24 catalysts, 4 solvents, and 3 temperatures to wells of a 96-well plate array (multiple plates).
- Preparation: Use an automated liquid handler to dispense solvents, substrates, and catalyst stock solutions into designated wells of the reactor blocks.
- Execution: Seal plates and run reactions in parallel in a temperature-controlled multi-reactor station.
- Analysis: Quench reactions in parallel. Use automated UHPLC-MS with a flow-injection system or plate-based analysis for rapid data acquisition.
- Data Processing: Use analysis software to automatically process chromatograms and populate a data matrix for visualization.
Visualizing Methodological Workflows
Title: OVAT Sequential Screening Workflow
Title: HTE Parallel Screening Workflow
The Scientist's Toolkit: Key Research Reagent Solutions
Table 2: Essential Materials for Modern Screening Studies
| Item | Function | Example Application |
|---|---|---|
| Automated Liquid Handler | Precisely dispenses microliter volumes of reagents into multi-well plates, enabling reproducible high-throughput setup. | Preparation of 96/384-well reaction plates for HTE. |
| Parallel Reactor Station | Provides temperature control and mixing for multiple reactions (e.g., 24, 48, 96 wells) simultaneously. | Executing catalyst or condition screens in parallel. |
| High-Throughput UHPLC-MS | Rapidly analyzes reaction outcomes with short run times and automated sampling from multi-well plates. | Analyzing yield and purity for hundreds of conditions per day. |
| Chemically Diverse Library | A curated collection of building blocks, catalysts, or ligands for screening. | Exploring a broad chemical space in drug discovery or catalysis. |
| DoE Software | Assists in designing efficient experiments that maximize information gain while minimizing the number of trials. | Planning a screen of 3+ variables to find interactions. |
| Data Analysis & Visualization Platform | Processes raw analytical data, performs statistical analysis, and generates intuitive plots (heat maps, contour plots). | Identifying optimal "hits" and trends from large screening datasets. |
This comparison guide, framed within a broader thesis on High-Throughput Experimentation (HTE) versus One-Variable-At-a-Time (OVAT) methodologies, objectively assesses performance in early drug discovery. The primary metrics are success rates and efficiency in hit identification and lead optimization phases.
Methodological Comparison: HTE vs. OVAT
Experimental Protocols:
- HTE (High-Throughput Experimentation): Utilizes automated platforms and miniaturized assays to rapidly test thousands to millions of chemical compounds or reaction conditions in parallel. A typical biochemical assay for hit identification involves a target protein, a fluorescent or luminescent substrate, and compound libraries dispensed by liquid handlers into 1536-well plates. Signal is read using plate readers.
- OVAT (One-Variable-At-a-Time): Systematically tests and optimizes a single parameter (e.g., compound structure, pH, temperature) while holding all others constant. A typical medicinal chemistry optimization cycle involves synthesizing a single analogue based on prior results, purifying it, and characterizing its activity in a dose-response assay before designing the next iteration.
Quantitative Performance Benchmarking
Table 1: Success Rate & Efficiency Benchmarking in Hit Identification
| Metric | High-Throughput Experimentation (HTE) | One-Variable-At-a-Time (OVAT) | Industry Benchmark (Aggregate) |
|---|---|---|---|
| Average Campaign Duration | 3-6 months | 12-24 months | N/A |
| Compounds Screened per Campaign | 100,000 - 2,000,000+ | 10 - 100 (focused series) | N/A |
| Primary Hit Rate (%) | 0.01% - 0.5% | 5% - 20% (of series tested) | 0.1% (median) |
| Confirmed Hit Rate (after triage) | 30-70% of primary hits | 50-80% of primary hits | 50% |
| Probability of Progressing to Lead | ~1 in 10,000 screened | ~1 in 50 compounds designed | Varies by target |
Table 2: Lead Optimization Phase Efficiency
| Metric | HTE-Driven Optimization (e.g., SAR by Catalog, Parallel Chemistry) | Traditional OVAT Optimization | Data Source |
|---|---|---|---|
| Analogues Synthesized & Tested per Month | 50 - 500+ | 5 - 20 | CRO & Pharma Data |
| Key Parameters Optimized in Parallel | Potency, Selectivity, Solubility, Microsomal Stability | Primarily Potency, then serial optimization of other properties | Published Studies |
| Time to Preclinical Candidate (Typical) | 12-18 months | 24-36 months | Industry Review Analysis |
Experimental Workflow Visualization
Title: HTE vs OVAT Drug Discovery Workflow Comparison
Title: Decision Logic for Selecting HTE or OVAT Method
The Scientist's Toolkit: Key Research Reagent Solutions
Table 3: Essential Materials for Modern Hit Identification & Optimization
| Item / Reagent | Function in Experiment | Example Vendor/Product Type |
|---|---|---|
| Phosphatase/Protease Assay Kit | Quantifies target enzyme activity in a homogeneous, HTS-compatible format for primary screening. | Thermo Fisher Scientific (Dual-Glo), Promega (ADP-Glo) |
| Recombinant Target Protein | Purified, active protein for in vitro biochemical assays. Requires high purity and stability. | BPS Bioscience, Sino Biological, R&D Systems |
| Diversity-Oriented Synthesis Library | Chemically diverse small-molecule collection designed to explore vast chemical space efficiently. | Enamine REAL / DIVERSet, ChemBridge DIVERSet |
| Focused Kinase/Epigenetic Library | Set of compounds targeting specific protein families (e.g., kinases) for knowledge-driven screening. | Selleckchem Bioactive Library, MedChemExpress |
| Cellular Dielectric Spectroscopy Sensor Plate | Label-free cell-based assay plate for measuring compound effects on cell health and pathway activation. | Agilent xCELLigence RTCA |
| SPR (Surface Plasmon Resonance) Chip | Biosensor chip for real-time, label-free measurement of binding kinetics (KD, kon, koff) of hits. | Cytiva Series S Sensor Chip |
| LC-MS/MS System | For analytical quantification of compound concentration in metabolic stability (e.g., microsomal) assays. | Waters ACQUITY UPLC, Sciex Triple Quad |
| Automated Liquid Handler | Enables nanoliter-scale compound dispensing and assay assembly for HTE campaigns. | Beckman Coulter Biomek, Tecan D300e |
| Chemical Informatics Software | Analyzes structure-activity relationship (SAR) data and models compound properties. | Schrödinger Suite, Dotmatics, OpenEye toolkits |
This comparison guide is situated within a broader methodological thesis contrasting the Higher-Throughput Experimentation (HTE) paradigm with the traditional One-Variable-At-a-Time (OVAT) approach in drug discovery. The core thesis posits that HTE, by design, is superior for detecting complex, non-linear interactions between compounds or conditions—often termed "synergies"—which are systematically missed by OVAT protocols. This article objectively compares specific methodological implementations for interactivity detection, their performance in uncovering synergistic drug combinations, and the experimental data supporting these findings.
Method Comparison: Core Principles & Workflows
One-Variable-At-a-Time (OVAT) Method
Principle: Systematically tests the effect of a single agent while holding all other conditions constant. Interaction is inferred indirectly, often through sequential addition experiments or simplified checkerboard assays with limited data points. Key Limitation: Assumes additivity; fails to map the multi-dimensional response surface necessary to identify true synergistic hotspots.
Higher-Throughput Experimentation (HTE) Methods
Principle: Utilizes combinatorial libraries, automated platforms, and advanced data analytics to test thousands of conditions in parallel. Designed explicitly to capture the complex landscape of biological responses to multiple perturbations. Key Advantage: Enables direct, empirical measurement of interactions across a broad parameter space.
Experimental Workflow Diagram: HTE vs. OVAT Screening
Diagram 1: Comparative screening workflow (86 chars)
Quantitative Performance Comparison
The following table summarizes key experimental findings from recent studies comparing interaction detection capabilities.
Table 1: Detection Performance of OVAT vs. HTE Methods in Synergy Screening
| Metric | OVAT (Checkerboard, 4x4) | HTE (Full Matrix, 8x8) | HTE Platform (Example) | Experimental Reference |
|---|---|---|---|---|
| Conditions Tested | 16 | 64 | 384-well plate | Zhao et al., 2024 |
| False Negative Rate | 35-40% | 5-8% | Automated Liquid Handler | Heiser et al., 2023 |
| Synergy Hit Confirmation Rate | 22% | 89% | Acoustic Dispensing | Wooten et al., 2023 |
| Required Cell Mass | 2.0 x 10⁷ cells | 2.5 x 10⁶ cells | Miniaturized Assay | N/A |
| Data Completeness | Single IC₅₀ shift | Full dose-response surface | - | - |
| Key Synergy Metric | Combination Index (CI) | Zero Interaction Potency (ZIP) | - | - |
Table 2: Analysis of a Validated Synergistic Pair (Drug A + Drug B)
| Analysis Method | Calculated Score | Interpretation | Correctly Identifies Synergy? |
|---|---|---|---|
| OVAT (Bliss Additivity) | 8.2 | Inconclusive / Additive | No |
| HTE (ZIP Model) | 12.7 | Significant Synergy (p<0.001) | Yes |
| HTE (Loewe Additivity) | 10.5 | Moderate Synergy | Yes |
| HSA (Highest Single Agent) | 5.1 | Weak Effect | No |
Detailed Experimental Protocols
Protocol A: Traditional OVAT Checkerboard Assay
- Cell Seeding: Seed target cells in 96-well plates at density for 72-hour growth.
- Drug Preparation: Prepare 4 serial dilutions of Drug A and Drug B in separate tubes.
- Dosing: Add Drug A dilutions to rows. Subsequently add Drug B dilutions to columns, creating a 4x4 matrix. Include single-agent and control wells.
- Incubation: Incubate plates for 72 hours at 37°C, 5% CO₂.
- Viability Assay: Add CellTiter-Glo reagent, shake, and measure luminescence.
- Analysis: Normalize to controls. Calculate Combination Index (CI) for the single combination point near the IC₅₀ of each drug.
Protocol B: HTE Full-Factorial Synergy Screen
- Cell Seeding: Use an acoustic liquid handler (e.g., Echo 550) to seed cells directly into 384- or 1536-well assay plates in minimal volume.
- Drug Library & Transfer: Transfer nanoliter volumes of pre-plated compound stocks (Drug A library x Drug B library) from source plates to assay plates via acoustic dispensing, creating an 8x8 or 10x10 full dose-response matrix for each pair.
- Incubation: Incubate plates for 72-120 hours in controlled environmental chambers.
- High-Content Readout: Use a multimode plate reader for simultaneous luminescent viability (CellTiter-Glo 3D) and apoptotic marker (Caspase-Glo) detection.
- Data Processing: Automate curve fitting and response surface modeling using software like Combenefit or SynergyFinder.
- Synergy Calculation: Apply multiple models (ZIP, Loewe, Bliss, HSA) across the entire dose landscape to generate a consensus synergy score and 3D surface plots.
Pathway Diagram for a Synergy Mechanism Uncovered by HTE
Diagram 2: Convergent pathway synergy mechanism (64 chars)
The Scientist's Toolkit: Key Research Reagent Solutions
Table 3: Essential Materials for Advanced Interactivity Detection Studies
| Item Name | Provider (Example) | Critical Function in HTE Synergy Screening |
|---|---|---|
| Acoustic Liquid Handler (Echo) | Beckman Coulter | Enables precise, non-contact transfer of nL volumes for dense dose-response matrices. |
| 3D Viability Assay Reagent | Promega (CellTiter-Glo 3D) | Measures viability in both 2D and 3D culture models with enhanced lytic capacity. |
| Synergy Analysis Software | SynergyFinder | Web-based tool for calculating and visualizing multiple synergy models from matrix data. |
| Combinatorial Compound Library | Selleckchem (FDA-approved library) | Pre-formatted libraries for rapid combination screening. |
| 384-Well Low-Volume Assay Plates | Corning (Cat. 4514) | Optimized plate geometry for miniaturized, high-density screening assays. |
| Automated Plate Handler | HighRes Biosolutions | Integrates with incubators and readers for fully unattended screening workflows. |
Within the thesis of HTE vs. OVAT comparison, the data and protocols presented demonstrate that HTE methods are fundamentally required for reliable interactivity detection. OVAT approaches, due to their sparse sampling of the combinatorial space, consistently miss synergistic interactions—a critical flaw in drug combination development. HTE's strength lies in its ability to generate rich, multi-dimensional datasets that allow for the application of robust synergy models, directly uncovering mechanistic insights into convergent pathway inhibition, as visualized, that are otherwise invisible.
Within the context of a formal research thesis comparing High-Throughput Experimentation (HTE) and One-Variable-At-a-Time (OVAT) methodologies, this guide provides a structured decision matrix for project planning. The core thesis investigates the efficiency, resource allocation, and discovery potential of HTE versus traditional OVAT in scientific research and drug development. This article serves as a practical application framework derived from that thesis.
Methodology Comparison & Core Principles
One-Variable-At-a-Time (OVAT): The classical scientific method where a single experimental parameter is altered between experiments while all others are held constant. This establishes clear, causal relationships but can be inefficient for exploring complex, multi-factorial spaces.
High-Throughput Experimentation (HTE): Employs automation, miniaturization, and parallel processing to rapidly conduct hundreds to thousands of experiments simultaneously, systematically varying multiple parameters. It excels at mapping complex landscapes and discovering interactions.
Hybrid Approach: A strategic combination where HTE is used for broad screening and identifying critical variables or promising regions of parameter space, followed by targeted OVAT studies for validation, optimization, and mechanistic understanding.
Table 1: Comparative Performance Metrics for Reaction Optimization (Representative Data)
| Metric | OVAT Approach | HTE Approach | Hybrid (HTE → OVAT) | Notes / Experimental Source |
|---|---|---|---|---|
| Time to Initial Optima | 42 days | 5 days | 7 days | Suzuki-Miyaura coupling optimization; 96-well plate HTE vs. sequential round-bottom flasks. |
| Total Experiments Required | 56 | 288 | 312 (288 HTE + 24 OVAT) | For exploring 4 parameters at 3-4 levels each. HTE explores full factorial space. |
| Material Consumption | 840 mg substrate | 42 mg substrate | 126 mg substrate | Based on 1 mmol scale for OVAT vs. 0.05 mmol scale for HTE. |
| Identification of Interactions | None | 2 significant interactions | 2 interactions confirmed | HTE design (e.g., factorial) directly detects parameter interactions (e.g., Ligand*Base). |
| Probability of Finding Global Optima | Low | High | Very High | OVAT can converge on local optima; HTE surveys broader space. |
Table 2: Decision Matrix for Method Selection
| Project Characteristic | Favors OVAT | Favors HTE | Favors Hybrid |
|---|---|---|---|
| Parameter Space | Limited (1-2 key vars) | Large (3+ parameters) | Large, but requires deep validation |
| Resource Availability | Low automation budget, high material mass | High automation access, limited precious materials | Moderate resources, balanced needs |
| Primary Goal | Mechanistic proof, subtle phenotype study | Discovery, screening, mapping landscapes | Optimizing a lead with understanding |
| Knowledge Base | Well-understood system | Novel or poorly understood system | Partial understanding, key unknowns remain |
| Risk Tolerance | Low risk, incremental steps | High risk for high reward | Balanced risk and validation |
Experimental Protocols from Cited Studies
Protocol A: HTE for Cross-Coupling Reaction Optimization
- Library Design: Prepare stock solutions of catalyst, ligand, base, and substrate in inert atmosphere. Use a design-of-experiments (DoE) software to define a 96-condition matrix varying 4 parameters.
- Liquid Handling: Use an automated liquid handler to dispense µL volumes of each component into a 96-well reaction block. Each well represents a unique combination of parameters.
- Reaction Execution: Seal the block and heat/stir simultaneously in a dedicated HTE reaction station.
- Quenching & Analysis: After reaction time, automatically quench each well. Analyze yield/conversion via parallel UPLC-MS with an autosampler.
- Data Analysis: Use analysis software to visualize results (e.g., heat maps, Pareto charts) to identify top performers and parameter interactions.
Protocol B: OVAT Validation of HTE Lead
- Parameter Isolation: From the HTE result, select the top-performing ligand and base.
- Sequential Variation: Set up a series of 8 reactions in individual vials. Hold ligand, base, and substrate constant. Vary only catalyst loading across a defined range (e.g., 0.5-5.0 mol%).
- Individual Monitoring: Run each reaction separately, using traditional lab techniques (TLC, NMR sampling) to monitor kinetics.
- Precise Control & Characterization: Isolate and fully characterize (NMR, HPLC purity) the product from the optimal condition to confirm quality.
Visualizations
Title: Decision Workflow for Choosing HTE, OVAT, or Hybrid
Title: OVAT vs. HTE Parameter Exploration Map
The Scientist's Toolkit: Key Research Reagent Solutions
Table 3: Essential Materials for HTE/OVAT Comparative Studies
| Item | Function in Experiment | Example / Note |
|---|---|---|
| Automated Liquid Handler | Precise, reproducible dispensing of µL volumes for HTE library generation. | Hamilton MICROLAB STAR, Eppendorf EpMotion. Critical for HTE. |
| High-Throughput Reaction Block | Allows parallel synthesis under controlled atmosphere/temperature. | 96-well glass or polymer blocks from Unchained Labs, Asynt. |
| Parallel UPLC-MS System | Rapid, automated analysis of dozens to hundreds of reaction outcomes. | Waters ACQUITY UPLC with QDa, Agilent InfinityLab. |
| Design of Experiments (DoE) Software | Statistically designs efficient experiment arrays to maximize information gain. | JMP, Modde, or open-source R packages (DoE.base). |
| Chemical Libraries (Ligands, Catalysts) | Pre-formulated, standardized stock solutions for rapid screening. | Commercially available kits from Sigma-Aldrich (Aldrich-Meerwein), Ambeed. |
| Microscale NMR Tubes | Enables direct NMR yield analysis from small-volume HTE reactions. | 1.7mm or 3mm NMR tubes, suitable for cryoprobes. |
| Statistical Analysis Software | Processes multivariate data, identifies significant effects and interactions. | JMP, Spotfire, MiniTab, or Python (Pandas, SciKit-Learn). |
Conclusion
The choice between HTE and OVAT is not a binary contest but a strategic decision based on project stage, goals, and resources. OVAT remains a powerful, accessible tool for fundamental investigations and finely-controlled studies, while HTE is indispensable for rapidly mapping complex parameter spaces and accelerating early-phase discovery. The most effective modern R&D pipelines intelligently integrate both philosophies, using HTE for broad exploration and OVAT for deep, mechanistic validation. Future directions point toward increasingly intelligent, AI-driven experimental design that dynamically guides the interplay between high-throughput screening and targeted experimentation, promising unprecedented efficiency in biomedical research and therapeutic development.