Robustness Testing in Organic Analytical Procedures: A Complete Guide to QbD, Method Validation, and Regulatory Compliance
This article provides a comprehensive guide to robustness testing for researchers, scientists, and drug development professionals working with organic analytical procedures.
Robustness Testing in Organic Analytical Procedures: A Complete Guide to QbD, Method Validation, and Regulatory Compliance
Abstract
This article provides a comprehensive guide to robustness testing for researchers, scientists, and drug development professionals working with organic analytical procedures. Covering the entire method lifecycle, it explains foundational principles based on ICH guidelines, demonstrates practical methodological approaches using experimental design, offers troubleshooting strategies for common issues, and clarifies validation requirements for regulatory compliance. By adopting the Quality by Design (QbD) framework outlined here, professionals can develop more reliable analytical methods, reduce out-of-specification results, and ensure successful method transfer and regulatory submissions.
Understanding Robustness Testing: Definitions, Importance, and Regulatory Foundations
What is Robustness Testing? ICH Q2(R2) and USP Definitions
Robustness testing is a critical component of analytical procedure validation, serving as a measure of a method's capacity to remain unaffected by small, deliberate variations in method parameters. Robustness provides an indication of the procedure's reliability and suitability during normal usage conditions by demonstrating that method performance remains consistent despite expected fluctuations in analytical conditions [1]. Within the pharmaceutical industry, robustness is formally defined by both the International Council for Harmonisation (ICH) and the United States Pharmacopeia (USP) as a measure of an analytical procedure's ability to resist changes when subjected to minor modifications in procedural parameters specified in the method documentation [1] [2].
While often confused with related terms, robustness maintains distinct characteristics. Ruggedness, as defined by USP, refers to the degree of reproducibility of test results under a variety of normal conditions such as different laboratories, analysts, instruments, and reagent lots. The ICH guideline does not use the term "ruggedness" but addresses similar concepts under "intermediate precision" (within-laboratory variations) and "reproducibility" (between-laboratory variations) [1]. A practical rule of thumb distinguishes these concepts: if a parameter is written into the method (e.g., 30°C, 1.0 mL/min), it constitutes a robustness issue. If it is not specified in the method (e.g., which analyst runs the method or which specific instrument is used), it falls under ruggedness or intermediate precision [1].
Regulatory Framework: ICH Q2(R2) and USP
ICH Q2(R2) Perspective
The ICH Q2(R2) guideline, titled "Validation of Analytical Procedures: Text and Methodology," establishes robustness as a fundamental validation element. According to the most recent ICH Q2(R2) implementation, robustness is "tested by deliberate variations of analytical procedure parameters" [2]. This guideline emphasizes that analytical procedure validation serves as proof that a method is fit for its intended purpose throughout the procedure's entire lifecycle, not merely as a one-time activity [2]. The scope of ICH Q2(R2) applies to procedures for release and stability testing of drug substances and products, though it can also extend to other control strategy tests when justified by risk assessment [2].
USP Chapter 1225 Perspective
USP Chapter 1225, "Validation of Compendial Methods," similarly defines robustness as a measure of the analytical procedure's capacity to remain unaffected by small, deliberate variations in method parameters [1]. Recent revisions to USP Chapter 1225 have aimed to harmonize more closely with ICH guidelines, including replacing references to "ruggedness" with "intermediate precision" [1]. Interestingly, while robustness appears in both ICH and USP guidelines, it has not traditionally been included in the list of suggested analytical characteristics used to validate a method, though this is changing in recent proposed revisions to USP Chapter 1225 [1].
Table 1: Comparison of Regulatory Definitions
| Aspect | ICH Q2(R2) | USP Chapter 1225 |
|---|---|---|
| Terminology | Prefers "Intermediate Precision" | Traditionally used "Ruggedness" but moving toward ICH terminology |
| Definition | Measure of capacity to remain unaffected by small, deliberate variations | Measure of capacity to remain unaffected by small, deliberate variations |
| Regulatory Status | Required validation element | Required validation element |
| Lifecycle Approach | Explicitly states validation continues throughout procedure lifecycle | Implied through ongoing suitability requirements |
| Focus | Reliability during normal use | Reliability during normal use |
Experimental Design for Robustness Studies
Key Parameters for Testing
Robustness testing involves the intentional variation of method parameters to assess their impact on method performance. The specific parameters selected for variation depend on the analytical technique, but common examples in chromatography include [1]:
- Mobile phase composition (number, type, and proportion of organic solvents)
- Buffer composition and concentration
- pH of the mobile phase
- Different column lots or suppliers
- Temperature (column, sample)
- Flow rate
- Detection wavelength
- Gradient variations (hold times, slope, length)
For dissolution testing, key parameters might include [3]:
- Media composition (buffer concentration, pH, surfactant percentage)
- Dissolution apparatus (brand, model, age)
- Paddle/basket height (typically varied by ±2mm)
- RPM speed
- Degassing method and dissolved gas levels
- Sinker design and construction
Experimental Design Approaches
Robustness studies have traditionally employed univariate approaches (changing one variable at a time), but modern practice favors multivariate experimental designs that allow multiple variables to be studied simultaneously. This approach is more efficient and enables detection of interactions between variables [1]. The most common experimental designs for robustness studies include:
Full Factorial Designs
In a full factorial design, all possible combinations of factors are measured at high and low values. If there are k factors, each at two levels, a full factorial design has 2^k runs. For example, with four factors, there would be 16 design points [1]. While comprehensive, full factorial designs become impractical with more than five factors due to the exponentially increasing number of runs [1].
Fractional Factorial Designs
Fractional factorial designs use a carefully chosen subset of the factor combinations from a full factorial design, significantly reducing the number of runs required. These designs work on the "scarcity of effects principle" - while many factors may exist, typically only a few are truly important [1]. The reduced number of runs comes with the tradeoff of some factors being "aliased" or confounded with other factors, requiring careful design selection [1].
Plackett-Burman Designs
Plackett-Burman designs are highly efficient screening designs particularly suited for robustness testing where the primary goal is determining whether a method is robust to many changes rather than quantifying each individual effect [1]. These economical designs work in multiples of four rather than powers of two and are ideal when only main effects are of interest [1].
Table 2: Comparison of Experimental Design Approaches
| Design Type | Number of Runs | Advantages | Limitations | Best Applications |
|---|---|---|---|---|
| Full Factorial | 2^k (where k = factors) | Identifies all interactions; no confounding | Number of runs grows exponentially | Small number of factors (<5) |
| Fractional Factorial | 2^(k-p) (where p = fraction) | Balanced; efficient for multiple factors | Some confounding of interactions | Medium number of factors (5-10) |
| Plackett-Burman | Multiples of 4 | Highly efficient for many factors | Only evaluates main effects | Screening many factors (>10) |
Implementation Protocols and Methodologies
Systematic Approach to Robustness Testing
Implementing a successful robustness study requires a structured approach:
Parameter Selection: Identify which method parameters to test based on risk assessment and knowledge gained during method development. Focus on parameters most likely to vary during routine use or those identified as potentially impactful during development [1] [3].
Range Definition: Establish appropriate high and low values for each parameter based on expected variations in normal laboratory conditions. These ranges should represent "reasonable but deliberate" variations that might occur during method transfer or routine application [1].
Experimental Design: Select the most appropriate experimental design based on the number of parameters, available resources, and required information about interactions [1].
Execution and Data Collection: Conduct the experiments according to the design, ensuring proper documentation of all conditions and results.
Data Analysis: Evaluate the effects of parameter variations on critical method performance characteristics, typically focusing on resolution, tailing factor, capacity factor, and precision [1].
Establishment of System Suitability: Use results from robustness testing to establish appropriate system suitability parameters that will ensure method validity during routine use [1].
Analytical Procedure
A typical robustness study for a chromatographic method follows this workflow:
Acceptance Criteria
While specific acceptance criteria depend on the analytical method and its intended purpose, generally, a method is considered robust when all measured responses remain within specified acceptance criteria despite the introduced variations. For chromatographic methods, this typically means maintaining [1] [2]:
- Resolution between critical pairs above specified minimum
- Tailing factor within acceptable limits
- Theoretical plates meeting minimum requirements
- Precision (RSD) within acceptable ranges
- Accuracy remaining within specified limits
For dissolution testing, acceptance criteria typically focus on maintaining dissolution results within acceptable ranges at specified timepoints, particularly at the Q value timepoint and last timepoint [3].
The Scientist's Toolkit: Essential Research Reagent Solutions
Implementing effective robustness studies requires specific materials and tools designed for pharmaceutical analysis. The following table details key research reagent solutions and their functions in robustness testing:
Table 3: Essential Research Reagent Solutions for Robustness Testing
| Reagent/Material | Function in Robustness Testing | Application Examples |
|---|---|---|
| Reference Standards | Quantification and system suitability verification | USP reference standards; impurity standards |
| Chromatographic Columns | Different lots/sources to test column robustness | C18, C8, phenyl, and other stationary phases |
| Buffer Components | Variation in mobile phase composition | Phosphate, acetate buffers at different pH and concentration |
| HPLC-Grade Solvents | Variation in organic modifier type and proportion | Methanol, acetonitrile of different lots and suppliers |
| Surfactants | Testing media robustness in dissolution | Sodium lauryl sulfate, polysorbates |
| Dissolution Media | Testing robustness to media variations | Different pH buffers, biorelevant media |
| Column Heater/Chiller | Controlling and varying temperature parameters | Testing temperature effects on separation |
Data Analysis and Interpretation
Statistical Evaluation
Robustness study data requires appropriate statistical analysis to distinguish significant effects from normal experimental variation. The experimental designs previously described facilitate this analysis through structured comparison of variations. For full and fractional factorial designs, statistical analysis typically includes [1] [4]:
- Analysis of Variance (ANOVA) to identify significant factors
- Main effects plots to visualize parameter effects
- Interaction plots to identify significant interactions between parameters
- Normal probability plots to distinguish significant effects from noise
The statistical evaluation should focus on both the magnitude of effects and their practical significance. While a parameter variation might produce a statistically significant effect, it may not be practically significant if the method performance remains within acceptance criteria [1].
Response Surface Methodology
For more complex robustness studies, response surface methodology may be employed to model the relationship between parameter variations and method responses. This approach is particularly valuable when curvature is suspected in the response and enables the identification of optimal parameter settings that maximize robustness [1] [4].
Case Studies and Practical Applications
Chromatographic Method Example
A robustness study for an HPLC assay method might investigate the effects of variations in mobile phase pH (±0.2 units), organic composition (±2%), column temperature (±3°C), and flow rate (±0.1 mL/min) using a fractional factorial design. The responses measured would typically include retention time, resolution between critical pairs, tailing factor, and theoretical plates. The results would establish acceptable ranges for each parameter to be included in the method documentation [1].
Dissolution Method Example
For dissolution testing, a robustness study might examine the effects of media pH (±0.2 units), surfactant concentration (±10%), deaeration level, and apparatus model (different vendors). The study would evaluate dissolution results at key timepoints, particularly the Q value timepoint, to establish the method's robustness to these variations [3].
Robustness testing represents a critical element of the analytical procedure validation lifecycle, providing assurance that methods will perform reliably under the normal variations encountered during routine use in pharmaceutical quality control laboratories. The ICH Q2(R2) and USP guidelines provide aligned definitions and expectations for robustness testing, emphasizing its role in demonstrating method reliability.
Through appropriate experimental design—including full factorial, fractional factorial, or Plackett-Burman designs—and careful data analysis, robustness testing identifies critical method parameters and establishes acceptable operating ranges. This not only ensures method reliability but also informs system suitability criteria and method documentation, ultimately supporting robust pharmaceutical manufacturing and control strategies.
As regulatory guidance continues to evolve, with ICH Q2(R2) emphasizing a lifecycle approach to method validation, robustness testing remains fundamental to demonstrating that analytical procedures are fit for their intended purpose throughout their operational lifetime.
In analytical chemistry, the reliability of a method is paramount, especially in regulated industries like pharmaceuticals. While the terms "robustness" and "ruggedness" are sometimes used interchangeably, they represent two distinct pillars of method validation. Robustness is the measure of a method's capacity to remain unaffected by small, deliberate variations in its internal procedural parameters. In contrast, ruggedness evaluates the reproducibility of test results under varying external conditions, such as different analysts, instruments, or laboratories [1] [5]. Understanding this distinction is critical for developing, validating, and successfully transferring analytical methods, ensuring data integrity and regulatory compliance throughout a drug's lifecycle.
Core Concepts: A Side-by-Side Comparison
The following table summarizes the fundamental differences between robustness and ruggedness, highlighting their unique focuses, objectives, and applications.
| Feature | Robustness Testing | Ruggedness Testing |
|---|---|---|
| Core Definition | Measures stability against small, deliberate variations in method parameters [1] [6]. | Measures reproducibility of results under varying external conditions [7] [5]. |
| Nature of Variations | Internal, controlled, and deliberate changes to parameters written into the method [1] [5]. | External, environmental factors that are expected to occur in normal use [6] [8]. |
| Primary Objective | Identify critical method parameters and establish controllable ranges [1] [9]. | Ensure method reproducibility and facilitate successful method transfer [7] [5]. |
| Typical Scope | Intra-laboratory study, performed during method development [1] [5]. | Often an inter-laboratory study, performed later in validation or during transfer [5]. |
| Key Question | "How well does the method withstand minor tweaks to its defined parameters?" [5] | "How well does the method perform across different settings, analysts, and instruments?" [5] |
| Example Variables | Mobile phase pH, flow rate, column temperature, wavelength [1] [6]. | Different analysts, instruments, laboratories, reagent lots, and days [1] [5]. |
Experimental Protocols for Robustness Testing
A key outcome of robustness testing is the definition of a Method Operable Design Region (MODR), a multidimensional space where the method delivers consistent, reliable performance despite minor parameter fluctuations [9]. Scientifically rigorous experimental design is crucial for an efficient and informative robustness study.
Experimental Designs and Workflows
The univariate, or one-factor-at-a-time (OFAT) approach, is time-consuming and fails to detect interactions between variables [1]. Multivariate screening designs are more efficient, allowing for the simultaneous study of multiple variables.
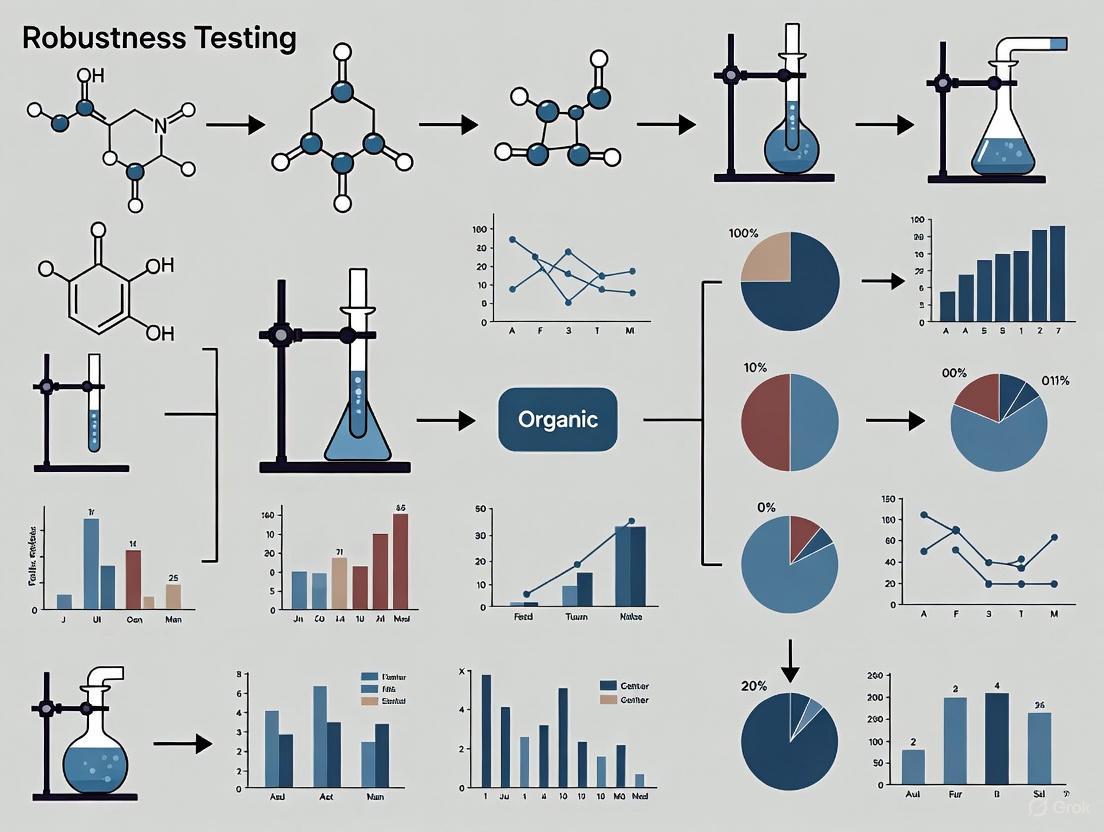
Figure: Robustness testing workflow from planning to establishing a validated method, showing design selection based on factor number.
- Full Factorial Designs: A full factorial design investigates all possible combinations of factors at their high and low levels. For k factors, this requires 2^k runs. This design is powerful but becomes impractical with more than four or five factors due to the exponentially increasing number of experiments [1].
- Fractional Factorial Designs: These designs are a carefully chosen subset (a fraction) of the full factorial runs. They are highly efficient for screening a larger number of factors (e.g., five or more) and are based on the principle that higher-order interactions are often negligible. The trade-off is that some effects may be confounded, requiring careful design selection [1].
- Plackett-Burman Designs: This type of design is an extremely efficient screening tool used to identify the most critical factors from a large set (e.g., 11 factors in 12 experimental runs). It is primarily used to estimate main effects economically and is ideal for situations where many factors need to be investigated with minimal experimental effort [1].
The Scientist's Toolkit: Key Reagents and Materials
The following table lists essential materials and their functions in a robustness study for a chromatographic method.
| Item | Function in Robustness Testing |
|---|---|
| HPLC/UHPLC System | Instrument platform for executing separations; performance is validated through system suitability tests. |
| Chromatographic Column | Stationary phase; testing different column lots and/or suppliers is a critical robustness variable [1] [6]. |
| Organic Solvents & Buffers | Components of the mobile phase; variations in their composition, pH, and concentration are tested [1] [5]. |
| Analytical Reference Standards | High-purity compounds used to prepare samples with known concentrations for evaluating method performance. |
| System Suitability Test (SST) Solutions | Reference mixtures used to verify that the chromatographic system is performing adequately before analysis. |
Experimental Protocols for Ruggedness Testing
Ruggedness testing, sometimes assessed under the umbrella of intermediate precision (within-laboratory variations) and reproducibility (between-laboratory variations), simulates the real-world variability a method will encounter [1]. The Youden test is a recognized, efficient method for ruggedness evaluation [10].
The Youden Test and Collaborative Studies
- The Youden Test: This method uses fractional factorial designs to assess the impact of multiple external factors with a minimal number of experiments. It is a highly efficient approach that conserves time and resources while providing essential data on the method's susceptibility to variations between analysts, instruments, or laboratories [10].
- Collaborative Study Design: A full ruggedness study may involve a formal inter-laboratory collaborative trial. In this design, identical samples and the fully documented method procedure are distributed to multiple participating laboratories. Each laboratory performs the analysis, and the results are compiled and statistically evaluated to determine the method's reproducibility across different environments [5].
Figure: Ruggedness testing workflow from sample preparation through multi-laboratory analysis to establish reproducibility criteria.
Implementation in Pharmaceutical Development
The principles of robustness and ruggedness are integral to modern pharmaceutical quality systems. A proactive approach to robustness, guided by Analytical Quality by Design (AQbD) principles, is increasingly adopted to build reliability directly into the method from the start [9].
- A Proactive "Robustness-First" Mindset: Instead of treating robustness as a final validation check, AQbD encourages its investigation during the method development phase. This involves using systematic, multivariate experiments to understand the relationship between method parameters and performance outcomes, thereby defining a robust MODR early on [1] [9].
- Regulatory and Business Impact: A method validated with a thorough understanding of its robustness and ruggedness is more likely to avoid costly out-of-specification (OOS) results during routine use. This enhances regulatory compliance, smoothens method transfer between sites, and reduces the need for post-approval changes, leading to significant long-term cost and time savings [5] [9].
For researchers and drug development professionals, a clear and applied understanding of the distinction between robustness and ruggedness is non-negotiable. Robustness is an internal stress-test of the method's parameters, defining its operational boundaries and ensuring stability against minor fluctuations. Ruggedness is the ultimate test of a method's real-world applicability, proving its reproducibility across the different analysts, instruments, and environments inherent in a global industry. By systematically implementing rigorous experimental protocols for both, scientists can ensure the generation of reliable, high-quality data that safeguards product quality and patient safety from development through commercial manufacturing.
In the highly regulated pharmaceutical industry, the robustness of an analytical method is a critical parameter defined as a measure of its capacity to remain unaffected by small, deliberate variations in method parameters and provide unbiased results under normal usage conditions [11] [1]. This concept extends beyond simple error-checking to become a fundamental safeguard for data integrity, product quality, and patient safety throughout the drug development lifecycle. As regulatory guidance emphasizes through frameworks like ICH Q2(R2) and Q14, understanding robustness is not merely a compliance exercise but a scientific necessity for establishing reliable, trustworthy analytical procedures [1] [9].
The distinction between robustness and related validation parameters is crucial. While ruggedness (increasingly termed intermediate precision) refers to a method's reproducibility under varying external conditions such as different laboratories, analysts, or instruments, robustness specifically tests the method's resilience to intentional, internal parameter modifications [1]. Essentially, if a parameter is written into the method protocol (e.g., pH, temperature, flow rate), testing its impact falls under robustness evaluation. This systematic assessment of a method's "edge of failure" provides scientists and regulators with confidence that the procedure will perform consistently, even when minor, inevitable operational variations occur in different laboratory environments [9].
The Critical Role of Robustness in Pharmaceutical Quality Systems
Foundation of Data Integrity and Product Quality
Robust analytical methods form the bedrock of data integrity—ensuring data remain accurate, consistent, and reliable throughout their lifecycle [12]. In pharmaceutical development, decisions regarding drug safety, efficacy, and quality are entirely dependent on analytical data. A method lacking robustness may produce biased or unreliable results when subjected to normal laboratory variations, leading to costly out-of-specification investigations, batch rejections, or worse, compromised patient safety [9].
The relationship between robustness and quality is direct and consequential. Robust methods demonstrate consistent performance, which translates to reliable potency assays, accurate impurity profiling, and trustworthy stability data. This reliability is paramount for making critical decisions during formulation development, establishing shelf life, and ensuring consistent product quality throughout commercial manufacturing. Furthermore, the implementation of a robustness study aligns with the Quality by Design (QbD) framework endorsed by FDA and ICH guidelines, shifting the quality paradigm from traditional quality-by-testing to a more systematic, science-based approach [9].
Economic and Regulatory Implications
Investing in robustness testing during method development provides significant economic returns by reducing failures during method transfer and routine use. The cost of remediating a non-robust method post-implementation far exceeds the investment in proper upfront evaluation [1]. As one white paper notes, inconsistent method performance can lead to "failure of the System Suitability Testing (SST) requiring redevelopment and regulatory approval, impacting cost and time" [9].
From a regulatory perspective, demonstrating method robustness provides confidence in the reliability of submitted data and supports regulatory flexibility. When a Method Operable Design Region (MODR) is established, changes within this proven robustness space may not require regulatory submissions, streamlining post-approval improvements [9].
Experimental Design for Robustness Evaluation
Key Method Parameters for Testing
Robustness testing in chromatographic methods involves deliberately varying critical method parameters to assess their impact on performance indicators such as resolution, tailing factor, and precision. Based on regulatory guidance and industry practice, the following parameters are typically evaluated:
- Mobile Phase Composition: Number, type, and proportion of organic solvents [1]
- pH of the mobile phase: Variations within a specified range [1]
- Buffer Concentration: Changes in molarity [1]
- Column Temperature: Fluctuations around the set point [1]
- Flow Rate: Deviations from the nominal value [1]
- Detection Wavelength: Minor adjustments [1]
- Different Column Lots: To assess column-to-column variability [1]
- Gradient Variations: Changes in gradient time, slope, or hold times [1]
Statistical Design of Experiments (DoE) Approaches
Traditional one-factor-at-a-time (OFAT) approaches to robustness testing are increasingly replaced by multivariate statistical designs that provide greater efficiency and enable detection of parameter interactions [1] [4]. The most common screening designs include:
- Full Factorial Designs: All possible combinations of factors at two levels (high and low) are measured. While comprehensive (2^k runs for k factors), they become impractical for more than five factors due to the high number of required runs [1].
- Fractional Factorial Designs: A carefully chosen subset of the full factorial combinations, these designs significantly reduce the number of runs while still providing valuable information about main effects, though some effects may be confounded (aliased) [1].
- Plackett-Burman Designs: Highly efficient screening designs in multiples of four runs that are ideal for evaluating a large number of factors when only main effects are of interest. These have been widely employed in robustness studies for their operational convenience [11] [1].
The following diagram illustrates the experimental workflow for a systematic robustness evaluation using DoE:
Comparative Analysis: Robust vs. Non-Robust Methods
Performance Under Variable Conditions
The fundamental value of robustness testing becomes evident when comparing method performance under stressed conditions. The following table summarizes key performance differences:
Table 1: Performance Comparison of Robust vs. Non-Robust Analytical Methods
| Performance Characteristic | Robust Method | Non-Robust Method |
|---|---|---|
| Result Reproducibility | Consistent across permitted parameter variations | Significant deviation with minor parameter changes |
| System Suitability Test (SST) Failure Rate | Low and predictable | High and unpredictable |
| Method Transfer Success | High success rate between laboratories | Frequent failures requiring investigation |
| Operational Flexibility | Tolerates normal equipment and preparation variations | Requires extremely tight control of all parameters |
| Data Integrity Assurance | Maintains accuracy and consistency under normal variations | Produces biased or unreliable results with minor changes |
| Regulatory Compliance | Easily validated and transferred | Requires multiple investigations and re-validation |
Case Study: HPLC Method Development
A practical application of robustness evaluation comes from a pharmaceutical development case study employing Analytical Quality by Design (AQbD) principles [9]. Scientists developed an HPLC method for analyzing active pharmaceutical ingredients (APIs) and their related substances. Through a systematic robustness study using a fractional factorial design, they evaluated the impact of seven critical parameters: mobile phase pH, buffer concentration, column temperature, flow rate, gradient time, and detection wavelength.
The results demonstrated that only two parameters (mobile phase pH and gradient time) had statistically significant effects on critical resolution. This finding allowed the team to establish a Method Operable Design Region (MODR) where these two parameters were tightly controlled while other parameters could vary within broader ranges without affecting method performance. This approach enhanced method understanding, reduced the risk of out-of-specification results during routine use, and provided regulatory flexibility for future adjustments within the MODR [9].
Table 2: Key Research Reagent Solutions for Robustness Evaluation
| Resource Category | Specific Examples | Function in Robustness Testing |
|---|---|---|
| Chromatography Reference Standards | USP, EP, BP reference standards; Certified reference materials from LGC, Merck | Provide benchmark for method performance under varied conditions [13] |
| High-Purity Mobile Phase Components | HPLC-grade solvents; LC-MS grade solvents; High-purity buffers and additives | Minimize variability introduced by impurity differences between reagent lots [13] |
| Characterized Column Variants | Different column lots; Columns from multiple manufacturers; Different column ages | Assess method resilience to normal column-to-column variability [1] |
| Quality Control Samples | In-house prepared reference standards; Spiked samples with known concentrations | Monitor method performance across experimental conditions [13] |
| Statistical Software Packages | Design of Experiments (DoE) software; Multivariate analysis tools | Enable experimental design and data analysis for robustness studies [1] [4] |
Robustness is not an isolated validation parameter but a fundamental characteristic that must be integrated throughout the entire analytical method lifecycle. From initial development through transfer and routine use, understanding a method's limitations and behavior under variable conditions provides the scientific foundation for reliable data generation [9]. The implementation of systematic robustness testing using appropriate experimental designs represents a critical investment in product quality, regulatory compliance, and ultimately, patient safety.
As the pharmaceutical industry continues to embrace QbD principles, the evaluation of robustness will increasingly become an integral part of method development rather than a standalone validation activity. This paradigm shift toward proactive understanding rather than retrospective verification represents the most significant advancement in ensuring data integrity and product quality for modern pharmaceutical development.
The International Council for Harmonisation (ICH) and the U.S. Food and Drug Administration (FDA) provide the foundational framework for pharmaceutical regulation, particularly for analytical procedures. The ICH develops harmonized technical guidelines adopted by regulatory authorities worldwide to ensure global consistency in drug development and manufacturing [14]. Its "Q" series guidelines are especially influential for quality matters. The FDA, as a key founding regulatory member of ICH, subsequently adopts and implements these harmonized guidelines, making compliance with ICH standards a direct path to meeting FDA requirements for regulatory submissions [14].
For analytical method validation, the recent simultaneous release of ICH Q2(R2) on validation and ICH Q14 on analytical procedure development represents a significant modernization of the regulatory landscape [14]. This evolution shifts the focus from a prescriptive, "check-the-box" approach to a more scientific, lifecycle-based model that emphasizes a risk-based approach and built-in quality from the initial development stages [14]. Understanding this interconnected framework is essential for researchers, scientists, and drug development professionals aiming to ensure compliance and robust analytical performance.
Comparative Analysis of ICH and FDA Requirements
Core Principles and Harmonization
While the ICH and FDA maintain distinct regulatory roles, their requirements for analytical procedures are fundamentally aligned. The ICH provides the internationally harmonized scientific and technical standards, which the FDA then adopts and implements within the U.S. regulatory framework [14]. Recent updates further demonstrate this synchronization, with the FDA publishing final versions of ICH Q2(R2) in March 2024 and ICH Q14, which replaces the previous Q2(R1) guideline [15] [14].
This harmonization means that for most new drug submissions, following the latest ICH guidelines is the key to meeting FDA requirements [14]. The core principles for analytical method validation remain consistent between both bodies, focusing on scientifically sound, fit-for-purpose methods that reliably measure drug quality attributes throughout the product lifecycle.
Key Validation Parameters Under ICH Q2(R2)
ICH Q2(R2) outlines fundamental performance characteristics that must be evaluated to demonstrate a method is fit for its intended purpose [16]. The following table summarizes these core validation parameters and their definitions:
Table: Core Analytical Method Validation Parameters per ICH Q2(R2)
| Parameter | Definition | Typical Assessment Method |
|---|---|---|
| Accuracy | Closeness of test results to the true value [14]. | Analysis of a known standard or spiked placebo [14]. |
| Precision | Degree of agreement among individual test results from repeated samplings [14]. | Repeatability, intermediate precision, reproducibility [14]. |
| Specificity | Ability to assess the analyte unequivocally in the presence of potential interferents [14]. | Analysis of samples with and without impurities/degradants [14]. |
| Linearity | Ability to obtain results proportional to analyte concentration [14]. | Series of analyte solutions across a defined range [14]. |
| Range | Interval between upper and lower analyte concentrations with suitable precision, accuracy, and linearity [14]. | Derived from linearity and precision data [14]. |
| Limit of Detection (LOD) | Lowest amount of analyte that can be detected [14]. | Signal-to-noise ratio or visual evaluation [14]. |
| Limit of Quantitation (LOQ) | Lowest amount of analyte that can be quantified with acceptable accuracy and precision [14]. | Signal-to-noise ratio or specified accuracy/precision criteria [14]. |
| Robustness | Capacity to remain unaffected by small, deliberate variations in method parameters [14]. | Experimental design (e.g., Plackett-Burman) varying parameters [17]. |
Robustness Testing: Concepts and Regulatory Significance
Definition and Importance in Method Validation
Robustness is formally defined as "the capacity of an analytical procedure to remain unaffected by small but deliberate variations in method parameters and provides an indication of its reliability during normal usage" [17]. This measures a method's resilience to minor changes in experimental conditions that might occur during routine analysis, such as slight fluctuations in temperature, pH, mobile phase composition, or flow rate [11]. A robust method will produce unbiased and consistent results despite these normal variations, which is critical for ensuring data reliability and product quality throughout a method's lifecycle [11].
The importance of robustness testing extends throughout the pharmaceutical industry. For a company testing drug purity, a non-robust method could mean that minor, inevitable changes in the lab environment lead to inconsistent results, potentially delaying product release or compromising patient safety [18]. Robustness testing is therefore not merely a regulatory requirement but a fundamental exercise in ensuring the dependability and trustworthiness of analytical data used for critical decision-making [18].
Robustness vs. Ruggedness
A common point of discussion in analytical circles is the distinction between robustness and ruggedness. While sometimes used interchangeably, a more nuanced understanding exists. Ruggedness typically refers to a method's reliability when subjected to variations in external conditions, such as different laboratories, analysts, or instruments [17]. Robustness, in its more specific ICH definition, focuses on the impact of variations in internal method parameters themselves [17]. However, the consensus in the scientific literature, as concluded in multiple studies, is that these terms are often considered synonymous, with both aiming to demonstrate method reliability under realistic conditions of use [11].
Experimental Design for Robustness Evaluation
Systematic Methodology
Robustness testing requires a structured, systematic approach rather than random parameter adjustments. A well-designed robustness study involves several key steps [17]:
- Selection of Factors and Levels: Identify method parameters (e.g., mobile phase pH, column temperature, flow rate) and environmental conditions most likely to affect results. Choose two extreme levels for each factor, symmetrically around the nominal level, representing variations expected during method transfer or routine use [17].
- Selection of Experimental Design: Choose an appropriate experimental design that allows for efficient testing of multiple factors. Screening designs like fractional factorial (FF) or Plackett-Burman (PB) are commonly used [11] [17].
- Selection of Responses: Identify key assay responses (e.g., analyte recovery, impurity content) and System Suitability Test (SST) responses (e.g., resolution, retention time) to monitor [17].
- Execution and Data Analysis: Conduct experiments according to the defined protocol, then estimate factor effects and analyze them statistically or graphically to determine their significance [17].
Research Reagent Solutions and Materials
The following table details essential reagents, materials, and instruments critical for conducting a proper robustness study, particularly for chromatographic methods.
Table: Essential Research Reagent Solutions and Materials for Robustness Studies
| Item | Function in Robustness Testing | Example/Notes |
|---|---|---|
| HPLC/UPLC System | Separates and detects analytes; key source of parameter variations. | Parameters like flow rate, column temperature, and detector wavelength are tested [17]. |
| Analytical Columns | Stationary phase for separation; different batches/manufacturers are a key factor. | A common robustness factor is comparing the nominal column with an alternative column from a different batch or manufacturer [17]. |
| Mobile Phase Reagents | Liquid phase for separation; composition and pH are critical factors. | Variations in organic solvent percentage, buffer concentration, and pH are frequently tested [17] [18]. |
| Reference Standards | Provides known analyte for accuracy and system suitability assessment. | Used in sample solutions to measure responses like percent recovery and resolution under varied conditions [17]. |
| Sample Material | Represents the actual matrix containing the analyte. | A representative sample (e.g., drug formulation) is measured under all design experiments [17]. |
Statistical Analysis and Interpretation
After executing the experimental design, the effect of each factor on the response is calculated. The effect of a factor (EX) is the difference between the average responses when the factor was at its high level and the average when it was at its low level [17]. These effects are then analyzed to determine their statistical and practical significance.
Common graphical tools include normal probability plots or half-normal probability plots, where non-significant effects tend to fall along a straight line and significant effects deviate from it [17]. Statistically, effects can be compared to a critical effect value derived from the experimental error. For designs with dummy factors (unassigned factors in the matrix), the standard error of an effect can be estimated from the dummy effects, and a student's t-test can be performed [17]. If significant effects are found on critical assay responses, the method may require optimization, or the problematic parameter may need to be tightly controlled in the method instructions.
The Modernized Lifecycle Approach: ICH Q2(R2) and Q14
The recent updates to ICH Q2(R2) and the new ICH Q14 guideline represent a paradigm shift in analytical procedure validation and development. The most significant change is the move from validation as a one-time event to a continuous lifecycle management approach [14]. This enhanced model promotes building quality into the method from the very beginning rather than simply testing for it at the end.
A cornerstone of this modern approach is the Analytical Target Profile (ATP), introduced in ICH Q14 [14]. The ATP is a prospective summary of the method's intended purpose and its required performance criteria. By defining the ATP at the outset, development efforts are focused on creating a method that is fit-for-purpose by design. This scientific, risk-based foundation also facilitates more flexible and efficient post-approval change management. Furthermore, ICH Q2(R2) has been expanded to explicitly include guidance for modern techniques like multivariate methods, ensuring the guidelines remain relevant amidst rapid technological advancement [14].
The regulatory landscape for analytical procedures, governed by the harmonized efforts of ICH and the FDA, is evolving toward a more scientific, flexible, and robust framework. The core principles of validation, with robustness testing as a critical component, remain essential for demonstrating method reliability. The introduction of the modernized, lifecycle approach through ICH Q2(R2) and Q14, emphasizing the ATP and risk-based development, empowers scientists to build quality in from the start. For researchers and drug development professionals, successfully navigating this landscape requires a deep understanding of both the regulatory expectations and the systematic, statistically sound experimental methodologies needed to prove that an analytical procedure is truly fit for its intended purpose throughout its entire lifecycle.
The Critical Role in Pharmaceutical Analysis and Method Transfer
Analytical method transfer (AMT) is a documented process that verifies a validated analytical procedure performs consistently and reliably when moved from one laboratory to another [19]. This formal transfer is a critical pharmaceutical requirement whenever a quality control method is relocated between sites, such as from a development lab to a quality control lab, or to a contract research organization [19] [20].
The process qualifies a receiving laboratory (RL) to use a procedure developed and validated by a transferring laboratory (TL) [20]. Its core purpose is to demonstrate that the method produces equivalent results despite differences in analysts, equipment, reagents, and environmental conditions, thereby ensuring the continued reliability of data used to make decisions about drug safety and quality [19] [21]. Regulatory agencies like the FDA, EMA, and WHO require evidence of this reliability, making AMT a cornerstone of regulatory compliance and a robust pharmaceutical quality system [19].
Core Approaches to Method Transfer
Several standardized approaches exist for transferring methods, each with specific applications. The choice depends on factors like method complexity, the receiving lab's experience, and regulatory requirements [20] [22]. The most common strategies, as outlined in USP General Chapter <1224>, are summarized in the table below.
Table 1: Key Approaches for Analytical Method Transfer
| Transfer Approach | Core Principle | Best Suited For | Key Considerations |
|---|---|---|---|
| Comparative Testing [19] [20] | Both labs analyze identical samples; results are statistically compared for equivalence. | Well-established, validated methods; labs with similar capabilities and equipment [21]. | Requires robust statistical analysis and homogeneous samples; most common approach [19]. |
| Co-validation [19] [22] | The receiving lab participates in the original method validation study, providing reproducibility data. | New methods or those being developed for multi-site use from the outset [21]. | Fosters shared ownership and deep method understanding; requires high collaboration [19] [22]. |
| Re-validation [19] [20] | The receiving laboratory performs a full or partial revalidation of the method. | Significant differences in lab conditions/equipment or when the sending lab is unavailable [20]. | Most rigorous and resource-intensive approach; requires a full validation protocol [21]. |
| Data Review / Waiver [19] [21] | Historical data is reviewed, or the transfer is waived based on strong justification. | Simple compendial methods with minimal risk or highly experienced receiving labs [19]. | Rarely used; requires robust scientific justification and is subject to high regulatory scrutiny [21]. |
The Central Role of Robustness Testing
Robustness is a measure of an analytical procedure's capacity to remain unaffected by small, deliberate variations in method parameters [1]. It provides an indication of the method's inherent reliability during normal usage and is a critical predictor of its success during transfer.
Defining Robustness and Ruggedness
While often confused, robustness and ruggedness are distinct concepts. Robustness evaluates the method's sensitivity to changes in internal parameters written into the procedure, such as mobile phase pH, flow rate, column temperature, or wavelength [1]. Ruggedness, a term increasingly being replaced by "intermediate precision," refers to the method's performance under external variations, such as different analysts, instruments, or days [1]. A method demonstrating good robustness is more likely to be rugged and transfer successfully.
Experimental Design for Robustness Studies
A systematic, multivariate approach is recommended for robustness testing, as it is more efficient than changing one variable at a time and can reveal interactions between parameters [1].
- Screening Designs: These are efficient for identifying critical factors among a larger set. Common designs include [1]:
- Full Factorial: Measures all possible combinations of factors (2^k runs for k factors). Suitable for up to 5 factors.
- Fractional Factorial: A carefully chosen subset of runs from a full factorial design. Ideal for investigating more factors efficiently, though some interactions may be confounded.
- Plackett-Burman: Highly economical designs in multiples of four, used when only main effects are of interest.
Table 2: Example of Factor Variations in an HPLC Robustness Study
| Method Parameter | Nominal Value | Variation Range | Measured Impact (e.g., %RSD, Retention Time Shift) |
|---|---|---|---|
| Mobile Phase pH | 3.1 | ± 0.1 units | |
| Flow Rate | 1.0 mL/min | ± 0.1 mL/min | |
| Column Temperature | 30 °C | ± 2 °C | |
| % Organic in Mobile Phase | 45% | ± 2% | |
| Wavelength | 254 nm | ± 2 nm |
Protocol for a Robustness Study
The following workflow outlines a standard process for conducting a robustness study:
Best Practices for a Successful Transfer
A successful analytical method transfer is built on meticulous planning, clear communication, and rigorous documentation [19] [21].
- Comprehensive Protocol Development: A detailed, pre-approved protocol is essential. It must define the scope, responsibilities, samples, analytical procedure, pre-defined acceptance criteria, and the statistical methods for data comparison [19] [20]. The protocol requires approval from both laboratories and the Quality Assurance (QA) department [20].
- Risk Assessment and Mitigation: Before transfer, conduct a risk assessment to identify potential issues like instrument model differences, reagent variability, or analyst skill gaps [19] [21]. Mitigation strategies may include standardizing materials, ensuring equipment equivalency, and conducting pilot testing [19].
- Effective Knowledge Sharing: The transferring lab must provide a comprehensive package including the validated method, development report, validation data, known issues, and troubleshooting tips [20]. Hands-on training for the receiving lab's analysts is crucial for building proficiency [21].
- Thorough Documentation and Reporting: All data, including any deviations, must be meticulously recorded. A final report summarizes the results, statistical analysis, and concludes on the success of the transfer, requiring QA approval before the method can be used routinely in the receiving lab [19] [20].
The Scientist's Toolkit: Essential Research Reagent Solutions
The consistency and quality of reagents and standards are fundamental to the success of both robustness testing and method transfer. The following table details key materials and their functions.
Table 3: Essential Reagents and Materials for Analytical Method Transfer
| Item | Critical Function | Considerations for Transfer |
|---|---|---|
| Reference Standards [13] | Serves as the primary benchmark for quantifying the analyte and determining method accuracy. | Must be of certified purity and traceable to a recognized standard body. Use the same lot across TL and RL for transfer studies [20]. |
| Chromatography Columns [19] | The stationary phase responsible for the separation of analytes in HPLC/GC methods. | Column variability (lot-to-lot, different suppliers) is a major risk. Specify brand, dimensions, and particle chemistry. Pre-test columns from the same supplier [19] [1]. |
| HPLC/Spectroscopy Solvents [19] | Forms the mobile phase or solution matrix for analysis. | Use high-purity grades from the same supplier to minimize variability in UV cutoff, viscosity, and impurity profile [19]. |
| Buffer Salts & Additives [1] | Modifies mobile phase to control pH and ionic strength, impacting selectivity and peak shape. | Specify grade, supplier, and precise preparation methodology. Small variations in pH or concentration can significantly affect robustness [1]. |
| System Suitability Test (SST) Mixtures [20] | A prepared sample used to verify the entire chromatographic system's performance before analysis. | Critical for demonstrating method functionality in the RL. Typically contains key analytes and critical separation pairs [20]. |
Navigating Regulatory Guidelines
Adherence to regulatory guidelines is mandatory. Key documents governing method validation and transfer include [19]:
- ICH Q2(R2): "Validation of Analytical Procedures" provides the global standard for validation parameters [16] [14].
- USP General Chapter <1224>: "Transfer of Analytical Procedures" directly outlines transfer approaches [19].
- FDA & EMA Guidelines: Both agencies have issued guidance endorsing these principles and requiring evidence of method reliability across labs [19].
The recent simultaneous issuance of ICH Q2(R2) and ICH Q14 ("Analytical Procedure Development") marks a shift towards a more scientific, lifecycle-based approach [23] [14]. This emphasizes proactive development of robust methods using tools like the Analytical Target Profile (ATP), which prospectively defines the method's required performance characteristics, inherently facilitating smoother method transfers [14].
Analytical method transfer is a critical, non-negotiable element of the pharmaceutical quality system. Its success hinges on a foundation of rigorous robustness testing during method development, the selection of an appropriate transfer strategy, and unwavering attention to detail in execution and documentation. By systematically employing best practices—thorough planning, clear communication, and the use of qualified reagents—organizations can ensure the consistent quality of medicines, maintain regulatory compliance, and safeguard patient safety across the global manufacturing and testing network.
In the development of organic analytical procedures, the robustness of a method is a critical determinant of its long-term reliability and regulatory acceptance. Robustness is formally defined as a measure of an analytical procedure's capacity to remain unaffected by small, deliberate variations in method parameters and provides an indication of its reliability during normal usage [17]. This attribute is particularly crucial in pharmaceutical analysis, where method failures can lead to costly delays, regulatory non-compliance, and potential impacts on patient safety.
The International Conference on Harmonisation (ICH) guidelines emphasize robustness testing during method development, requiring demonstration that analytical methods can withstand typical operational variations encountered in different laboratories, by different analysts, and using different instruments [9]. Despite these requirements, non-robust methods continue to plague the industry, resulting in substantial scientific and economic consequences that merit thorough examination.
This article presents a comprehensive comparison between robust and non-robust analytical approaches through detailed case studies across multiple domains, with particular focus on pharmaceutical applications. We summarize quantitative performance data, provide detailed experimental protocols, and identify essential research reagents to support method development within a Quality by Design (QbD) framework.
Comparative Performance: Robust vs. Non-Robust Methods
Statistical Modeling Case Study
In longitudinal data analysis, the choice between robust and non-robust methods significantly impacts result reliability, particularly when data deviate from normality and contain missing values. Simulation studies comparing Linear Mixed-Effects Models (LMM) with robust alternatives demonstrate critical performance differences.
Table 1: Performance Comparison of Statistical Methods for Non-Normal Data with Missing Values
| Method | Key Assumptions | Bias in Fixed-Effect Estimates | Performance Under MAR Missing Data | Primary Limitations |
|---|---|---|---|---|
| Linear Mixed-Effects Models (LMM) | Normal distribution of errors and random effects | Significant bias under non-normality with missing data | Poor performance with skewed data | Highly sensitive to distributional assumptions and missing data mechanisms |
| Weighted Generalized Estimating Equations (WGEE) | Only marginal mean structure specification | Minimal bias under non-normality | Valid inference for skewed MAR data | Requires correct missing data model |
| Augmented WGEE (AWGEE) | Marginal mean and missing data model | Minimal bias (double robustness property) | Valid inference even with incorrect missing data model | Computational complexity |
Simulation studies reveal that while LMM provides reliable estimates under complete data conditions, its robustness is compromised with missing data when error terms deviate from normality. In these scenarios, LMM fixed-effect estimates demonstrate significant bias, whereas both WGEE and AWGEE maintain valid inference for skewed non-normal data when missing data follows the Missing At Random (MAR) mechanism [24].
Analytical Chemistry Case Study
In pharmaceutical analysis, High-Performance Liquid Chromatography (HPLC) method robustness directly impacts method transfer success and routine application reliability. Experimental designs systematically evaluating parameter variations demonstrate measurable consequences of non-robust methods.
Table 2: HPLC Robustness Test Results for Active Compound and Related Substances
| Varied Parameter | Nominal Level | Variation Range | Impact on % Recovery (Active Compound) | Impact on Critical Resolution | Significance |
|---|---|---|---|---|---|
| Mobile Phase pH | 3.1 | ±0.1 units | -1.2% to +0.9% variation | Decrease by 0.3 at lower pH | Critical parameter requiring tight control |
| Column Temperature | 25°C | ±2°C | -0.7% to +0.5% variation | Minimal change (<0.1) | Non-critical within tested range |
| Flow Rate | 1.0 mL/min | ±0.1 mL/min | -1.5% to +1.8% variation | Decrease by 0.4 at higher flow | Critical parameter requiring specification |
| Organic Solvent % | 45% | ±2% | -2.1% to +1.7% variation | Decrease by 0.5 at lower organic | Critical parameter requiring specification |
Studies demonstrate that non-robust HPLC methods exhibit significant sensitivity to variations in critical parameters like mobile phase pH, flow rate, and organic solvent composition. These variations directly impact key performance indicators including percent recovery of active compounds and critical resolution between compounds [17]. The measurable consequences include out-of-specification results, system suitability test failures, and method transfer difficulties between laboratories.
Experimental Protocols for Robustness Assessment
Robustness Screening for Chemical Reactions
The assessment of robustness in chemical reactions employs a systematic protocol to identify limitations and failure points under varied conditions:
Parameter Selection: Identify critical reaction parameters including temperature, solvent composition, catalyst load, concentration, and reaction time based on preliminary risk assessment.
Experimental Design: Implement a Plackett-Burman design or fractional factorial design to efficiently evaluate multiple parameters with minimal experiments. For 8 factors, a 12-experiment Plackett-Burman design provides sufficient data for statistical analysis [17].
Level Selection: Define high and low levels for each parameter representing variations expected during normal method transfer and use. Levels typically represent "nominal level ± k * uncertainty" where k ranges from 2-10 based on parameter criticality [17].
Execution Protocol:
- Perform experiments in randomized sequence to minimize uncontrolled influences
- Include regular replicates at nominal conditions to monitor and correct for systematic drift
- For impractical randomization (e.g., column changes), block experiments by the challenging factor
Response Measurement: Quantify key performance indicators including yield, purity, reaction completion, and byproduct formation for each experimental condition.
Data Analysis:
- Calculate factor effects as Ex = (Ȳhigh - Ȳlow) for each parameter-response combination
- Apply statistical analysis (ANOVA) to identify significant effects
- Use graphical methods (normal probability plots) to distinguish significant from random effects [17]
Method Definition: Establish system suitability test limits and control strategies for critical parameters based on observed effects.
Robustness Evaluation for Analytical Methods
The protocol for assessing analytical method robustness follows a structured approach aligned with ICH guidelines:
Experimental Workflow for Analytical Method Robustness Assessment
Factor Selection and Level Definition:
- Select factors related to both procedural description and environmental conditions
- Define extreme levels as symmetric or asymmetric intervals around nominal conditions based on parameter behavior
- For quantitative factors (pH, temperature, flow rate), select levels representing expected operational variations
Design Selection:
- For screening purposes, employ fractional factorial or Plackett-Burman designs
- Select design resolution based on number of factors and resources
- Include dummy factors in unsaturated designs to estimate experimental error
Response Selection:
- Include both assay responses (content determinations, impurity quantifications) and system suitability test parameters (resolution, tailing factor, retention time)
- Define acceptance criteria for each response prior to experimentation
Experimental Execution:
- Prepare representative test solutions (blank, standard, sample)
- Execute experiments in defined sequence, with randomization where practical
- For time-sensitive factors, implement anti-drift sequences or include nominal condition replicates for drift correction
Effect Estimation and Statistical Analysis:
- Calculate factor effects using Ex = (ΣY+ - ΣY-)/N for each parameter
- Apply statistical significance testing using estimated experimental error
- Utilize graphical methods including normal probability plots and half-normal plots to identify significant effects
Conclusion and Control Strategy:
- Classify parameters as critical or non-critical based on statistical and practical significance
- Define system suitability test limits based on robustness study results
- Establish control strategies for critical parameters [17]
The Scientist's Toolkit: Essential Research Reagents and Materials
Table 3: Essential Research Reagents and Materials for Robustness Studies
| Reagent/Material | Function in Robustness Assessment | Application Notes |
|---|---|---|
| Reference Standards | Quantification and system suitability verification | Use highly characterized materials with certified purity; essential for accuracy determination |
| Chromatographic Columns | Stationary phase for separation | Test multiple lots and/or manufacturers to assess column-to-column variability |
| Mobile Phase Components | Creation of elution environment | Vary pH, buffer concentration, and organic modifier percentage within realistic ranges |
| Sample Preparation Solvents | Extraction and dissolution medium | Evaluate impact of different grades, suppliers, and preparation methods |
| System Suitability Test Mixtures | Verification of method performance | Contain critical analyte pairs to assess resolution, efficiency, and sensitivity |
| Chemical Forcing Agents | Intentional stress conditions | Acids, bases, oxidants, and light sources for forced degradation studies |
Successful robustness testing requires careful selection and control of research reagents to ensure meaningful results. The method operable design region (MODR) is established based on demonstrated robustness across variations in these essential materials [9]. Implementation of Analytical Quality by Design (AQbD) principles enhances method robustness by systematically understanding and controlling relevant sources of variability, thereby reducing errors and out-of-specification results during routine use [9].
Consequences of Non-Robust Methods in Practice
Impact on Method Transfer and Reliability
Non-robust methods manifest significant operational consequences during technology transfer and routine application:
Method Transfer Failures: Methods that perform adequately in the development laboratory frequently fail during transfer to quality control laboratories due to unaccounted-for variations in equipment, reagents, and environmental conditions. These failures necessitate costly redevelopment and revalidation activities, delaying product development timelines.
System Suitability Test Failures: Non-robust methods exhibit heightened sensitivity to minor variations, resulting in frequent system suitability test failures during routine analysis. This necessitates extensive investigation, repeat testing, and potential batch rejection, impacting manufacturing efficiency and product release.
Inter-laboratory Variability: Without demonstrable robustness, methods produce significantly different results when performed by different analysts, using different instruments, or in different locations. This variability complicates result interpretation and decision-making based on analytical data.
Regulatory Challenges: Regulatory submissions require demonstration of method robustness. Non-robust methods face increased scrutiny during review and may receive deficiencies, delaying approval and requiring additional studies to address concerns.
Economic and Timeline Implications
The economic consequences of non-robust methods extend throughout the product lifecycle:
Investigation Costs: Each method failure or out-of-specification result triggers resource-intensive investigations requiring technical staff time, management oversight, and potentially manufacturing process review.
Timeline Impacts: Method redevelopment, additional validation, and regulatory responses can delay product launches by several months, resulting in significant opportunity costs and potential loss of market advantage.
Control Strategy Costs: Non-robust methods require tighter controls on reagents, equipment, and operating procedures, increasing routine testing costs and complexity.
The adoption of robust method development principles, including systematic robustness testing during development rather than after validation, significantly mitigates these consequences by identifying critical parameters early and establishing appropriate control strategies [17].
Non-robust analytical methods present substantial scientific and economic consequences throughout the pharmaceutical development lifecycle. Through systematic case studies, we have demonstrated that non-robust methods generate biased results, increase variability, and impair method transferability.
The implementation of structured robustness testing during method development, utilizing appropriate experimental designs and statistical analysis, enables identification of critical method parameters and establishment of effective control strategies. The adoption of Analytical Quality by Design principles provides a framework for developing inherently robust methods, reducing the occurrence of method failures and their associated consequences.
Robustness should not be an afterthought in analytical method development but rather an integral consideration throughout the method lifecycle. By prioritizing robustness during development, researchers can ensure reliable method performance, successful technology transfer, and maintained regulatory compliance, ultimately supporting the efficient development of quality pharmaceutical products.
Implementing Robustness Studies: Experimental Designs and Practical Applications
Robustness is defined as the capacity of an analytical procedure to remain unaffected by small, deliberate variations in method parameters and provides an indication of its reliability during normal usage [17]. This characteristic measures a method's resilience to minor operational fluctuations that inevitably occur during transfer between laboratories, analysts, or instruments. For researchers and drug development professionals, establishing method robustness is not merely a regulatory formality but a fundamental aspect of ensuring data integrity and reproducibility throughout the method lifecycle [25].
The International Conference on Harmonisation (ICH) guidelines recognize robustness as a critical validation parameter, while the United States Pharmacopeia (USP) has historically referred to a related concept as "ruggedness," defined as the degree of reproducibility of test results under a variety of normal conditions including different laboratories, analysts, instruments, and reagent lots [1]. Although terminology has evolved toward harmonization, with "intermediate precision" now often replacing "ruggedness" in regulatory contexts, the underlying principle remains essential: analytical methods must produce reliable results despite expected operational variations [1].
This guide examines the critical parameters that determine HPLC method robustness, providing a structured comparison of approaches for identifying, testing, and controlling these factors to ensure method reliability in pharmaceutical analysis and research settings.
Critical HPLC Method Parameters for Robustness Evaluation
Classification of Method Parameters
In robustness testing, method parameters are typically categorized as either internal (robustness) or external (ruggedness) factors [1]. Internal factors are those specified within the method documentation, such as mobile phase composition, pH, flow rate, and column temperature. External factors encompass elements not typically specified in methods, such as the analyst performing the test, the specific instrument used, or the day of analysis [1]. A practical rule of thumb distinguishes these: if a parameter is written into the method, it constitutes a robustness consideration; if it is not specified but may vary during normal use, it represents a ruggedness issue [1].
High-Impact HPLC Parameters
Mobile Phase Composition and pH are among the most critical parameters affecting separation robustness. The pH of the mobile phase profoundly impacts the ionization state of analytes, particularly when dealing with ionizable compounds, which constitute many pharmaceutical substances. For acidic analytes, maximum retention occurs in eluent systems at approximately two pH units lower than the functional group pKa, while basic analytes show maximum retention at two pH units higher than their pKa values [26]. Operating near analyte pKa values decreases robustness, as small changes in eluent pH cause significant retention time shifts. True buffer systems with adequate capacity provide more robust separation compared to single-component pH modifiers like trifluoroacetic acid [26].
Column Temperature significantly influences separation selectivity and efficiency. Temperature affects retention through its impact on thermodynamic partitioning and can alter selectivity for complex mixtures. Modern HPLC systems with advanced thermostatting capabilities allow precise temperature control, which is essential for robust methods [25]. During method development, temperature screening identifies optimal conditions that minimize sensitivity to minor fluctuations.
Flow Rate directly impacts retention times and backpressure. While retention time shows an inverse relationship with flow rate, peak shape and resolution may also be affected, particularly for complex separations. Robust methods maintain acceptable performance despite minor flow rate variations expected between different instruments [17].
Stationary Phase Characteristics including ligand chemistry, particle size, pore size, and manufacturer lot introduce important variables. Column chemistry differences, even between seemingly equivalent C18 columns from various manufacturers, can significantly alter selectivity [27]. Smaller particles (1.7-5µm for UPLC, 3-5µm for HPLC) increase efficiency but require higher operating pressures and may demonstrate different batch-to-batch variability [28].
Table 1: Critical HPLC Method Parameters and Their Impact on Separation
| Parameter Category | Specific Factors | Impact on Separation | Typical Variation Ranges |
|---|---|---|---|
| Mobile Phase | pH | Retention of ionizable compounds; selectivity | ±0.1-0.2 pH units |
| Buffer concentration | Peak shape; retention time | ±5-10% of nominal | |
| Organic modifier ratio | Retention; selectivity; pressure | ±1-2% absolute | |
| Column | Temperature | Retention; selectivity | ±2-5°C |
| Type/brand | Selectivity; efficiency | Different lots/manufacturers | |
| Age/history | Retention; peak shape | New vs. used columns | |
| System | Flow rate | Retention time; pressure | ±0.05-0.1 mL/min |
| Wavelength | Response factor; sensitivity | ±2-5 nm | |
| Gradient delay volume | Retention time (gradient methods) | Instrument-dependent |
Experimental Designs for Robustness Testing
Screening Design Approaches
Robustness testing systematically evaluates how method parameters affect analytical responses using structured experimental designs. Traditional univariate approaches (changing one factor at a time) have largely been replaced by more efficient multivariate designs that capture factor interactions [1]. Screening designs represent the most appropriate approach for robustness studies, with three primary types employed [1] [11]:
Full factorial designs investigate all possible combinations of factors at two levels (high and low). For k factors, this requires 2^k experiments. While comprehensive, these designs become impractical beyond 4-5 factors due to the exponentially increasing number of runs [1].
Fractional factorial designs carefully selected subsets of full factorial experiments that maintain the ability to estimate main effects while reducing experimental burden. These designs are particularly valuable when investigating 5 or more factors, as they can reduce the number of runs by half, quarter, or smaller fractions while still providing meaningful data [1].
Plackett-Burman designs highly efficient screening designs that require a multiple of four experiments to study up to N-1 factors. These designs are especially suitable for robustness testing where the primary interest lies in identifying significant main effects rather than detailed interaction effects [11] [17]. For example, a Plackett-Burman design with 12 experiments can efficiently evaluate the effects of 11 factors [1].
Implementing Robustness Studies
A systematic approach to robustness testing involves several defined stages [17]. First, critical factors and their appropriate test ranges are selected based on method knowledge and practical experience. The experimental levels should represent variations expected during method transfer between laboratories or instruments [17]. Quantitative factors typically employ symmetric intervals around the nominal level (e.g., nominal ± variation), though asymmetric intervals may be appropriate for parameters with nonlinear responses [17].
After executing the designed experiments, factor effects are calculated as the difference between average responses at high and low levels for each factor [17]. These effects are then evaluated statistically or graphically to distinguish significant impacts from random variation. Graphical approaches include normal or half-normal probability plots, while statistical methods may use t-tests or critical effects derived from dummy factors or the algorithm of Dong [17].
Diagram 1: Robustness Testing Workflow. This diagram illustrates the systematic approach to evaluating method robustness, from factor selection through method implementation.
Comparative Data: Experimental Designs for Robustness
The selection of an appropriate experimental design represents a critical decision in robustness testing, balancing comprehensiveness against practical constraints. Different designs offer distinct advantages depending on the number of factors under investigation and the specific objectives of the study [1] [11].
Table 2: Comparison of Experimental Designs for Robustness Testing
| Design Type | Number of Factors | Number of Experiments | Advantages | Limitations |
|---|---|---|---|---|
| Full Factorial | 2-5 | 2^k | Estimates all main effects and interactions; no confounding | Number of experiments grows exponentially with factors |
| Fractional Factorial | 5-8 | 2^(k-p) | Reduces experimental burden; good for estimating main effects | Some confounding of interactions; careful fraction selection needed |
| Plackett-Burman | Up to N-1 | Multiple of 4 | Highly efficient for screening many factors; minimal runs | Cannot estimate interactions; only main effects identified |
The two-level full factorial design represents the most comprehensive approach for robustness evaluation but becomes impractical when investigating more than 4-5 factors [11]. For instance, examining 8 factors would require 256 experiments (2^8) in a full factorial design - an often prohibitive number. In such cases, fractional factorial or Plackett-Burman designs offer more efficient alternatives [1]. Research indicates that Plackett-Burman designs are the most frequently employed approach for robustness studies involving larger numbers of factors due to their operational convenience and statistical efficiency [11].
The Scientist's Toolkit: Essential Research Reagents and Materials
Successful robustness testing requires careful selection of reagents and materials that match the method's requirements and anticipated variations. The following table outlines key materials and their functions in robustness studies.
Table 3: Essential Research Reagents and Materials for Robustness Testing
| Reagent/Material | Function in Robustness Testing | Considerations for Selection |
|---|---|---|
| HPLC Columns | Stationary phase; primary separation mechanism | Include multiple lots/ manufacturers; consider particle size (3-5µm for HPLC, 1.7-5µm for UPLC) [27] [28] |
| Buffer Components | Mobile phase pH control; ion pairing | pKa within 1 unit of desired pH; adequate capacity (typically 25mM) [26] |
| Organic Modifiers | Mobile phase elution strength | Acetonitrile (low UV cutoff); methanol (alternative selectivity) [26] |
| pH Standard Solutions | Instrument calibration for mobile phase preparation | Accuracy of ±0.01 pH units for reproducible buffer preparation |
| Reference Standards | System suitability; quantitative assessment | Certified purity; stability under method conditions |
Advanced LC systems with automated method scouting capabilities significantly enhance robustness testing efficiency. These systems can automatically screen multiple columns with various aqueous buffers across different pH ranges, substantially reducing the manual effort required for comprehensive robustness assessment [25]. For example, one documented system tested 24 different chromatographic conditions in less than 20 hours with minimal manual intervention [25].
Case Study: HPLC Method Robustness Evaluation
A practical example from the literature illustrates the application of robustness testing principles to an HPLC assay for an active compound and two related compounds in a drug formulation [17]. This study examined eight critical factors using a Plackett-Burman design with 12 experiments, including three dummy factors to estimate experimental error.
The investigated factors included mobile phase pH (±0.2 units), concentration of organic modifier in the mobile phase (±2% absolute), column temperature (±3°C), flow rate (±0.1 mL/min), detection wavelength (±5 nm), and different columns from the same and different manufacturers [17]. Responses measured included percent recovery of the active compound and critical resolution between the active compound and its closest eluting related substance.
The results demonstrated that flow rate and organic modifier concentration had statistically significant effects on retention time, while pH variations most significantly impacted critical resolution [17]. Based on these findings, the method documentation included specific precautions for precise mobile phase preparation and strict temperature control, while establishing system suitability criteria that accounted for the identified sensitive parameters.
This case highlights how structured robustness testing provides actionable data for method improvement and establishes scientifically justified system suitability limits that ensure method reliability throughout its lifecycle [17].
Method Transfer and Lifecycle Management
The ultimate validation of method robustness occurs during successful method transfer between laboratories or instruments. Method transfer represents a frequent challenge in analytical laboratories, as even minor differences in equipment characteristics can affect separation [25]. Parameters such as gradient delay volume (GDV), pump mixing efficiency, and column thermostatting performance vary between systems and require attention during transfer.
Advanced LC systems facilitate method transfer through features that allow adjustment of key parameters to match original validation conditions [25]. For example, some systems permit fine-tuning of the GDV through software adjustments of autosampler metering device idle volume or optional hardware modification kits. Documented cases show that adjusting GDV can effectively eliminate retention time discrepancies observed during method transfer [25].
Method lifecycle management (MLCM) extends robustness considerations beyond initial validation to encompass the entire period of method use [25]. A robust MLCM strategy invests effort upfront in comprehensive method characterization, enabling quicker troubleshooting and adaptation to changing circumstances. Automated validation workflows incorporating predefined templates based on ICH guidelines streamline the process of method qualification and revalidation [25].
Robustness testing represents an essential investment in method reliability that pays dividends throughout the analytical lifecycle. By systematically identifying and controlling critical method parameters, researchers can develop HPLC methods that withstand normal operational variations encountered in different laboratories and over time. The experimental design approaches outlined in this guide provide efficient frameworks for comprehensive robustness assessment, while proper documentation of factor effects establishes scientifically sound system suitability criteria.
As chromatographic technologies advance, automated scouting systems and sophisticated method lifecycle management tools continue to enhance our ability to develop, validate, and transfer robust methods. By adopting these structured approaches to robustness testing, researchers and drug development professionals can ensure the generation of reliable, reproducible data that meets stringent regulatory requirements and maintains product quality throughout the method lifecycle.
Defining Appropriate Factor Ranges and Acceptance Criteria
Robustness testing is a critical component of analytical method validation, serving as a measure of a method's reliability during normal usage. The International Conference on Harmonization (ICH) defines robustness/ruggedness as "a measure of its capacity to remain unaffected by small but deliberate variations in method parameters and provides an indication of its reliability during normal usage" [17]. For researchers and drug development professionals, establishing scientifically sound factor ranges and acceptance criteria is paramount to ensuring that analytical methods transfer successfully between laboratories and maintain data integrity throughout a product's lifecycle.
This evaluation is particularly crucial for organic analytical procedures in pharmaceutical development, where method reliability directly impacts product quality assessments. A statistically rigorous approach to defining these parameters not only safeguards against out-of-specification results but also builds confidence in the analytical data supporting regulatory submissions [29].
Establishing Factor Ranges: Methodologies and Protocols
Identification of Critical Method Parameters
The first step in robustness testing involves identifying critical analytical variables likely to influence method performance. For chromatographic methods, these typically include factors related to the mobile phase, stationary phase, instrument parameters, and environmental conditions [30]. A systematic approach to parameter selection ensures that all potential sources of variability are considered.
Factors should be selected based on their potential impact on method performance and the likelihood of variation during routine use. Quantitative factors (e.g., pH, temperature, flow rate) and qualitative factors (e.g., column manufacturer, reagent batch) should both be considered, as each presents different challenges during method transfer [17].
Defining Appropriate Variation Ranges
Establishing appropriate variation ranges for each parameter requires both scientific judgment and practical considerations. The extreme levels for quantitative factors are typically chosen symmetrically around the nominal level described in the method procedure [17]. The variation interval should be representative of changes expected during method transfer between laboratories or instruments.
For quantitative factors, ranges can be defined as "nominal level ± k * uncertainty," where the uncertainty is based on the largest absolute error for setting a factor level, and k is typically between 2 and 10 [17]. This approach accounts for both measurement uncertainty and exaggerates factor variability to thoroughly challenge the method.
Asymmetric ranges may be appropriate when symmetric intervals do not accurately represent real-world conditions or when the analytical response changes disproportionately in one direction [17]. For instance, if a method is more sensitive to decreases in pH than increases, an asymmetric range would provide more meaningful data.
Table 1: Example Factor Ranges for an HPLC Method
| Robustness Parameters | Nominal Value | Level (-1) | Level (+1) |
|---|---|---|---|
| pH | 2.7 | 2.5 | 3.0 |
| Flow rate (ml/minute) | 1.0 | 0.9 | 1.1 |
| Column temperature (°C) | 30 | 25 | 35 |
| Buffer concentration (M) | 0.02 | 0.01 | 0.03 |
| Mobile phase composition | 60:40 | 57:43 | 63:37 |
| Column manufacturer | Make X | Make Y | Make Z |
Source: Adapted from [30]
Experimental Design for Robustness Assessment
Design Selection Strategies
Robustness testing employs structured experimental designs to efficiently evaluate multiple factors simultaneously. Two-level screening designs, such as fractional factorial (FF) or Plackett-Burman (PB) designs, are commonly used as they examine f factors in minimally f+1 experiments [17]. The choice between different designs depends on the number of factors being investigated and the desired resolution of interactions.
For example, with 7 factors, possible design options include FF designs with 8 or 16 experiments, or PB designs with 8 or 12 experiments [17]. The 12-experiment PB design is particularly efficient for examining 8 factors while allowing for the estimation of effects without confounding. These efficient designs enable researchers to evaluate multiple parameters with minimal experimental runs, conserving resources while maintaining statistical power.
Response Selection and Measurement
Both assay responses (e.g., content determinations, impurity quantifications) and system suitability test (SST) responses (e.g., resolution, peak asymmetry, theoretical plates) should be monitored during robustness studies [17]. While the quantitative assay responses determine whether the method is robust for its intended purpose, SST parameters often reveal subtle method sensitivities that might affect long-term reliability.
In separation techniques, critical responses typically include retention times, capacity factors, resolution between critical pairs, tailing factors, and theoretical plate count [17] [30]. Establishing baseline performance for these parameters at nominal conditions provides a reference for evaluating the impact of factor variations.
Figure 1: Robustness Testing Workflow - This diagram illustrates the systematic approach to robustness testing, from initial parameter definition through to final control strategy establishment.
Statistical Analysis and Acceptance Criteria
Analysis of Factor Effects
The effect of each factor on method responses is calculated as the difference between the average responses when the factor was at its high level and low level, respectively [17]. For a factor X on response Y, the effect (Ex) is expressed as:
Ex = (ΣY(+1) / N(+1)) - (ΣY(-1) / N(-1))
where Y(+1) and Y(-1) represent responses at high and low levels, and N represents the number of experiments at each level [17].
Statistical and graphical methods are then used to determine the significance of these effects. Normal probability plots and half-normal probability plots help distinguish significant effects from random variation by visualizing the distribution of effects [17]. Effects that deviate substantially from the expected normal distribution indicate parameters that significantly influence method performance.
Establishing Acceptance Criteria
Acceptance criteria for robustness testing should be based on the method's system suitability test (SST) requirements [30]. The method must meet all SST acceptance criteria under each variation condition to be considered robust. For chromatographic methods, this typically includes parameters such as resolution between critical pairs, tailing factors, and theoretical plates.
For the quantitative aspect, method precision and accuracy should remain within predefined limits despite parameter variations. A modern approach recommends evaluating precision as a percentage of the specification tolerance:
Repeatability % Tolerance = (Stdev Repeatability × 5.15) / (USL - LSL) [29]
where USL and LSL represent upper and lower specification limits, respectively. This approach directly links method performance to its impact on product quality decisions.
Table 2: Acceptance Criteria for Analytical Method Validation
| Validation Parameter | Recommended Acceptance Criteria | Basis for Evaluation |
|---|---|---|
| Specificity | ≤10% of tolerance | Signal response in presence of interferents vs. standard |
| Linearity | No systematic pattern in residuals; no significant quadratic effect | Studentized residuals from regression |
| Range | ≤120% of USL; demonstrated linear, accurate, and precise | Specification limits and method capability |
| Repeatability | ≤25% of tolerance (analytical methods); ≤50% of tolerance (bioassays) | Standard deviation relative to specification range |
| Bias/Accuracy | ≤10% of tolerance | Difference from reference value relative to specification range |
| LOD/LOQ | LOD ≤10%; LOQ ≤20% of tolerance | Detection/quantitation limits relative to specification |
Source: Adapted from [29]
Case Study: HPLC Method Robustness Testing
Experimental Protocol
A practical example illustrates the application of these principles to an HPLC method for a drug substance with specified impurities [30]. The method required quantification of Impurity A (NMT: 0.20%), Impurity B (NMT: 0.20%), any unknown impurity (NMT: 0.10%), and total impurities (NMT: 0.50%). The SST criterion specified resolution (R) between the main analyte peak D and impurity peak A should be ≥2.0.
The robustness testing examined six parameters: pH, flow rate, column temperature, buffer concentration, mobile phase composition, and column manufacturer. For each parameter, experiments were conducted at three levels: nominal, low extreme (-1), and high extreme (+1), as detailed in Table 1.
Results and Interpretation
The critical response, resolution between peak D and impurity A, was measured under all conditions. Results demonstrated that resolution remained ≥2.5 across all parameter variations, well above the SST requirement of ≥2.0 [30]. This consistency confirmed the method's robustness within the defined parameter ranges.
The study successfully identified that mobile phase composition had the greatest impact on resolution, though even at the extreme levels (2.5 at level -1), the method remained suitable [30]. This finding informed the control strategy, suggesting tighter control over mobile phase preparation while confirming that the method would tolerate typical laboratory variations.
Figure 2: Parameter Impact on Method Responses - This diagram visualizes the relationship between critical method parameters and quality responses, highlighting mobile phase composition as the most significant factor affecting resolution.
Advanced Considerations in Robustness Testing
Uncertainty Quantification
From an academic perspective, robustness represents a quantifiable component of a method's overall measurement uncertainty [18]. Advanced approaches employ statistical techniques such as Monte Carlo simulations and Bayesian methods to model the propagation of uncertainty from various robustness factors through the analytical procedure [18].
This quantification enables a more precise understanding of how each factor contributes to overall result variability, supporting more informed decision-making regarding which parameters require tighter control. The integration of robustness studies into measurement uncertainty estimates represents best practice in modern analytical chemistry [18].
Emerging Approaches
Recent advances incorporate machine learning algorithms to predict method performance under different parameter combinations, allowing for virtual robustness testing during method development [18]. These approaches can identify critical parameters more efficiently than traditional experimental designs alone, optimizing resource allocation.
Additionally, Bayesian deep learning models have shown promise in predicting reaction feasibility and robustness against environmental factors in organic synthesis, achieving prediction accuracies of 89.48% in some studies [31]. While these approaches are currently more common in reaction optimization, their principles are increasingly applied to analytical method development.
The Scientist's Toolkit: Essential Research Reagents and Materials
Table 3: Essential Research Reagents and Materials for Robustness Studies
| Item Category | Specific Examples | Function in Robustness Testing |
|---|---|---|
| Chromatographic Columns | C18 columns from different manufacturers (e.g., Makes X, Y, Z) | Evaluates stationary phase variability and method selectivity across different column chemistries |
| Buffer Components | Potassium dihydrogen phosphate (KH₂PO₄), pH-adjusting reagents (e.g., phosphoric acid) | Assesses method sensitivity to mobile phase ionic strength and pH variations |
| Organic Solvents | HPLC-grade acetonitrile, methanol | Tests mobile phase composition effects on retention behavior and separation efficiency |
| Reference Standards | Drug substance, impurity standards (e.g., Impurity A, B) | Provides benchmark for evaluating method performance under varied conditions |
| Chemical Reagents | Different lots of condensation reagents, bases | Determines impact of reagent variability on method performance, particularly for derivatization methods |
Source: Compiled from [17] [30] [31]
In the development of organic analytical procedures, ensuring that a method remains unaffected by small, deliberate variations in method parameters is a critical objective. This process, known as robustness testing, is a fundamental validation step that provides confidence in method reliability during routine use. Factorial designs represent a core statistical approach in this context, enabling a systematic investigation of the effects that multiple factors simultaneously exert on analytical responses. Within pharmaceutical development, these experimental strategies allow scientists to efficiently identify critical factors and their interactions that could impact method performance, thereby supporting regulatory submissions and ensuring product quality [32] [33].
The full factorial design constitutes the most comprehensive approach, examining all possible combinations of factors and their levels. In contrast, the fractional factorial design investigates only a carefully selected subset of these combinations. This guide provides an objective comparison of these two methodologies, focusing on their application, efficiency, and output in the context of robustness testing for organic analytical procedures. The strategic selection between these designs directly impacts resource allocation, experimental timeline, and the depth of understanding achieved—all crucial considerations in drug development environments [34] [35].
Fundamental Principles and Definitions
Core Concepts of Factorial Designs
A factorial design is a structured experimental approach that investigates the effects of two or more independent variables (factors) on a dependent variable (response). By manipulating multiple factors simultaneously across their specified levels, researchers can determine not only the individual contribution of each factor (main effects) but also whether the effect of one factor depends on the level of another (interaction effects) [36].
Key terminology essential for understanding these designs includes:
- Factors: Independent variables that are deliberately varied during an experiment. In robustness testing for chromatography, examples include pH of the mobile phase, column temperature, and flow rate [37] [33].
- Levels: The specific values or settings at which a factor is maintained. For screening and robustness testing, two levels (typically coded as -1 and +1, representing low and high values) are most common [38] [39].
- Runs: The individual experiments performed, each representing a unique combination of factor levels [38].
- Main Effect: The average change in response when a factor moves from its low to high level, averaging across the levels of all other factors [36].
- Interaction Effect: Occur when the effect of one factor on the response differs depending on the level of another factor [37] [33].
Full Factorial Designs Explained
A full factorial design involves conducting experiments at all possible combinations of the levels for all factors. For a design with k factors each at 2 levels, the total number of runs required is 2k [38]. This comprehensive approach ensures that sufficient data is collected to independently estimate all main effects and all interaction effects, from two-way interactions up to the k-way interaction [37]. The complete information obtained provides a full map of the experimental landscape, leaving no combination untested. This is particularly valuable when studying complex systems with potential factor interdependencies, as it eliminates the risk of missing critical interactions that could affect analytical method performance [35].
Fractional Factorial Designs Explained
A fractional factorial design is a strategic fraction (typically 1/2, 1/4, 1/8, etc.) of a full factorial design. It requires only a subset of the runs from the full factorial, selected in such a way that main effects and lower-order interactions can still be estimated, though often with some confounding [38] [33]. The primary motivation for using fractional factorial designs is efficiency—they allow researchers to screen a large number of factors with a practically feasible number of experiments when resources are constrained [40] [35].
This efficiency comes with a trade-off: the intentional confounding (or aliasing) of effects. In fractional designs, some effects are mathematically intertwined and cannot be estimated separately [38] [33]. The resolution of a fractional factorial design describes the degree of confounding between effects and indicates what types of effects are aliased with each other [34] [33].
Head-to-Head Comparison: Key Differences
The choice between full and fractional factorial designs involves balancing completeness of information against experimental efficiency. The table below provides a structured comparison of their characteristics.
Table 1: Comprehensive comparison of full and fractional factorial designs
| Characteristic | Full Factorial Design | Fractional Factorial Design |
|---|---|---|
| Number of Runs | 2k (for k factors at 2 levels) [38] | 2k-p (e.g., 1/2 fraction: 2k-1; 1/4 fraction: 2k-2) [38] [33] |
| Information Obtained | All main effects and all interactions [37] | Main effects and lower-order interactions, with confounding [38] |
| Resource Requirements | High (exponentially increases with factors) [35] | Low to moderate (linear increase with factors) [35] |
| Statistical Power | High for detecting all effects [35] | Moderate, focused on main and two-factor interactions [35] |
| Best Application Phase | Optimization (when critical factors are known) [40] [34] | Screening (identifying critical factors from many candidates) [34] [33] |
| Risk of Missing Interactions | Low [35] | Moderate to High (depending on resolution) [41] [35] |
| Interpretation Complexity | Higher due to many interactions [37] | Lower initially, but requires care in interpreting aliased effects [35] |
| Assumptions Required | None about effect significance [35] | Assumes higher-order interactions are negligible [38] [35] |
Quantitative Comparison of Experimental Scale
The exponential growth in required experiments for full factorial designs becomes practically limiting as the number of factors increases. The following table illustrates this relationship and how fractional designs provide a more feasible alternative.
Table 2: Run requirements for different numbers of factors at two levels
| Number of Factors | Full Factorial Runs | ½ Fractional Factorial Runs | ¼ Fractional Factorial Runs |
|---|---|---|---|
| 3 | 8 [38] | 4 | - |
| 4 | 16 [38] | 8 [33] | - |
| 5 | 32 [38] [40] | 16 [40] | 8 |
| 6 | 64 [38] | 32 | 16 [33] |
| 7 | 128 [35] | 64 | 32 |
| 8 | 256 | 128 | 64 |
For a typical robustness test with 5 factors, a full factorial requires 32 runs, while a half-fraction requires only 16 runs—a 50% reduction in experimental effort [40]. A case study on adhesion properties demonstrated that a fractional factorial design could maintain essential insights with minimal data loss while achieving significant time and cost savings [41].
Information Completeness and Confounding
The key differentiator between the designs is information completeness. Full factorial designs provide uncontaminated estimates of all effects, whereas fractional factorials confound certain effects with others.
- Resolution III: Main effects are confounded with two-factor interactions [33]
- Resolution IV: Main effects are confounded with three-factor interactions, and two-factor interactions are confounded with each other [33]
- Resolution V: Main effects are confounded with four-factor interactions, and two-factor interactions are confounded with three-factor interactions [40]
In robustness testing, where higher-order interactions (three-factor and above) are typically negligible, Resolution V designs are often considered optimal as they allow clear estimation of main effects and two-factor interactions without confounding between these important effects [40].
Selection Guidelines for Robustness Testing
Choosing the appropriate design requires careful consideration of experimental goals, constraints, and the current state of process knowledge. The following decision pathway provides a systematic approach for selection.
Diagram 1: Factorial design selection pathway
Application in Different Phases of Method Development
The sequential nature of analytical method development suggests different optimal applications for each design type:
Early Screening Phase: When 5 or more factors need evaluation (e.g., pH, solvent composition, temperature, gradient time, detection wavelength), fractional factorial designs provide the most efficient screening approach to identify the vital few factors that significantly impact method performance [34] [33]. A study optimizing an electrochemical sensor for heavy metals successfully employed a fractional factorial design with five factors to identify significant parameters before optimization [32].
Optimization Phase: Once critical factors have been identified (typically 3-4 factors), full factorial designs become more practical and provide complete interaction information necessary for robust method establishment [40] [34]. This is particularly important for methods measuring critical quality attributes of drug substances and products.
Sequential Approach: Many experts recommend a staged strategy: begin with a fractional factorial to screen numerous factors, then perform a full factorial design focused on the significant factors identified in the screening phase [35]. This hybrid approach balances efficiency with comprehensiveness.
Experimental Protocols and Data Analysis
Typical Workflow for Robustness Testing
Implementing either design type follows a consistent experimental workflow, though with different planning and analysis considerations.
Diagram 2: Robustness testing workflow
Protocol for a Full Factorial Robustness Test
Objective: Comprehensively evaluate the robustness of an HPLC method for assay determination by testing 3 factors: pH of mobile phase (Factor A), % organic modifier (Factor B), and column temperature (Factor C).
Experimental Design:
- 2³ full factorial design = 8 experimental runs
- Factor levels: pH (4.5 vs. 5.5), % organic (60% vs. 70%), temperature (25°C vs. 35°C)
- Additional center points (e.g., pH 5.0, 65% organic, 30°C) can be added to detect curvature [38] [34]
- Response variables: retention time, peak area, resolution from closest eluting peak
Execution:
- Prepare mobile phases and standards according to specified factor level combinations
- Randomize run order to minimize systematic bias
- Perform HPLC runs under each condition
- Record all response measurements
Statistical Analysis:
- Perform Analysis of Variance (ANOVA) to identify significant main effects and interactions [37]
- Calculate effect estimates for each factor and interaction
- Construct main effects and interaction plots for visualization
- The statistical model for a 2³ design includes: Y = β₀ + β₁A + β₂B + β₃C + β₁₂AB + β₁₃AC + β₂₃BC + β₁₂₃ABC + ε
Protocol for a Fractional Factorial Screening Study
Objective: Screen 5 factors that may influence an UV-Vis spectroscopic method for impurity quantification using minimal experimental runs.
Experimental Design:
- 2^(5-1) fractional factorial design = 16 runs (half-fraction) [40]
- Resolution V design, which confounds main effects with four-factor interactions and two-factor interactions with three-factor interactions [40]
- Factors may include: dilution solvent, sonication time, wavelength adjustment, cell pathlength, and developer concentration
Execution:
- Establish factor level combinations based on the fractional factorial design matrix
- Randomize experimental run order
- Prepare samples and perform measurements according to the design
- Record absorbance values and calculate impurity percentages
Statistical Analysis:
- Perform ANOVA focusing on main effects and two-factor interactions
- Generate a normal or half-normal probability plot to identify significant effects
- Interpret effects while acknowledging confounding pattern (e.g., two-factor interactions are confounded with three-factor interactions)
Essential Research Reagents and Materials
Robustness testing of organic analytical procedures typically requires standardized materials and reagents. The following table details key items used in these experiments.
Table 3: Essential research reagents and materials for robustness testing
| Item Name | Function/Application | Specification Requirements |
|---|---|---|
| HPLC Grade Solvents | Mobile phase components | Low UV absorbance, high purity to minimize baseline noise [32] |
| Reference Standards | System suitability and quantification | Certified purity, stored under controlled conditions |
| Buffer Components | Mobile phase pH control | Analytical grade, specific pH range appropriate for analyte |
| Chromatographic Columns | Stationary phase for separation | Specified dimensions, particle size, and ligand chemistry |
| Volumetric Glassware | Precise solution preparation | Class A accuracy for volumetric measurements |
| pH Meter | Mobile phase pH verification | Regular calibration with certified buffer standards |
Both full and fractional factorial designs offer distinct advantages for robustness testing in organic analytical procedures. The full factorial design provides comprehensive information about all main effects and interactions, making it ideal for optimization studies when the number of critical factors is manageable (typically ≤4). The fractional factorial design offers significant efficiency for screening larger numbers of factors (typically ≥5), enabling informed risk-based decisions with reduced experimental burden.
The selection between these approaches should be guided by the specific phase of method development, resource constraints, and the criticality of the analytical procedure. A sequential approach that begins with fractional factorial screening followed by full factorial optimization of critical factors often represents the most scientifically sound and resource-effective strategy for establishing robust analytical methods in pharmaceutical development.
Plackett-Burman Designs for Efficient Factor Screening
In the development and validation of organic analytical procedures, particularly within pharmaceutical research, demonstrating a method's robustness is a critical requirement. The International Conference on Harmonisation (ICH) defines robustness as "a measure of its capacity to remain unaffected by small, but deliberate variations in method parameters and provides an indication of its reliability during normal usage" [42] [17]. Robustness testing is performed to evaluate the influence of various method parameters (factors) on the assay responses prior to method transfer to another laboratory. To this end, experimental design (DoE) is systematically applied, with screening designs serving as the primary tool to identify which factors, among many potential candidates, have a significant influence on the method's outputs [11] [17].
The core challenge in the initial stages of method evaluation is that a large number of potential factors (e.g., pH, temperature, mobile phase composition, column type, flow rate) may need investigation. Studying all of them thoroughly with a full factorial approach would be prohibitively time-consuming and expensive. Screening designs address this by allowing researchers to efficiently screen a large number of factors to identify the "vital few" that demand further investigation [43] [44]. Plackett-Burman designs occupy a central role in this screening phase, prized for their exceptional efficiency in studying up to N-1 factors in only N experimental runs, where N is a multiple of 4 [45] [46]. This guide provides an objective comparison of Plackett-Burman designs against other common screening alternatives, supported by experimental data and detailed protocols, to inform their application in robustness testing for organic analytical procedures.
Understanding Plackett-Burman Designs
Core Principles and Historical Context
Plackett-Burman designs are a class of two-level fractional factorial designs developed by statisticians Robin L. Plackett and J.P. Burman in 1946 [47] [46]. Their primary objective is to estimate the main effects of a potentially large set of factors using a minimal number of experimental runs. These designs are predicated on the sparsity-of-effects principle, which assumes that only a few factors are actively influencing the response, and that interactions between factors are negligible or non-existent at the screening stage [44] [46].
A defining feature of these designs is their run economy. A full factorial design for k factors requires 2^k runs. For example, 7 factors need 128 runs, and 11 factors require 2,048 runs. In contrast, a Plackett-Burman design can screen 7 factors in 8 runs, or 11 factors in 12 runs [43] [47]. This efficiency makes them indispensable when experimental runs are costly, time-consuming, or when resources are limited. The number of runs N in a Plackett-Burman design is always a multiple of four (e.g., 8, 12, 16, 20, 24), and it can study up to k = N-1 factors [45] [44].
Key Characteristics and Properties
- Resolution III Design: Plackett-Burman designs are almost exclusively Resolution III designs [44]. This means that while main effects are not confounded with each other, they are confounded with two-factor interactions [45] [33] [44]. In practical terms, if a significant effect is detected for a factor, it is impossible to determine from the Plackett-Burman experiment alone whether it is due to the genuine main effect of that factor, or due to its interaction with another factor, or a combination of both.
- Orthogonality: The designs are orthogonal, meaning the columns of the design matrix are uncorrelated [45]. This property ensures that the main effects can be estimated independently and with maximum precision given the small number of runs. Each factor is evaluated with the same variance, and the design is balanced, with an equal number of high (
+1) and low (-1) levels for each factor across the experimental runs [45] [46]. - Partial Confounding: Unlike some fractional factorial designs where effects are completely confounded (e.g., a main effect is perfectly correlated with a single two-factor interaction), in Plackett-Burman designs, a main effect is partially confounded with many two-factor interactions [44]. For instance, in a 12-run design for 10 factors, the main effect of one factor can be partially confounded with 36 different two-factor interactions [44]. This structure makes it difficult to deconvolute these effects without additional experiments.
The following workflow diagram illustrates the typical placement and logic of applying a Plackett-Burman design within an analytical procedure development context.
Experimental Protocols for Plackett-Burman Designs
Implementing a Plackett-Burman design for robustness testing involves a series of deliberate steps, from selecting factors to analyzing the results. The following protocol, illustrated with a typical High-Performance Liquid Chromatography (HPLC) example, provides a reproducible methodology for researchers.
Step-by-Step Workflow
Step 1: Selection of Factors and Levels The first step is to identify the method parameters (factors) to be investigated. These are typically drawn from the method description and can be quantitative (e.g., pH, temperature) or qualitative (e.g., column manufacturer, reagent batch) [17]. For each quantitative factor, two extreme levels are chosen, symmetrically surrounding the nominal level used in the standard operating procedure. The interval should be slightly larger than the variation expected during method transfer or routine use. For instance, if the nominal pH is 3.0, the levels might be set at 2.8 (
-1) and 3.2 (+1). For a qualitative factor like "HPLC Column," the levels would be the nominal column and an alternative column from a different manufacturer or batch [17].Step 2: Selection of the Experimental Design The appropriate Plackett-Burman design is selected based on the number of factors
f. The number of runsNis the smallest multiple of 4 that is greater thanf+1. For example, to studyf=8factors, a design withN=12runs is required, which allows for the estimation of 11 effects (the 8 factors plus 3 dummy factors used for error estimation) [45] [17]. The design matrix is then generated, often using statistical software like Minitab or JMP.Step 3: Selection of Responses The responses measured should reflect both the quantitative performance and the system suitability of the analytical method. Assay responses (e.g., percent recovery of the active ingredient, impurity level) are critical for judging robustness. A method is considered robust if no significant effects are found on these responses. System Suitability Test (SST) responses (e.g., resolution between critical peak pairs, retention time, peak asymmetry) are also monitored, as significant effects on these may require the definition of operational control limits [17].
Step 4: Experimental Execution and Protocol Experiments should be executed in a randomized sequence to minimize the impact of uncontrolled, time-related variables (e.g., instrument drift, reagent degradation) [17]. If a time-dependent drift is suspected, one can either use an "anti-drift" sequence that confounds the time effect with dummy factors or incorporate replicated nominal experiments at regular intervals to model and correct for the drift [17]. In the HPLC example, for each of the 12 design runs, a blank, a reference solution, and a sample solution representing the formulation are typically measured [17].
Step 5: Estimation of Factor Effects The effect
Exof a factorXon a responseYis calculated as the difference between the average response whenXis at its high level (+1) and the average response whenXis at its low level (-1) [17].Ex = (ΣY(X=+1) / N(+1)) - (ΣY(X=-1) / N(-1))whereN(+1)andN(-1)are the number of runs where the factor is at the high and low level, respectively.Step 6: Graphical and Statistical Analysis The importance of the calculated effects is judged through both graphical and statistical means. A Half-Normal probability plot is a common graphical tool where insignificant effects tend to cluster near zero, forming a straight line, while significant effects deviate from this line [43] [47]. Statistically, effects can be compared to a critical effect value. This critical value can be derived from the standard error of the effects, often estimated from dummy factors or from an algorithm like that of Dong [17]. Alternatively, a t-test can be performed on each effect. Given the screening nature, a higher significance level (e.g.,
α = 0.10) is often used to reduce the risk of overlooking an important factor (Type II error) [44].
The Researcher's Toolkit: Essential Materials for a Robustness Test
The table below details key reagents, materials, and instruments typically required for executing a robustness test on an HPLC method, as derived from the cited case studies.
Table 1: Essential Research Reagent Solutions and Materials for an HPLC Robustness Test
| Item | Function & Application in Robustness Testing |
|---|---|
| Analytical Standards (e.g., Active Pharmaceutical Ingredient (API), related compounds) | Used to prepare reference and sample solutions for quantifying method responses like percent recovery and resolution. Their purity is critical for accurate effect estimation [17]. |
| HPLC Columns (from different manufacturers or batches) | A common qualitative factor. Testing different columns evaluates the method's sensitivity to variations in stationary phase chemistry, a frequent source of transfer failure [17]. |
| Buffer Components & pH Adjusters (e.g., salts, acids, bases) | Used to prepare mobile phases. Variations in their concentration or the final pH are key quantitative factors that can profoundly impact retention time, selectivity, and peak shape [42] [17]. |
| HPLC-Grade Organic Solvents | The organic modifier (e.g., acetonitrile, methanol) in the mobile phase is a mixture-related factor. Its percentage is a critical parameter often included in robustness tests [17]. |
| HPLC System with UV/Vis Detector | The core instrument for executing the experiments. Factors like detection wavelength, column temperature, and flow rate can be deliberately varied as part of the design [42] [17]. |
Performance Comparison with Other Screening Methods
While Plackett-Burman designs are powerful, selecting the right screening design requires a clear understanding of their performance relative to alternatives like Full Factorial and Supersaturated designs. The following comparison is based on data from direct pharmaceutical applications.
Head-to-Head Design Comparison
Table 2: Objective Comparison of Plackett-Burman and Alternative Screening Designs
| Feature | Plackett-Burman Designs | Full Factorial Designs | Supersaturated Designs |
|---|---|---|---|
| Primary Goal | Screen many factors to identify the "vital few" significant main effects [43] [46]. | Characterize all main effects and interactions for a small number of factors. | Screen an extremely large number of factors (f > N-1) when runs are exceptionally limited [42] [48]. |
| Number of Runs (N) | Multiple of 4 (e.g., 12, 20, 24) [45] [44]. | A power of 2 (e.g., 8, 16, 32) [33]. | N can be less than f+1 (e.g., 6 runs for 10 factors) [42]. |
| Confounding / Aliasing | Resolution III. Main effects are unconfounded with each other but are confounded with two-factor interactions [45] [44]. | No confounding; all effects can be estimated independently. | Severe confounding; main effects are confounded with each other, requiring specialized analysis (e.g., FEAR method) [42] [48]. |
| Ability to Estimate Interactions | No. The assumption is that interactions are negligible [44] [47]. | Yes, all interactions can be estimated. | No. |
| Best Use Case | Initial screening when the number of factors is moderate to high (e.g., 5-19) and interactions are assumed to be small [44] [46]. | In-depth study when the number of factors is small (e.g., ≤ 5) and interaction information is required. | Extreme screening when the number of potential factors vastly exceeds the feasible number of runs [42]. |
Supporting Experimental Data from Pharmaceutical Research
A direct comparative study provides empirical data on the performance of these designs. The study validated a Flow Injection Analysis (FIA) assay for L-N-monomethylarginine (LNMMA) and performed robustness testing using different designs [42] [48].
- Experimental Setup: The robustness of the FIA method was tested against six factors. The tests were performed using:
- A 12-run Plackett-Burman design (PB1, examining 11 factors).
- An 8-run Plackett-Burman design (PB2, examining 7 factors).
- Several 6-run Supersaturated designs (SS, examining 10 factors) [42].
- Key Findings and Comparison:
- Factor Identification: All designs (PB12, PB8, and SS) successfully identified the same most important effects for the quantitative response (% recovery of LNMMA), leading to the same conclusion that the method was robust [42] [48].
- Effect Estimation: The estimated factor effects and critical effects were found to be comparable across all designs. However, the study noted "some indications that some effects from the supersaturated designs tend to be overestimated" [42] [48]. This highlights a key risk of supersaturated designs: the potential for biased effect estimates due to severe confounding.
- Practical Conclusion: The research concluded that by reducing the number of experiments from 12 to 8 or even 6, similar effects were estimated and considered (non-)significant for the purpose of this robustness test. This demonstrates that a smaller Plackett-Burman or even a supersaturated design can be a viable, resource-saving alternative, provided the results are interpreted with an understanding of their limitations [42].
Another case study comparing a full factorial design (32 runs) to a Plackett-Burman design (12 runs) for a five-factor experiment found that both designs identified the same three factors (B, C, D) as significant and recommended the same optimal factor settings for maximizing the response [47]. This reinforces that Plackett-Burman designs can correctly identify active main effects with a fraction of the experimental effort.
Analysis and Decision Framework
The choice of an appropriate screening design is not one-size-fits-all. The following diagram and discussion provide a synthesizing framework to guide researchers in selecting and proceeding with a Plackett-Burman design.
When to Select a Plackett-Burman Design
The decision pathway in the diagram leads to a Plackett-Burman design under these conditions:
- The number of potential factors is greater than about five, making a full factorial impractical [47].
- The primary goal is to screen for main effects.
- The researcher can reasonably assume that two-factor interactions are negligible or weak at this stage of experimentation [44] [46].
- The run economy of a Plackett-Burman design (
Na multiple of 4) is superior to a comparable Resolution III fractional factorial design (Na power of 2) for the specific number of factors. For instance, for 6-7 factors, an 8-run Plackett-Burman is available, while a fractional factorial requires 8 runs. For 9-11 factors, a 12-run Plackett-Burman fits perfectly between the 8-run and 16-run fractional factorial options [44].
Limitations and Path Forward After Screening
The most significant limitation of Plackett-Burman designs is the confounding of main effects with two-factor interactions. If a significant effect is found, it is ambiguous. Subject-matter expertise is required to judge whether it is a true main effect or the result of a strong interaction [44]. If interactions are suspected to be present, the design can be augmented with additional experimental runs (e.g., a "foldover" design) to break the aliasing between main effects and two-factor interactions [44].
The ultimate value of a Plackett-Burman design lies in its projection property. If, after analysis, only a few factors are found to be significant, the design often projects into a full factorial design in those factors, effectively eliminating the confounding issue for the vital few and providing clear guidance for the next step [44]. The identified critical factors then become the focus of more detailed, optimization-oriented experiments, such as Response Surface Methodology (RSM) designs, to precisely model the relationship between factors and responses and locate the true optimum method conditions [46].
Plackett-Burman designs represent a powerful, efficient, and statistically rigorous tool for the initial screening of factors in the robustness testing of organic analytical procedures. Their unparalleled economy in experimental runs allows pharmaceutical researchers and drug development professionals to quickly and objectively identify the "vital few" method parameters that significantly influence analytical outcomes from a "trivial many" potential variables.
As demonstrated through comparative studies and experimental data, these designs reliably identify significant main effects with a fraction of the resources required by full factorial designs, while providing a more structured and analyzable framework than supersaturated designs. The key to their successful application lies in recognizing their fundamental assumption: that interaction effects are negligible during the screening phase. When this holds true, Plackett-Burman designs are an indispensable component of the modern analytical scientist's toolkit, ensuring that subsequent, more resource-intensive optimization studies are focused, efficient, and ultimately lead to more robust and reliable analytical methods fit for their intended use in pharmaceutical development and quality control.
Robustness is formally defined as "a measure of its capacity to remain unaffected by small, but deliberate variations in method parameters and provides an indication of its reliability during normal usage" [17] [49]. This concept is a critical component of analytical procedure validation, particularly in the pharmaceutical industry where method reliability directly impacts product quality and patient safety [5] [18]. The primary objective of robustness testing is to identify method parameters that are most sensitive to variation and to establish permissible ranges for these parameters to ensure method reliability during routine use and transfer between laboratories [17] [5].
It is essential to distinguish between robustness and ruggedness, though these terms are often used interchangeably. Robustness testing specifically examines the effects of small, deliberate variations in method parameters under controlled, intra-laboratory conditions [5]. These variations might include changes to mobile phase pH, column temperature, or flow rate in chromatographic methods [17] [5]. In contrast, ruggedness testing assesses the reproducibility of analytical results under real-world conditions, such as different laboratories, analysts, instruments, or days [5]. While robustness testing occurs during method development or early validation stages, ruggedness testing typically happens later, often before method transfer between facilities [5].
The evaluation of robustness has evolved from being a final validation step to an integral part of method development and optimization [17] [49]. This paradigm shift, encouraged by regulatory bodies like the International Conference on Harmonisation (ICH), helps prevent the costly scenario where a method is found to be non-robust after extensive validation, requiring redevelopment [17] [49]. Modern approaches, such as Analytical Quality by Design (AQbD), further embed robustness testing throughout the analytical procedure lifecycle, promoting a systematic, risk-based understanding of method parameters and their effects on performance [9].
Key Method Parameters and Experimental Design Selection
Critical Parameters in Robustness Testing
The first step in designing a robustness study involves selecting relevant method parameters (factors) to evaluate. These parameters are typically derived from the analytical method's operational procedure and can be categorized as operational or environmental factors [49]. For chromatographic methods, commonly tested parameters include:
- Mobile phase composition: Variations in the ratio of organic to aqueous solvents [17] [5]
- pH of the mobile phase: Small, deliberate changes in buffer pH [17] [5]
- Flow rate: Minor adjustments to the mobile phase flow rate [17] [5] [50]
- Column temperature: Fluctuations in the temperature of the chromatographic column [17] [5] [50]
- Detection wavelength: Slight variations in the detection wavelength [17]
- Different columns or reagent batches: Comparison of different columns (e.g., from alternative manufacturers or different lots) and reagent batches [17] [5]
When selecting parameters and their levels (the specific values to be tested), the variations should be "small but deliberate" and representative of changes that might reasonably occur during routine method use or transfer [17] [49]. For quantitative factors, symmetric intervals around the nominal value are typically chosen (e.g., nominal level ± a small variation) [17]. However, there are exceptions; for instance, when the nominal value is at an optimum (such as maximum absorbance wavelength), asymmetric intervals may provide more meaningful information [17].
Selection of Experimental Designs
A key advancement in robustness testing has been the shift from One-Factor-at-a-Time (OFAT) approaches to more efficient and informative Design of Experiments (DoE) methodologies [51] [9]. While OFAT is simpler, it generates limited data and cannot detect interactions between factors [9]. In contrast, DoE approaches allow for the simultaneous evaluation of multiple parameters and their potential interactions using a minimal number of experiments [17] [51].
The choice of experimental design depends primarily on the number of factors being investigated. Commonly used screening designs include:
- Plackett-Burman (PB) Designs: These efficient designs require a number of experiments that is a multiple of four (N) and can evaluate up to N-1 factors [17] [49]. They are particularly useful when studying a relatively large number of factors with limited experimental resources.
- Fractional Factorial (FF) Designs: These designs, where the number of experiments is a power of two, allow for the estimation of main effects and some interaction effects [17] [49]. They provide more information than PB designs but require more experiments.
Table 1: Comparison of Common Experimental Designs for Robustness Testing
| Design Type | Number of Experiments | Factors Evaluated | Interactions Detectable? | Best Use Case |
|---|---|---|---|---|
| Full Factorial | 2^k (where k = factors) | All k factors | Yes, all interactions | Small number of factors (typically <5) |
| Fractional Factorial | 2^(k-p) | All k factors | Yes, some interactions | Moderate number of factors with resource constraints |
| Plackett-Burman | Multiple of 4 (N) | Up to N-1 factors | No, main effects only | Screening large number of factors efficiently |
The selection between these designs involves a trade-off between experimental effort and information gained. For initial screening of many factors, Plackett-Burman designs are often preferred, while fractional factorial designs provide more detailed information when resources permit [17].
Experimental Protocols and Data Analysis
Step-by-Step Experimental Protocol
Implementing a robustness study requires careful planning and execution. The following workflow outlines the key stages:
Diagram 1: Robustness Testing Workflow
Factor and Level Selection: Based on the analytical method, select factors to investigate and define appropriate levels for each factor [17] [49]. The intervals should be slightly larger than expected variations during routine use or method transfer [49].
Experimental Design Selection: Choose an appropriate experimental design based on the number of factors and available resources [17] [49]. For most robustness studies, fractional factorial or Plackett-Burman designs provide sufficient information.
Experimental Protocol Definition: Determine the sequence of experiments. Randomization is generally recommended to minimize the effects of uncontrolled variables [17]. However, when practical constraints exist (e.g., changing a chromatographic column is time-consuming), experiments may be blocked by such factors [17] [49].
Solution Preparation and Analysis: Prepare aliquots of the same test sample and reference standards to be examined under all experimental conditions [17] [49]. This ensures that observed variations are due to the parameter changes rather than sample preparation differences.
Response Measurement: Measure relevant responses for each experiment. These typically include both assay responses (e.g., content determinations, peak areas) and system suitability test (SST) responses (e.g., resolution, retention times, peak asymmetry) [17] [49].
Data Analysis and Interpretation
Once experimental data is collected, the effect of each factor on the measured responses is calculated. The effect of a factor (E_X) is determined using the formula:
E_X = [ΣY(+)/N(+)] - [ΣY(-)/N(-)]
where ΣY(+) and ΣY(-) are the sums of the responses when factor X is at its high and low levels, respectively, and N(+) and N(-) are the number of experiments at those levels [17] [49].
The statistical and practical significance of these effects must then be evaluated. Several approaches can be used:
- Graphical Analysis: Normal probability plots or half-normal probability plots can visually identify significant effects that deviate from a straight line formed by non-significant effects [17].
- Statistical Significance Testing: For designs with dummy factors (e.g., Plackett-Burman) or interactions that can be considered negligible, these effects provide an estimate of experimental error against which to test factor effects [17].
- Comparison to Critical Effect: Algorithms, such as the Dong algorithm, can establish critical values for effect significance based on the variability of the data [17].
Table 2: Example Effects Table from an HPLC Robustness Study
| Factor | Effect on % Recovery | Effect on Resolution | Statistically Significant? |
|---|---|---|---|
| Mobile Phase pH | -0.25 | 0.85 | Yes (Resolution only) |
| Flow Rate | 0.12 | -0.38 | No |
| Column Temperature | 0.31 | 0.18 | No |
| Organic Modifier % | -0.42 | 1.12 | Yes (Both responses) |
| Dummy Factor 1 | 0.08 | -0.11 | No (Used for error estimation) |
A method is considered robust for a particular response when no statistically significant effects are found, or when significant effects are small enough not to adversely affect method performance [17]. If critical factors are identified, the method may need optimization, or tighter controls may need to be implemented for those parameters during routine use [17] [18].
Advanced Applications and Regulatory Considerations
Establishing System Suitability Test (SST) Limits
A valuable outcome of robustness testing is the ability to establish scientifically justified System Suitability Test (SST) limits [17] [49]. Regulatory guidelines, including those from ICH, recommend that "one consequence of the evaluation of robustness should be that a series of system suitability parameters (e.g., resolution tests) is established to ensure that the validity of the analytical procedure is maintained whenever used" [49].
By understanding how method parameters affect critical resolution values, for example, evidence-based SST limits can be defined rather than setting arbitrary values based solely on analyst experience [17]. If a robustness study demonstrates that resolution between two critical peaks remains above 2.5 under all tested variations, this value can be confidently established as the SST limit, providing assurance that the method will perform adequately during routine use [17].
Analytical Quality by Design (AQbD) and Design Space
The pharmaceutical industry is increasingly adopting Analytical Quality by Design (AQbD) principles, which align with the enhanced approach for analytical procedure development described in ICH Q14 and Q2(R2) guidelines [9] [52]. AQbD emphasizes a systematic, risk-based approach to analytical method development that builds robustness directly into methods [9].
A key concept in AQbD is the establishment of a Method Operable Design Region (MODR), defined as the "multidimensional region where all study factors in combination provide suitable mean performance and robustness, ensuring procedure fitness for use" [9]. This is analogous to the "Design Space" concept in ICH Q8 for pharmaceutical development [9]. Working within the MODR offers regulatory flexibility, as changes to method parameters within this established space generally do not require revalidation [9].
Diagram 2: AQbD Methodology for Robust Methods
The Scientist's Toolkit: Essential Research Reagent Solutions
Implementing effective robustness studies requires specific materials and approaches. The following table outlines key solutions and their functions in robustness testing:
Table 3: Essential Research Reagent Solutions for Robustness Testing
| Reagent/Material | Function in Robustness Testing | Application Notes |
|---|---|---|
| Reference Standards | Evaluate method performance across parameter variations; ensure consistent response measurements [51] | Select a representative standard that can be used across different projects for consistency [51] |
| Different Column Batches | Assess method performance with different stationary phases; identify critical column parameters [17] [5] | Include columns from different manufacturers or lots to evaluate this common source of variability |
| Buffer Solutions with Varied pH | Test method sensitivity to mobile phase pH variations [17] [5] | Prepare buffers at nominal pH ± 0.1-0.2 units to simulate realistic variations |
| Mobile Phases with Varied Composition | Evaluate effects of organic modifier concentration changes [17] [5] | Adjust organic:aqueous ratios by ±1-2% to test robustness to preparation variability |
| System Suitability Test Mixtures | Verify method performance under different parameter settings [17] [49] | Use mixtures containing all critical analytes to monitor resolution, efficiency, and other SST parameters |
Robustness testing represents a critical investment in method reliability, data integrity, and regulatory compliance. By systematically evaluating how method parameters affect performance, scientists can develop more reliable analytical procedures, establish scientifically justified control limits, and minimize the risk of method failure during routine use or transfer.
The evolution from traditional OFAT approaches to structured DoE methodologies, combined with the growing adoption of AQbD principles, has transformed robustness testing from a regulatory checkbox to a fundamental component of robust analytical method development. When properly designed and executed, robustness studies not only fulfill regulatory requirements but also provide deep methodological understanding that enhances confidence in analytical results and facilitates effective method lifecycle management.
As regulatory guidance continues to evolve with ICH Q14 and Q2(R2), the emphasis on science-based, risk-informed approaches to analytical procedure development will likely increase, making robustness testing an even more essential competency for analytical scientists in pharmaceutical development and beyond.
Within the framework of a broader thesis on robustness testing for organic analytical procedures, the comparative evaluation of assay performance and system suitability parameters (SSPs) is a cornerstone of method validation and transfer [53]. This guide provides an objective comparison of key analytical responses, focusing on a "total error" approach that combines accuracy (bias) and precision, as recommended for method transfer and bridging studies [53]. Supporting experimental data and protocols are detailed to aid researchers, scientists, and drug development professionals in implementing rigorous comparative analyses [54].
Comparative Performance Data
The following tables summarize quantitative data from comparative analyses of two hypothetical analytical procedures (Procedure A: Existing Method, Procedure B: New/Transferred Method). The evaluation is based on a total error approach with an allowable out-of-specification (OOS) rate set at 5% [53].
Table 1: Comparison of Accuracy and Precision Profiles
| Parameter | Procedure A | Procedure B | Acceptance Criteria | Outcome |
|---|---|---|---|---|
| Mean Assay Result (%) | 99.5 | 100.2 | 98.0 - 102.0% | Pass |
| Bias (%) | -0.5 | +0.2 | ±2.0% | Pass |
| Repeatability (RSD%, n=6) | 0.8 | 0.6 | ≤1.5% | Pass |
| Intermediate Precision (RSD%) | 1.5 | 1.2 | ≤2.0% | Pass |
| Total Error (95% CI) | ±2.3% | ±1.9% | ±4.0% | Pass |
Table 2: System Suitability Parameters (SSP) Comparison
| System Suitability Parameter | Procedure A Result | Procedure B Result | Typical Specification | Comparative Outcome |
|---|---|---|---|---|
| Theoretical Plates | 8500 | 9200 | >5000 | B demonstrates higher efficiency |
| Tailing Factor | 1.05 | 1.02 | ≤1.2 | Both pass, B shows superior peak symmetry |
| Resolution from Critical Pair | 2.5 | 3.1 | >2.0 | Both pass, B provides greater separation |
| %RSD of Replicate Standard Injections | 0.5% | 0.3% | ≤1.0% | Both pass, B shows better injection precision |
Detailed Experimental Protocols
Protocol 1: Method Comparison for Accuracy and Precision (Total Error Approach)
This protocol is designed for a method transfer scenario, comparing an existing procedure (A) with a new one (B) [53].
- Objective & Scope: To demonstrate the receiving laboratory's capability to obtain results comparable to the sending laboratory's using a predefined acceptance criterion based on total error [54] [53].
- Experimental Design: A nested design with two analysts, each performing three independent sample preparations on three different days. This allows estimation of repeatability and intermediate precision [53].
- Sample & Standards: A homogeneous batch of validation material (e.g., drug product) is used. Prepare standard solutions at 100% target concentration from USP reference standards [54].
- Data Collection:
- Each analyst prepares six sample solutions from the validation batch per procedure.
- The analytical sequence includes system suitability tests, calibration standards, and the prepared samples in a randomized order to avoid bias.
- Record individual assay results for all samples [54].
- Data Analysis:
- Calculate mean, bias, repeatability (within-analyst variance), and intermediate precision (combined within- and between-analyst variance).
- Compute the 95% confidence interval for total error (bias + 2 * standard deviation of intermediate precision).
- Compare the total error interval to the predefined acceptance limit (e.g., ±4.0%). The method is considered comparable if the interval falls entirely within the limit [53].
Protocol 2: System Suitability Testing Workflow
System suitability tests verify that the total analytical system is functioning adequately at the time of testing.
- Preparation: Prepare the system suitability solution as per the method, typically containing the analyte and any critical impurities or degradation products to assess resolution.
- Injection Sequence: Perform a minimum of six replicate injections of the system suitability solution.
- Parameter Calculation: From the resulting chromatograms, calculate the key parameters listed in Table 2: theoretical plates, tailing factor, resolution, and %RSD of the analyte peak area/retention time.
- Acceptance Decision: Compare calculated values against method-specific specifications. The analysis batch may only proceed if all SSP criteria are met.
Visualization of Key Method Comparison Pathways
Diagram 1: Total Error Method Comparison Workflow
Diagram 2: System Suitability Parameter Monitoring Logic
The Scientist's Toolkit: Key Research Reagent Solutions
| Item | Function in Comparative Analysis |
|---|---|
| USP Reference Standard | Provides the primary benchmark for identity, assay, and purity; essential for calibrating the analytical system and calculating bias [53]. |
| System Suitability Test Mix | A solution containing analyte and critical separands; used to verify chromatographic resolution, efficiency, and precision before sample analysis. |
| Validation Material (Homogeneous Batch) | A well-characterized, stable batch of drug substance or product used as the test sample throughout the comparison study to ensure consistency [54]. |
| Internal Standard | A compound added in constant amount to samples and standards; used in chromatographic methods to correct for variability in injection volume and sample preparation. |
| High-Purity Solvents & Reagents | Ensure minimal background interference and consistent mobile phase/solution preparation, crucial for achieving reproducible retention times and baseline stability. |
| Specified Chromatographic Column | The exact column (brand, dimensions, particle size, ligand chemistry) prescribed in the method; critical for reproducing separation characteristics and SSPs [53]. |
| Certified Volumetric Glassware/Pipettes | Ensure accurate and precise measurement of sample and standard solutions, directly impacting the accuracy and precision results of the study [54]. |
In the realm of analytical chemistry, particularly for organic analytical procedures in drug development, the robustness of a method is defined as a measure of its capacity to remain unaffected by small, deliberate variations in method parameters [1] [5]. It provides an indication of the method's reliability during normal usage and is an essential component of the method validation protocol. Investigating robustness is a critical, proactive exercise; a method that performs perfectly under ideal, tightly controlled conditions may fail when subjected to the minor, unavoidable variations of a real-world laboratory environment [5]. For researchers and scientists, mastering the calculation and statistical interpretation of effects from robustness studies is paramount for developing reliable, reproducible, and defensible analytical methods.
This evaluation aligns with the broader principles of Analytical Procedure Lifecycle Management (APLM), which emphasizes a systematic, knowledge-based approach to method development, validation, and continuous verification [55]. Robustness testing is a cornerstone of the "Procedure Performance Qualification" stage, ensuring that the method is rugged and will perform consistently in a quality control environment. The International Council for Harmonisation (ICH) and the United States Pharmacopeia (USP) both recognize robustness as a key validation characteristic, underscoring its importance in regulatory compliance [1] [56].
Core Concepts and Experimental Design
Robustness vs. Ruggedness
A fundamental distinction must be made between robustness and ruggedness, as these terms are often confused:
- Robustness: An intra-laboratory study that focuses on the resilience of the method to small, planned changes in internal, method-defined parameters (e.g., mobile phase pH, flow rate, column temperature) [1] [5]. It is typically conducted during the method development and validation stages.
- Ruggedness: An assessment of the method's reproducibility under real-world, inter-laboratory conditions. It involves broader variations such as different analysts, instruments, reagents, and laboratories, and is often evaluated later in the validation process, especially before method transfer [1] [5].
For the purpose of this guide, we focus on the experimental design and interpretation specific to robustness testing.
Designing a Robustness Study: Screening Designs
The traditional univariate approach (changing one variable at a time) is inefficient and can fail to detect interactions between variables. Consequently, multivariate screening designs are the most recommended and efficient tools for robustness testing [11] [1]. These designs allow for the simultaneous evaluation of multiple factors with a minimal number of experimental runs.
The three most common types of screening designs are:
- Full Factorial Designs: In a full factorial experiment, all possible combinations of factors at their high and low levels are measured. For
kfactors, this requires2^kruns. While this design provides the most complete data, including all interaction effects, it becomes impractical for a large number of factors (e.g., 7 factors would require 128 runs) [1]. - Fractional Factorial Designs: These designs are a carefully chosen fraction (e.g., 1/2, 1/4) of the full factorial design. They are highly efficient for investigating a larger number of factors but at a cost: some effects are "aliased" or "confounded," meaning they cannot be estimated independently. The success of this design relies on the "scarcity of effects principle," which posits that while many factors may be investigated, only a few are likely to be critically important [1].
- Plackett-Burman Designs: These are highly economical screening designs where the number of experimental runs is a multiple of four (e.g., 12, 20, 24). They are exceptionally efficient for identifying which main effects (individual factors) are significant when the goal is to screen many factors quickly. Plackett-Burman designs are not suitable for estimating interaction effects between factors, but they are ideal for determining whether a method is robust to many changes [11] [1].
Table 1: Comparison of Common Screening Experimental Designs for Robustness Testing
| Design Type | Number of Runs for k Factors | Key Advantages | Key Limitations | Ideal Use Case |
|---|---|---|---|---|
| Full Factorial | 2^k (e.g., 4 factors = 16 runs) |
Estimates all main effects and interaction effects with no confounding. | Number of runs becomes prohibitively large with many factors. | Methods with a small number (≤ 5) of critical factors. |
| Fractional Factorial | 2^(k-p) (e.g., 7 factors in 16 runs) |
Highly efficient for studying many factors; can estimate some interactions. | Effects are aliased (confounded), requiring careful design and interpretation. | Screening a moderate number of factors where some interactions may be relevant. |
| Plackett-Burman | Multiple of 4 > k (e.g., 11 factors in 12 runs) | Maximum efficiency for screening a large number of factors with minimal runs. | Cannot estimate interactions between factors. | Initial screening of many factors to identify the few critical ones. |
Workflow for a Robustness Study
The following diagram outlines the logical workflow for planning, executing, and interpreting a robustness study.
Diagram Title: Robustness Study Workflow
Calculating Effects and Statistical Interpretation
Data Analysis for a Two-Level Factorial Design
The primary goal of analyzing data from a robustness study is to calculate the effect of each factor on the chosen response variable and determine whether that effect is statistically significant.
The effect of a factor is calculated as the average change in the response when the factor is moved from its low level to its high level. It is given by the formula:
Effect (E) = (Mean of Responses at High Level) - (Mean of Responses at Low Level)
A large positive or negative effect indicates that the factor has a substantial influence on the method's performance. A effect near zero suggests the method is robust to variations in that parameter within the studied range [11] [1].
Statistical Significance and Interpretation
To move from a simple calculation of effects to a statistical interpretation, several tools are used:
- Half-Normal Probability Plots: This is a graphical technique for identifying significant effects. The absolute values of the calculated effects are plotted against their cumulative normal probabilities. Insignificant effects, which are normally distributed around zero, will fall along a straight line near the origin. Significant effects will deviate markedly from this line, appearing as outliers [1].
- Analysis of Variance (ANOVA): ANOVA is a statistical method used to compare the variances due to the different factors against the variance due to experimental error. It provides a more formal test of significance, typically resulting in a p-value for each effect. A p-value below a chosen significance level (e.g., α = 0.05) indicates that the effect is statistically significant [11].
- Regression Modeling: The results from a factorial design can be used to construct a linear regression model. This model quantifies the relationship between the factors and the response, allowing for prediction of method performance within the experimental domain. The model can be represented as:
Y = β₀ + β₁X₁ + β₂X₂ + ... + β₁₂X₁X₂ + ... + εwhere Y is the response, β₀ is the intercept, β₁, β₂ are the main effects, β₁₂ is an interaction effect, and ε is the error term.
Table 2: Example Data Table from a Hypothetical HPLC Robustness Study (Plackett-Burman, 7 Factors in 12 Runs)
| Run | pH (A) | %Organic (B) | Flow Rate (C) | Temp (D) | Response: Retention Time (min) |
|---|---|---|---|---|---|
| 1 | -1 (3.0) | +1 (52%) | -1 (0.9) | +1 (35°C) | 4.52 |
| 2 | +1 (3.2) | -1 (48%) | -1 | -1 (25°C) | 5.10 |
| 3 | -1 | +1 | +1 (1.1) | -1 | 3.95 |
| 4 | +1 | +1 | -1 | +1 | 4.48 |
| 5 | +1 | -1 | +1 | -1 | 4.82 |
| 6 | +1 | -1 | -1 | +1 | 5.25 |
| 7 | -1 | +1 | +1 | +1 | 3.80 |
| 8 | -1 | -1 | +1 | +1 | 4.65 |
| 9 | -1 | -1 | -1 | -1 | 5.40 |
| 10 | +1 | +1 | +1 | +1 | 4.15 |
| 11 | +1 | +1 | -1 | -1 | 4.90 |
| 12 | -1 | -1 | -1 | +1 | 5.18 |
| Effect Calculation | -0.42 | -0.25 | +0.18 | -0.08 |
Note: The table shows a subset of factors and runs for illustration. The calculated effects for each factor on retention time are provided at the bottom.
Case Study: Robustness in an HPLC Method for Mesalamine
A 2025 study on the development of a stability-indicating RP-HPLC method for Mesalamine provides a concrete example of robustness evaluation [56]. In this study, the authors deliberately introduced slight variations in method parameters, including:
- Mobile phase composition (± 2%)
- Flow rate (± 0.05 mL/min)
- Detection wavelength (± 2 nm)
The quantitative measure of robustness was the relative standard deviation (%RSD) of the peak area and retention time of Mesalamine across these varied conditions. The authors reported that the %RSD for both parameters was found to be less than 2% under all deliberately modified conditions. This low %RSD led to the conclusion that the proposed method was robust, meaning it would likely provide reliable results despite minor, expected fluctuations in the operational parameters of a quality control laboratory [56].
The Scientist's Toolkit: Essential Reagents and Materials
The following table details key materials and solutions commonly required for executing robustness studies, particularly for chromatographic methods.
Table 3: Key Research Reagent Solutions for Robustness Testing
| Item | Function / Role in Robustness Testing |
|---|---|
| HPLC-Grade Solvents | High-purity solvents (e.g., methanol, acetonitrile, water) used as mobile phase components. Small variations in their proportion are a common factor tested in robustness studies. [56] |
| Buffer Salts & pH Adjusters | Chemicals (e.g., potassium phosphate, ammonium acetate) used to prepare mobile phase buffers. The pH and concentration of the buffer are critical factors often investigated for their effect on chromatographic separation. [1] |
| Pharmaceutical Reference Standards | Highly characterized samples of the Active Pharmaceutical Ingredient (API) with known purity. Essential for preparing calibration standards and for accuracy/recovery experiments during method validation, which underpin robustness assessment. [56] |
| Chromatographic Columns | Columns from different manufacturers or different lots from the same manufacturer. Testing column-to-column variability is a fundamental part of establishing method ruggedness and robustness. [1] [5] |
| Chemical Stress Agents | Reagents like hydrochloric acid (HCl), sodium hydroxide (NaOH), and hydrogen peroxide (H₂O₂). Used in forced degradation studies to demonstrate the stability-indicating property and specificity of the method, which is related to its overall robustness. [56] |
Robustness testing, through carefully designed experiments and rigorous statistical interpretation, is not merely a regulatory checkbox but a strategic investment in quality and efficiency. By employing fractional factorial or Plackett-Burman designs, researchers can systematically identify critical method parameters and define appropriate control limits. The statistical interpretation of effects—whether through graphical methods like half-normal plots or quantitative measures like %RSD—provides a scientific basis for concluding that a method is fit for its intended purpose. A thoroughly tested, robust method reduces the frequency of out-of-specification results and costly investigations, thereby ensuring the consistent production of reliable data that is crucial for drug development and patient safety.
Establishing Method Operable Design Region (MODR)
Within the rigorous framework of modern pharmaceutical analysis, robustness is not merely an afterthought but a foundational quality attribute integrated during method development. The Method Operable Design Region (MODR) represents a paradigm shift from fixed-point methods to a flexible, scientifically grounded operational space [57] [58]. Defined as the multidimensional combination and interaction of critical method parameter (CMP) ranges within which the method performs reliably and meets all predefined critical method attribute (CMA) criteria, the MODR is central to the Analytical Quality by Design (AQbD) philosophy [59] [60]. For researchers and drug development professionals, establishing a MODR transcends traditional robustness testing—it builds inherent resilience into analytical procedures, ensuring consistent quality control and regulatory flexibility throughout a product's lifecycle [57] [58]. This guide compares the principal methodologies for MODR establishment, providing a detailed examination of their experimental protocols, outputs, and applications within organic analytical procedure research.
Comparative Analysis of MODR Establishment Methodologies
The evolution from traditional univariate development to enhanced, multivariate approaches has diversified the toolkit for defining a MODR. The table below compares four foundational methodologies.
Table 1: Comparison of Methodologies for Establishing MODR
| Methodology | Core Principle | Key Tools/Techniques | Primary Output | Typical Experimental Scope | Regulatory & Practical Flexibility |
|---|---|---|---|---|---|
| Traditional OFAT with Post-Development Robustness Testing [61] [1] | Sequential optimization of single factors followed by verification of robustness at fixed conditions. | One-factor-at-a-time (OFAT) variation; univariate robustness checks. | A single set of optimized conditions with documented tolerance to small, deliberate variations. | Limited, focused on verifying a predefined set point. Low flexibility; any change may require re-validation. | |
| AQbD with Empirical DoE and Monte Carlo Simulation [59] [58] | Systematic, risk-based multivariate study of CMPs to model their effect on CMAs and probabilistically define a robust region. | Risk Assessment (e.g., Ishikawa), Screening & Optimization DoE (e.g., CCD, Box-Behnken), Monte Carlo Simulation. | A probabilistic MODR (e.g., with 95% confidence) defining operable ranges for multiple CMPs simultaneously [59]. | Comprehensive, requires initial DoE runs (e.g., 20-30 experiments) but yields deep method understanding. | High flexibility within the MODR; changes within the region are not considered a method alteration per ICH Q14 [57] [60]. |
| Virtual MODR Assessment via DoE-QSRR Modeling [60] | In silico prediction of chromatographic behavior using quantitative structure-retention relationships (QSRR) built from experimental DoE data. | DoE-QSRR integrated modeling, molecular descriptor calculation, virtual DoE simulations. | A virtual MODR predicted for new analytes or conditions, guiding experimental work. | Reduces initial lab experiments; requires a foundational dataset to build the predictive model. | Facilitates rapid scoping and development for structurally related compounds, enhancing efficiency. |
| Leveraging Platform Methods via AQbD [61] | Optimization of a well-established, generalized method (platform) for a specific, targeted analytical need using AQbD principles. | Prior knowledge, OFAT scouting, followed by targeted DoE. | A tailored, robust method with a defined MODR derived from a known starting point. | Efficient, builds on existing validated methods, reducing full development time. | Provides a balanced approach, combining reliability of platform methods with the tailored robustness of AQbD. |
The experimental data and performance metrics from these approaches further highlight their distinct profiles.
Table 2: Experimental Data and Performance Metrics from MODR Case Studies
| Application Context | Methodology Applied | Key CMPs Studied | CMAs/Responses | MODR Outcome & Robustness Verification | Reference |
|---|---|---|---|---|---|
| Quantification of Favipiravir [59] | AQbD with D-optimal design & Monte Carlo simulation. | Solvent Ratio (X1), Buffer pH (X2), Column Type (X3). | Peak Area (Y1), Retention Time (Y2), Tailing Factor (Y3), Theoretical Plates (Y4). | MODR calculated via simulation; validated method showed RSD < 2% for precision/accuracy. Method operated at set point: ACN:Buffer (18:82, v/v), pH 3.1. | [59] |
| Separation of Curcuminoids [58] | AQbD with Face-Centered Central Composite Design (CCD). | Flow Rate, Column Temperature, % Acetonitrile. | Retention Time, Resolution, Peak Capacity. | MODR established via multi-response optimization using contour overlays or desirability functions, incorporating uncertainty boundaries. | [58] |
| Targeted Assay for Mannose-5 Glycans [61] | AQbD leveraging a HILIC platform method. | Buffer Concentration, Column Temperature, Gradient Slope. | Resolution of Man-5 from co-eluting peaks. | DoE used to identify optimal conditions and establish a robust MODR for reliable FLR detection, moving from mass spectrometry-based monitoring. | [61] |
| Virtual Profiling of Cephalosporins [60] | DoE-QSRR Model for virtual MODR. | pH, Column Temperature, % Organic Modifier. | Retention Time. | Virtual MODR showed >84% overlap area with experimental MODR, validating the in silico tool for guiding development. | [60] |
Detailed Experimental Protocols for MODR Establishment
The following protocols detail the core workflows for the predominant AQbD-based MODR establishment.
Protocol 1: Comprehensive MODR Development via Empirical DoE
This protocol is foundational for novel method development [59] [58].
- Define the Analytical Target Profile (ATP): Specify the method's purpose, target analytes (e.g., Favipiravir [59]), matrix, and required performance levels (e.g., resolution > 2.0, tailing factor < 1.5).
- Identify Critical Method Attributes (CMAs): Select measurable indicators of method performance from the ATP, such as retention time, resolution, peak area, and tailing factor [59] [58].
- Conduct Risk Assessment: Use tools like Ishikawa diagrams to identify potential factors (method parameters, materials, instruments) affecting CMAs. Classify factors as high, medium, or low risk [59] [61].
- Select Critical Method Parameters (CMPs): High-risk factors become CMPs for experimental study (e.g., mobile phase composition, pH, column type, temperature) [59].
- Design of Experiments (DoE):
- Screening: If many potential CMPs exist, use a fractional factorial or Plackett-Burman design to identify the most influential ones [1].
- Optimization: For the key 3-5 CMPs, employ a response surface design like Central Composite Design (CCD) or Box-Behnken to model quadratic effects and interactions [58].
- Execute Experiments & Data Analysis: Run the DoE, collect chromatographic data for each CMA, and perform statistical analysis (ANOVA, regression) to build mathematical models linking CMPs to each CMA [58].
- MODR Generation via Monte Carlo Simulation: Use software (e.g., MODDE, Fusion QbD) to perform thousands of virtual experiments within the CMP ranges based on the developed models. The MODR is the region where all CMA predictions meet their acceptance criteria with a specified probability (e.g., ≥ 95%) [59] [60].
- Verification & Validation: Experimentally confirm method performance at the chosen working point (often the center of the MODR) and across its edges. Perform full validation per ICH Q2(R2) guidelines [59] [56].
Title: Empirical AQbD Workflow for MODR Establishment
Protocol 2: Virtual MODR Scoping Using DoE-QSRR Modeling
This protocol accelerates development for compound families [60].
- Construct a Foundational Dataset: Perform a set of experimental DoEs (e.g., varying pH, temperature, organic modifier) for a representative set of analytes (e.g., 4 cephalosporin antibiotics) [60].
- Calculate Molecular Descriptors: For all analytes, compute a wide array of molecular descriptors (e.g., logP, polar surface area, topological indices) using cheminformatics software.
- Develop the DoE-QSRR Model: Integrate the experimental conditions (CMPs) and molecular descriptors as independent variables to build a multivariate model predicting chromatographic responses (e.g., retention time) as the dependent variable.
- Validate the Model: Use internal cross-validation and external test sets (data not used in model building) to assess predictive power (e.g., R² > 0.77 for virtual DoEs) [60].
- Perform Virtual DoEs: For a new analyte of known structure, input its calculated descriptors and a range of desired CMPs into the model. Run thousands of virtual experiments to simulate chromatographic outcomes.
- Define a Virtual MODR: Apply Monte Carlo simulation or similar probabilistic methods to the virtual DoE results to identify the region where predicted CMAs meet targets.
- Experimental Confirmation: Conduct a limited, targeted laboratory experiment within the virtual MODR to confirm its accuracy and establish the final, verified MODR.
Title: Virtual MODR Assessment via Integrated DoE-QSRR Model
The Scientist's Toolkit: Essential Reagents and Solutions for MODR Research
Table 3: Key Research Reagent Solutions for MODR Development in HPLC
| Item | Function & Role in MODR Development | Example/Specification |
|---|---|---|
| AQbD-Compatible Chromatography Data System (CDS) Software | Enables seamless bi-directional data transfer between DoE software and the HPLC instrument, automating method execution and data collection for high-throughput experimentation [61]. | Empower CDS integrated with Fusion QbD Software [61]. |
| Statistical Modeling & DoE Software | Provides tools for experimental design (e.g., CCD, Box-Behnken), statistical analysis (ANOVA, regression), and MODR generation via Monte Carlo simulation [59] [58]. | MODDE Pro, Design-Expert, Minitab, Fusion QbD [59] [58]. |
| Chemically Diverse Column Library | Critical for screening CMP "column type" during risk assessment and initial DoE to select the most suitable stationary phase chemistry [59]. | Columns with varying ligand chemistry (C18, C8, phenyl, polar-embedded), particle size, and pore size. |
| pH-Stable Buffer Systems | Allows precise study of pH as a CMP, a factor often critical for resolution of ionizable compounds. Must be compatible with the chosen organic modifiers [59] [60]. | Phosphate, formate, or acetate buffers at varying molarities (e.g., 20-200 mM) [59] [61]. |
| HPLC-Grade Organic Modifiers | Primary components of the mobile phase; their type and ratio are key CMPs affecting retention, selectivity, and peak shape [59] [62]. | Acetonitrile (ACN) and Methanol (MeOH), often used singly or in combination [59] [62]. |
| Reference Standards & Forced Degradation Samples | Essential for validating method specificity and establishing that the MODR ensures adequate separation of the active pharmaceutical ingredient (API) from its degradation products [56]. | High-purity API standards and samples subjected to stress conditions (acid, base, oxidation, heat, light) [56]. |
| Mass Spectrometry Detector (e.g., ACQUITY QDa II) | Used during method development to confirm peak identity and purity, especially when resolving co-eluting peaks, ensuring the CMA (e.g., resolution) is accurately measured [61]. | Single quadrupole or similar mass detector coupled to the HPLC system. |
Troubleshooting Robustness Issues and Method Optimization Strategies
Within the rigorous framework of robustness testing for organic analytical procedures, identifying and controlling critical method parameters is paramount. Robustness, defined as a measure of a method's capacity to remain unaffected by small, deliberate variations in operational parameters, is a cornerstone of method validation as per ICH Q2(R2) guidelines. This guide objectively compares the influence and interplay of three fundamental parameters in Reversed-Phase High-Performance Liquid Chromatography (RP-HPLC)—pH, temperature, and mobile phase composition—drawing on contemporary experimental data. Understanding their relative sensitivity and synergistic effects is crucial for researchers and drug development professionals aiming to develop reliable, transferable, and high-quality analytical methods.
Comparative Analysis of Parameter Sensitivities
The impact of pH, temperature, and mobile phase composition varies significantly based on analyte properties (e.g., ionization state, polarity) and separation goals. The following table synthesizes experimental data from recent studies, highlighting their effects on key chromatographic outcomes.
Table 1: Comparative Influence of Critical Parameters on Chromatographic Performance
| Parameter | Primary Mechanism of Influence | Key Chromatographic Effects | Typical Optimization Range & Sensitivity | Experimental Evidence (Compound) |
|---|---|---|---|---|
| Mobile Phase pH | Modulates the ionization state of acidic/basic analytes, altering hydrophobicity and interaction with the stationary phase. | Dramatic shifts in retention time (k), peak shape (tailing), and selectivity for ionizable compounds. Sensitivity is highest near the analyte's pKa. | Narrow window (±0.2 units around optimal pH often critical). High sensitivity. | Favipiravir: Optimal at pH 3.1 buffer [59]. Lobeglitazone/Glimepiride: Optimal at pH 2.3 for separation and peak shape [63]. |
| Column Temperature | Affects kinetics (viscosity, diffusion), thermodynamics (retention equilibrium), and for ionizable compounds, the apparent pKa and buffer pH. | Alters retention, efficiency (N), and can reverse elution order of isomers. Effect on selectivity is pronounced for ionizable compounds near their pKa. | 20-40°C common; shifts of 5-10°C can be significant. Moderate to High sensitivity for ionizable species. | Structural Isomers: Elution order reversal achieved via temperature change alone at constant pH [64]. Sophorolipids: Studied at 30, 35, 40°C for peak separation [65]. |
| Mobile Phase Composition (Organic Modifier Ratio) | Changes the elution strength and polarity of the mobile phase, governing hydrophobic interactions. | Direct, predictable effect on retention time (k). Primary tool for adjusting runtime and general resolution. | Adjustments of 1-5% (v/v) can fine-tune retention. Predictable and routinely used. | Favipiravir: Optimized ratio of ACN:buffer at 18:82 (v/v) [59]. Paracetamol/Phenylephrine: Gradient optimization from 10% to 90% organic [66]. |
Key Insight from Comparison: While organic modifier strength is a powerful and predictable tool for general retention adjustment, pH and temperature are often the more sensitive "selectivity tools," especially for method robustness. A small deviation in pH can catastrophically affect a method for an ionizable API, whereas a similar deviation in organic percentage might only slightly shift all peaks. Temperature's unique role in modulating the apparent pH and its thermodynamic influence makes it a critical, sometimes overlooked, parameter for achieving robust separations of complex or similar molecules [64].
Detailed Experimental Protocols
Protocol for Investigating Temperature-Dependent Selectivity (Ionizable Compounds)
This protocol, based on the study by Soós et al. [64], is designed to systematically evaluate the sensitive interplay between temperature and pH for ionizable analytes.
- Objective: To map the retention and selectivity of ionizable compounds (e.g., structural isomers) as a function of column temperature at a fixed pH near their pKa.
- Materials:
- Instrumentation: U/HPLC system with binary pump, autosampler, and a column oven capable of precise temperature control (e.g., 20°C to 90°C).
- Column: C18 stationary phase (e.g., Waters Acquity BEH C18, 100 x 2.1 mm, 1.7 µm) [64].
- Chemicals: Analyte(s) of interest, ammonium acetate or phosphate buffer salts, HPLC-grade water and organic solvent (acetonitrile or methanol).
- Method:
- Prepare an isocratic mobile phase with a fixed buffer concentration (e.g., 10 mM ammonium acetate) and organic modifier percentage. Adjust the aqueous buffer to the target pH (e.g., pH 4.0, 4.5, 5.0) using acetic acid or ammonia.
- Set the system flow rate (e.g., 0.3 mL/min for 2.1 mm ID column).
- Starting at the lowest temperature (e.g., 20°C), inject the standard solution and record chromatograms.
- Incrementally increase the column temperature (e.g., in steps of 5°C or 10°C) up to the maximum stable temperature for the column (e.g., 80°C), repeating the injection at each temperature.
- Critical Step: For each temperature, measure the actual pH of the mobile phase effluent after column equilibration, as the pH will shift with temperature.
- Plot retention factors (k) against temperature. For ionizable compounds, a non-linear (sigmoidal) van 't Hoff plot is expected, with inflection points shifting with temperature [64].
- Data Analysis: Identify the temperature region where the greatest change in selectivity or elution order occurs. This region represents a high-sensitivity zone where method robustness must be rigorously tested.
Protocol for AQbD-Based Robustness Testing of pH and Mobile Phase Ratio
This protocol follows the Analytical Quality by Design (AQbD) principle demonstrated for favipiravir [59].
- Objective: To define a Method Operable Design Region (MODR) for pH and solvent ratio using a statistical design.
- Materials: Similar to Protocol 1. Software for experimental design (e.g., MODDE, JMP) is required.
- Method:
- Risk Assessment & Factor Selection: Identify Critical Method Attributes (CMAs) like resolution, tailing factor, and retention time. Through prior knowledge or screening, select pH (X1) and solvent ratio (X2) as Critical Method Parameters (CMPs) [59].
- Experimental Design: Implement a Design of Experiments (DoE), such as a Central Composite Design (CCD), to vary pH and solvent ratio within a practical range.
- Execution: Run the randomized experiments on the HPLC system under otherwise fixed conditions (constant temperature, flow rate, column).
- Modeling & MODR Establishment: Fit multivariate regression models to relate CMPs to CMAs. Use Monte Carlo simulations (as in [59]) to compute a MODR—the multidimensional space where CMAs meet acceptance criteria with a specified probability.
- Data Analysis: The MODR provides a visual and statistical foundation for robustness claims. It explicitly shows how sensitive the method is to combined variations in pH and composition and sets permitted operating ranges.
Visualizing Parameter Interactions and Workflows
Diagram 1: HPLC Parameter Sensitivity & Robustness Pathway
The Scientist's Toolkit: Essential Research Reagents & Materials
Table 2: Key Reagent Solutions for Investigating Parameter Sensitivity
| Item | Function in Robustness Studies | Example from Literature / Notes |
|---|---|---|
| Buffer Systems | Maintains consistent pH in the aqueous mobile phase, critical for reproducibility of ionizable analytes. Common buffers include phosphate, acetate, and formate. | 20 mM Disodium hydrogen phosphate buffer (pH 3.1) for Favipiravir [59]; 10 mM Ammonium acetate for temperature-pKa studies [64]. |
| pH Adjustment Reagents | Used to fine-tune buffer pH during mobile phase preparation (e.g., phosphoric acid, acetic acid, ammonia solution). | Orthophosphoric acid used to adjust buffer to pH 2.3 [63]. |
| HPLC-Grade Organic Modifiers | Primary solvents (Acetonitrile, Methanol) to modulate elution strength. Choice affects selectivity, viscosity, and UV cutoff. | Acetonitrile used in AQbD study [59]; Methanol for stability-indicating method [63]. |
| Stationary Phases with Varied Selectivity | Columns with different ligand chemistry (C18, C8, phenyl-hexyl, biphenyl) to explore selectivity changes when pH/temperature effects are limited. | Inertsil ODS-3 C18 [59]; Zorbax SB-Aq (aqueous stable C18) [66]; Biphenyl columns for alternative selectivity [67]. |
| Inert/Passivated Hardware Columns | Minimize secondary interactions (e.g., metal chelation) that can confound the study of primary pH/temperature effects, especially for sensitive compounds. | Columns with inert hardware (e.g., Halo Inert, Restek Inert) improve recovery for metal-sensitive analytes [67]. |
| Validated Reference Standards | High-purity analyte substances essential for accurate retention time measurement, peak shape, and sensitivity assessment under varying conditions. | Certified standards of Paracetamol, Phenylephrine HCl, etc., used for method optimization [66]. |
For the analyst engaged in robustness testing, acknowledging that not all parameters are equally sensitive is the first step toward developing a rugged method. Experimental data confirms that pH is often the most critical parameter for methods involving ionizable compounds, with its effect magnified near the analyte's pKa. Temperature emerges as a powerful and sometimes underutilized selectivity parameter, capable of fine-tuning separations and even reversing elution order through thermodynamic control [64]. While mobile phase composition is the primary lever for adjusting retention, its effect is generally more predictable and linear. A robust method development strategy, supported by QbD principles [59], systematically maps the design space around these sensitive parameters. This ensures the final method can withstand the minor operational variations expected during routine use in quality control, ultimately safeguarding the reliability of data in drug development.
In the field of pharmaceutical development, the robustness of organic analytical procedures is paramount. Chromatographic methods serve as the cornerstone for quality control, yet analysts frequently encounter two persistent challenges that compromise data integrity: peak splitting and resolution loss. These phenomena not only threaten the accuracy of quantitative measurements but also jeopardize method validation and regulatory compliance. Within the broader context of robustness testing research, understanding the root causes of these problems and systematically evaluating solutions becomes a critical scientific pursuit. This guide objectively compares the performance of modern chromatographic solutions against traditional alternatives, providing supporting experimental data to inform researchers, scientists, and drug development professionals in their method development and troubleshooting workflows.
Understanding Peak Splitting: Causes and Modern Solutions
Peak splitting, the phenomenon where a single analyte manifests as two or more partially resolved peaks, typically indicates issues with the column inlet or sample introduction path. Common causes include column void formation, inappropriate solvent strength, or hardware-related problems such as improper tubing connections [68] [69]. The presence of split peaks severely compromises accurate integration and quantification, especially for critical pair separations in pharmaceutical formulations.
Comparative Performance of Modern Inert Hardware Columns
Recent advancements in column technology have specifically addressed the metal-sensitive analytes that often contribute to peak splitting and shape anomalies. The following table summarizes key performance characteristics of modern inert hardware columns compared to traditional stainless steel columns:
Table 1: Performance Comparison of Traditional vs. Inert Hardware HPLC Columns
| Column Type | Key Features | Target Analytes | Documented Benefits | Vendor Examples |
|---|---|---|---|---|
| Traditional Stainless Steel | Standard 316 stainless steel hardware | Robust, non-chelating compounds | Widely available, lower cost | Various conventional columns |
| Halo Inert | Passivated hardware creating metal-free barrier | Phosphorylated compounds, metal-sensitive analytes | Enhanced peak shape, improved analyte recovery | Advanced Materials Technology [67] |
| Evosphere Max | Inert hardware with monodisperse porous particles | Peptides, metal-chelating compounds | Improved peptide recovery and sensitivity | Fortis Technologies Ltd. [67] |
| Restek Inert HPLC Columns | Inert hardware with polar-embedded alkyl phases | Chelating PFAS, pesticides | Improved response for metal-sensitive analytes | Restek Corporation [67] |
| Raptor Inert HPLC Columns | Superficially porous particles with inert hardware | Metal-sensitive polar compounds | Improved chromatographic response | Restek Corporation [67] |
Experimental data from robustness testing indicates that inert column hardware significantly improves peak shape for challenging analytes. For instance, methods analyzing phosphorylated compounds demonstrated up to 40% improvement in peak symmetry when transitioning from traditional stainless steel columns to inert alternatives, with tailing factors improving from approximately 1.8 to below 1.2 [67]. This enhancement directly addresses the secondary retention mechanisms that often cause peak splitting and severe tailing.
Experimental Protocol: Testing for Hardware-Related Peak Splitting
To systematically diagnose and address hardware-related peak splitting, the following experimental protocol is recommended:
Preparation of Test Solutions: Prepare a standard solution of a metal-sensitive test compound (e.g., a phosphorylated molecule or certain pharmaceutical base) at method concentration.
Baseline Evaluation: Inject the standard using the current method conditions and a reference column known to be in good condition. Document peak shape, symmetry, and area response.
Alternative Column Testing: Replace the analytical column with an inert hardware column of equivalent dimensions and stationary phase chemistry. Maintain identical chromatographic conditions (mobile phase, flow rate, temperature, and gradient).
Comparative Analysis: Inject the same standard solution and document the same performance metrics.
Data Interpretation: A significant improvement (e.g., reduction in tailing factor, elimination of shoulder peaks) with the inert column strongly suggests that metal interactions at the column frit or hardware were contributing to the splitting phenomenon.
Addressing Resolution Loss: From Fundamentals to Practical Solutions
Resolution loss between critical pairs represents another frequent challenge in robustness testing. Chromatographic resolution (Rs) quantifies the degree of separation between two adjacent peaks and is calculated as Rs = 2(t₂ - t₁)/(w₁ + w₂), where t is retention time and w is peak width [70]. From a practical perspective, resolution degradation manifests as rising valley heights between partially separated peaks, eventually leading to co-elution and quantification errors.
Quantitative Assessment of Resolution Loss
When peak overlap prevents accurate width measurement, the valley-to-peak height ratio provides an effective alternative for resolution estimation [71]. The following table illustrates the relationship between resolution, valley height, and potential quantification errors for equal-area Gaussian peaks:
Table 2: Resolution Estimation Using Valley Height Ratios and Associated Quantitative Errors
| Resolution (Rs) | Valley Height (% of Shorter Peak) | Minimum Quantitative Error* | Maximum Quantitative Error |
|---|---|---|---|
| 1.5 | ~0% | 0.1% | 0.1% |
| 1.3 | ~10% | 0.5% | 2.3% |
| 1.0 | ~25% | 2.2% | 8.4% |
| 0.9 | ~54% (for 2:1 size ratio) | 4.0% | 15.9% |
| 0.8 | ~75% (for 2:1 size ratio) | 6.4% | 23.6% |
| 0.7 | ~96% (for 2:1 size ratio) | 9.7% | 32.8% |
| 0.6 | ~91% (for 1:1 size ratio) | 13.4% | 42.7% |
Assuming equal detector response factors. *Assuming significantly different detector response factors. Data adapted from Dolan and Barth [71] [70].*
The data demonstrates that resolution values below 1.5 can introduce substantial quantitative errors, particularly for analytes with different detector responses. For a peak pair with a 2:1 area ratio at Rs = 0.8, the valley height rises to 75% of the smaller peak's height, potentially causing over 20% error in quantification depending on response factor differences [71]. This underscores why system suitability tests often mandate minimum resolution requirements of 1.5 or higher for critical pairs.
Column Selectivity and Method Robustness
The strategic selection of stationary phase chemistry plays a pivotal role in achieving and maintaining robust resolution. Alternative selectivity columns can resolve peak pairs that co-elute on conventional C18 phases. For example, phenyl-hexyl columns provide enhanced separation for analytes capable of π-π interactions, while polar-embedded phases offer superior retention and selectivity for hydrophilic compounds [72] [67]. Experimental data from a method developed for Metoclopramide and Camylofin demonstrates that optimizing the stationary phase and mobile phase conditions through Response Surface Methodology (RSM) achieved a resolution of >2.0, with robustness verified against deliberate variations in flow rate (±0.1 mL/min), temperature (±5°C), and buffer concentration [72].
Integrated Troubleshooting Workflow
A systematic approach is essential for efficiently diagnosing and correcting chromatographic problems. The following workflow integrates the discussed concepts and solutions into a logical troubleshooting pathway.
Figure 1: A systematic diagnostic workflow for addressing chromatographic peak splitting and resolution loss.
The Scientist's Toolkit: Essential Research Reagents and Materials
The following table catalogues key materials and solutions referenced in experimental studies for addressing chromatographic challenges.
Table 3: Essential Research Reagents and Materials for Chromatographic Troubleshooting
| Item Name | Function/Application | Experimental Context |
|---|---|---|
| Phenyl-Hexyl Column | Provides alternative selectivity via π-π interactions; enhances separation of aromatic compounds. | Used in MET/CAM method development to achieve resolution >2.0 [72]. |
| Inert Hardware Columns | Minimizes metal-analyte interactions; improves peak shape for phosphorylated & chelating compounds. | Documented to enhance analyte recovery and peak symmetry [67]. |
| High-pH Stable C18 Column | Enables operation at alkaline conditions (pH 7-12); useful for separating basic compounds. | Provides broader application range and robust method development [67]. |
| Ammonium Acetate Buffer | A volatile buffer suitable for LC-MS; effective in controlling mobile phase pH. | Used at 20 mM, pH 3.5 for optimal resolution of MET and CAM [72]. |
| Superficially Porous Particles | Core-shell particles offering high efficiency with lower backpressure. | Found in Raptor and Halo columns for fast analysis and improved peak shape [67]. |
| Guard Column Cartridges | Protects analytical column from irreversible adsorption and particulate matter. | Replacing a saturated guard column restored peak shape in a matrix-heavy sample [68]. |
Managing Time-Related Effects and Instrumental Drift
Within the framework of robustness testing for organic analytical procedures, managing instrumental drift is paramount for ensuring method reliability and data integrity during transfer between laboratories or over extended study timelines. Robustness is defined as a measure of an analytical procedure's capacity to remain unaffected by small, deliberate variations in method parameters [17]. Instrumental drift—a gradual shift in a measurement system's output over time—constitutes a critical uncontrolled variable that can compromise this robustness, leading to measurement errors, safety hazards, and quality issues [73]. This guide compares prevalent strategies for monitoring, correcting, and mitigating time-related drift in analytical instrumentation, with a focus on chromatographic and spectrometric techniques central to pharmaceutical and metabolomics research.
Defining and Classifying Measurement Drift
Understanding the nature of drift is the first step in its management. In metrology, drift is a measurement error caused by the gradual shift in a gauge’s measured values over time [73]. The primary types are:
Zero Drift (Offset Drift): A consistent, additive shift across all measured values. Span Drift (Sensitivity Drift): A proportional increase or decrease in measured values relative to the calibrated values as the magnitude changes. Zonal Drift: A shift occurring only within a specific range of measured values. Combined Drift: The simultaneous occurrence of multiple drift types [73].
Drift durations are categorized as:
- Short-term drift: A temporary effect from factors like thermal expansion or vibration, where values often return to baseline after the stressor is removed.
- Long-term drift: A gradual, typically irreversible shift caused by wear and tear, often predictable and correctable through calibration [73].
Comparative Analysis of Drift Correction Strategies
Different analytical fields employ specific strategies to combat drift. The effectiveness of these strategies varies based on the instrument, sample type, and study design. The following table summarizes and compares the core approaches.
Table 1: Comparison of Drift Correction and Management Strategies
| Strategy | Core Principle | Key Advantages | Key Limitations/Challenges | Primary Application Context |
|---|---|---|---|---|
| Quality Control (QC) Sample-Based Correction | Models and corrects intensity drift for each analyte using a repeatedly analyzed QC sample, often with LOESS, splines, or polynomial regression [74]. | Corrects analyte-specific drift patterns; suitable for untargeted studies; does not require isotope-labeled standards for all analytes. | Requires ample QC material; increases instrument time; correction accuracy depends on QC representativeness and curve-fitting model. | LC-MS/MS metabolomics over long-term, multi-batch studies [74]. |
| Internal Standard (IS) Normalization | Corrects for instrument response variation using a known compound added at a constant concentration to all samples and standards. | Compensates for sample preparation losses and instrument drift; common and straightforward. | Assumes IS and analyte behave identically; matrix effects can bias correction if IS and analyte are affected differently [74]. | General chromatography (GC, HPLC) and targeted MS assays. |
| Isotope Dilution Mass Spectrometry | Uses a stable isotope-labeled analog of the analyte as the internal standard. The analyte/IS ratio is used for quantification. | Gold standard for accuracy; corrects for nearly all procedural and instrumental variability, including drift and matrix effects [74]. | Costly; requires synthesis of labeled analogs for each analyte; impractical for untargeted profiling of thousands of compounds. | Targeted quantification of specific analytes where highest accuracy is required (e.g., clinical biomarkers, dioxins) [74]. |
| Time-Series Calibration & Surface Fitting | Fits a calibration model (e.g., polynomial surface) across both frequency and time dimensions, interpolating solutions to the times of sample measurement. | Explicitly models and removes temporal drift; reduces parameter degeneracies; allows for relaxation of hardware matching assumptions [75]. | Methodologically complex; requires high-frequency calibration data interspersed with sample measurements. | Precision radio cosmology experiments (e.g., REACH), where instrument stability over long integrations is critical [75]. |
| Digital Measurement & High-Stability Clocks | Replaces analog sensor measurement with digital time-of-flight or pulse counting using ultra-stable crystal or atomic oscillators. | Virtually eliminates sensor input drift; reduces maintenance frequency; high precision [76]. | Output analog circuitry (e.g., 4-20mA) can still drift; initial cost can be high. | Radar level transmitters, Coriolis flow meters, and other time-based industrial instruments [76]. |
| Robustness Testing & System Suitability | Proactively identifies method parameters (e.g., column temp, flow rate) sensitive to variation and defines allowable control limits (SST) to ensure performance despite minor drift [17]. | Prevents drift-related failures before they occur; establishes a validated operational envelope for the method. | Does not correct existing drift; requires upfront experimental design (e.g., Plackett-Burman) and analysis [17]. | Method development and validation for regulatory submission in pharmaceutical analysis [17]. |
Detailed Experimental Protocols
Protocol for Robustness Testing to Establish Drift-Resistant Methods
This protocol, based on ICH guidelines, is performed during method optimization to identify factors whose variation could cause significant drift in assay responses [17].
- Factor and Level Selection: Select method parameters (e.g., mobile phase pH (±0.1), column temperature (±2°C), flow rate (±5%)) and environmental conditions likely to affect results. Define "extreme" levels symmetrically around the nominal level, representative of inter-laboratory variation [17].
- Experimental Design: Employ a two-level screening design (e.g., a 12-experiment Plackett-Burman design) to efficiently examine multiple factors [17].
- Response Selection: Choose both assay responses (e.g., % recovery of active compound) and system suitability test (SST) responses (e.g., critical resolution, peak asymmetry) [17].
- Execution: Execute experiments in a randomized or "anti-drift" sequence. Include regular replicate measurements at nominal conditions to monitor and correct for any time-dependent drift during the test [17].
- Data Analysis: Calculate the effect of each factor on each response. Statistically analyze effects (e.g., using half-normal probability plots or comparison to dummy factor effects) to identify significant factors [17].
- Conclusion: Define controlled tolerances for significant parameters to be included in the method's SST criteria, thereby ensuring the method's robustness against minor drift [17].
Protocol for QC-Based Intensity Drift Correction in LC-MS Metabolomics
This protocol is used to correct data acquired in multiple batches over extended periods [74].
- QC Sample Preparation: Prepare a large, homogeneous pool of QC sample (e.g., pooled study samples or a commercial matrix) containing all analytes of interest. Aliquot and store at -80°C [74].
- Analysis Queue Design: Analyze the QC sample repeatedly throughout the batch—typically at the beginning, at regular intervals (e.g., every 6-10 injections), and at the end of the batch [74].
- Data Extraction: Obtain peak areas or heights for all metabolites in both QC and study samples.
- Drift Modeling: For each metabolite, model the relationship between the QC injection sequence order and the QC response intensity using a fitting algorithm (e.g., LOESS regression, cubic splines, or quadratic regression) [74].
- Sample Correction: Apply the derived model to the study samples. The correction factor for a study sample injected at sequence position t is based on the predicted QC response at t versus a reference point (e.g., the median QC response).
- Validation: Validate correction performance by assessing the reduction in QC coefficient of variation (CV) and, if available, by comparing corrected values to those normalized using isotope dilution for a subset of metabolites [74].
Visualization of Concepts and Workflows
Diagram 1: A taxonomy of measurement drift and its common root causes [73].
Diagram 2: Stepwise workflow for correcting intensity drift using quality control samples in metabolomics [74].
The Scientist's Toolkit: Essential Reagents & Materials
Table 2: Key Research Reagent Solutions for Drift Management and Robustness Testing
| Item | Function in Drift Management / Robustness | Example / Specification |
|---|---|---|
| Stable Isotope-Labeled Internal Standards (SIL-IS) | Serves as the gold-standard for correction of analyte recovery, matrix effects, and instrumental drift via isotope dilution mass spectrometry [74]. | ¹³C- or ²H-labeled analog of the target analyte, added at known concentration prior to sample extraction. |
| Pooled Quality Control (QC) Sample | Provides a consistent benchmark across an analytical batch or study for monitoring and modeling analyte-specific intensity drift [74]. | A homogeneous pool representative of the study sample matrix (e.g., pooled human plasma), aliquoted and stored at -80°C. |
| Reference Calibration Sources | Used to constrain multiple instrument parameters (noise wave parameters) in precision systems, enabling sophisticated drift modeling over time and frequency [75]. | Set of loads with known, varied temperatures and impedances (e.g., 50Ω cold load, 25Ω/100Ω loads, heated 370K load). |
| Chromatographic Column from Different Batch/Supplier | A "qualitative factor" in robustness testing to evaluate the method's sensitivity to column reproducibility, a common source of retention time drift [17]. | An equivalent column (same phase) from a different manufacturing lot or a different vendor. |
| System Suitability Test (SST) Mix | A standard solution containing key analytes to verify system performance before and during sample analysis, ensuring it operates within limits defined by robustness testing [17]. | Contains analytes at specified concentrations to check parameters like retention time, resolution, tailing factor, and sensitivity. |
| Mobile Phase Buffers (at varied pH) | Used to test the robustness of a method to small, deliberate variations in mobile phase pH, which can affect ionization and cause peak shape or retention time drift [17]. | Buffers prepared at nominal pH ± 0.1-0.2 units. |
Optimizing Methods Using Quality by Design (QbD) Principles
The pursuit of robust, reliable, and transferable analytical methods is a cornerstone of modern pharmaceutical development and research. Within the context of a broader thesis on robustness testing for organic analytical procedures, this guide explores the paradigm shift from traditional, empirical method development to a systematic, science-based approach: Quality by Design (QbD) and its application to analytical sciences, known as Analytical Quality by Design (AQbD). This framework moves beyond mere compliance, aiming to build quality and robustness directly into the method through enhanced understanding and control [77] [9].
From Quality-by-Testing to Quality-by-Design: A Core Paradigm Shift
Traditional analytical method development often relies on a One-Factor-at-a-Time (OFAT) approach, which is inefficient and fails to capture interactions between variables [9] [78]. This "Quality-by-Testing" (QbT) model fixes method parameters rigidly, making post-approval changes cumbersome and offering limited understanding of method capabilities [78].
In contrast, QbD is "a systematic approach to development that begins with predefined objectives and emphasizes product and process understanding and process control, based on sound science and quality risk management" [77] [78]. When applied to analytical procedures, AQbD ensures methods are fit for purpose throughout their lifecycle, from development to routine use and eventual retirement [78] [79]. The core objectives are to increase process capability, reduce variability, enhance root-cause analysis, and facilitate more flexible change management [77].
The table below summarizes the fundamental differences between the two approaches.
Table 1: Comparison of Traditional (OFAT/QbT) and QbD-Enhanced Method Development
| Aspect | Traditional Approach (OFAT / QbT) | QbD-Enhanced Approach (AQbD) |
|---|---|---|
| Philosophy | Quality is verified by testing; fixed method parameters. | Quality is built into the method by design; flexible, knowledge-based ranges. |
| Development Strategy | Empirical, trial-and-error, sequential factor study. | Systematic, risk-based, multivariate study using Design of Experiments (DoE). |
| Understanding | Limited; focuses on demonstrating performance at a single setpoint. | Deep; explores cause-effect relationships between parameters and attributes. |
| Output | A fixed set of operating conditions. | A Method Operable Design Region (MODR) – a multidimensional space where performance criteria are met [9] [79]. |
| Robustness | Tested late, often as a confirmatory check. | Understood and optimized during development; robustness is a key objective. |
| Regulatory Flexibility | Low; changes often require regulatory notification or revalidation. | High; changes within the established MODR can be managed with less regulatory burden [9] [78]. |
| Lifecycle Management | Reactive, focused on troubleshooting failures. | Proactive, enabling continuous improvement based on monitoring and knowledge management. |
The AQbD Workflow: A Stepwise Roadmap to Robust Methods
Implementing AQbD follows a structured workflow that aligns with ICH Q14 (Analytical Procedure Development) and Q2(R2) (Validation of Analytical Procedures) guidelines [78] [79]. The following diagram illustrates this lifecycle approach.
Diagram 1: The Analytical Quality by Design (AQbD) Lifecycle Workflow
Step 1: Define the Analytical Target Profile (ATP)
The ATP is a prospective summary of the method's required performance characteristics. It defines what the method needs to achieve, such as specificity for target analytes, accuracy, precision, linearity range, and detection limits, to ensure it is fit for its intended purpose [78] [79].
Step 2: Risk Assessment & Identification of Critical Parameters
Using tools like Ishikawa diagrams or Failure Mode and Effects Analysis (FMEA), potential sources of variability are identified. This step distinguishes Critical Analytical Procedure Parameters (CAPPs)—input variables (e.g., pH, column temperature, % organic solvent) that significantly affect Critical Analytical Procedure Attributes (CAPAs)—the key performance outputs (e.g., resolution, retention time, peak area) [78].
Step 3: Screening and Optimization via Design of Experiments (DoE)
This is the core experimental phase. Instead of OFAT, a multivariate DoE approach is used to study the impact of multiple CAPPs and their interactions on CAPAs simultaneously and efficiently [77] [80]. Screening designs (e.g., Plackett-Burman) identify the most influential factors, followed by optimization designs (e.g., Box-Behnken, Central Composite) to model the response surface [17] [79].
Experimental Protocol 1: Robustness Testing for an HPLC Method A key component of AQbD is formal robustness testing, which evaluates a method's capacity to remain unaffected by small, deliberate variations in CAPPs [17] [81].
- Select Factors & Levels: Choose CAPPs (e.g., mobile phase pH ±0.1 units, flow rate ±0.05 mL/min, column temperature ±2°C, organic solvent composition ±1% v/v). Levels should represent realistic variations expected during routine use or transfer [17] [81].
- Select Experimental Design: For ≤10 factors, a Plackett-Burman or fractional factorial design is suitable for screening [17].
- Execute Experiments: Perform runs in randomized or "anti-drift" order to minimize bias [17].
- Measure Responses: Record CAPAs such as assay result, resolution of critical pair, tailing factor, and retention time.
- Analyze Effects: Calculate the effect of each factor on each response. Statistical significance is often determined by comparing effects to those from dummy factors or using a threshold like the Algorithm of Dong [17]. The diagram below outlines a typical data analysis pathway.
Diagram 2: Robustness Test Data Analysis Flow
Step 4: Establish the Method Operable Design Region (MODR)
Using models from DoE data, the MODR is defined as the multidimensional combination of CAPP ranges within which the method meets all ATP requirements [9] [79]. This is the heart of AQbD, providing a scientific justification for operational flexibility. Monte Carlo simulations can be used to compute the MODR with a defined risk level (e.g., <10% failure probability) [79].
Step 5: Select a Working Point, Validate, and Implement Control Strategy
A specific set of conditions (the working point) is chosen within the MODR for routine use. The method is then validated according to ICH Q2(R2) at this point [79]. A lifecycle control strategy is implemented, including system suitability tests (SST) derived from robustness studies to monitor method performance continuously [17] [78].
Comparative Application of QbD Principles Across Analytical Techniques
The AQbD approach is universally applicable but implemented differently depending on the analytical technique. The table below compares its application in three key areas relevant to organic analytical procedures.
Table 2: QbD Application in Different Analytical Domains – A Comparative Guide
| Technique / Domain | Key QbD Study Focus (CAPPs) | Typical Responses (CAPAs) | Reported Outcome vs. Traditional Method | Source / Case |
|---|---|---|---|---|
| Reversed-Phase HPLC | Mobile phase pH, organic % (±1%), column temp, flow rate, gradient time, column brand. | Resolution (Rs), retention time (tR), tailing factor, assay accuracy. | Enhanced robustness & understanding. Defined MODR allows ±1% organic solvent variation without failing SST. Traditional OFAT would not model interactions (e.g., pH & temp). | [17] [81] |
| Quantitative NMR (qNMR) | Number of scans (NS), relaxation delay (D1), acquisition time (AQ). | Signal-to-Noise (S/N), accuracy, precision, quantification limit. | First AQbD application for 19F-qNMR. Defined MODR for NS, D1, AQ ensures robustness. Method more reliable and provides a scientific basis for parameter adjustments. | [79] |
| Organic Synthesis Methodology | Catalyst load, solvent volume, temperature, reaction time, additive/functional group tolerance. | Reaction yield, purity, byproduct formation. | "Robustness Screen" identifies tolerant conditions. Enables rapid assessment of a reaction's applicability scope, crucial for synthesizing complex molecules like APIs. More predictive than testing individual substrates sequentially. | [82] |
| Medicinal Plant Analysis (Complex Matrices) | Extraction parameters, chromatographic conditions for multi-component analysis. | Resolution of multiple markers, accuracy for several analytes, peak shape. | Addresses complexity challenge. AQbD manages variability from plant material and multi-target analysis better than univariate methods, leading to more reliable control strategies for natural products. | [78] |
Experimental Protocol 2: Robustness Screen for Synthetic Organic Methodology This protocol, adapted for evaluating reaction conditions, exemplifies QbD thinking in synthesis [82].
- Define Objective: Assess the functional group tolerance and stability of a new catalytic reaction.
- Design Experiment: Prepare a series of small-scale parallel reactions where the core substrate is constant, but a diverse panel of additives (each representing a different functional group) is included.
- Execution: Run all reactions under the same nominal conditions (catalyst, solvent, temperature, time).
- Analysis: Use a rapid analytical technique like gas chromatography (GC) with a simplified calibration to quantify the yield of the desired product for each additive.
- Interpretation: Quantitative data reveals which functional groups are tolerated or degraded under the conditions. This "robustness screen" provides a comprehensive performance map, guiding chemists on the method's applicability scope more efficiently than serial substrate testing.
The Scientist's Toolkit: Essential Reagents & Solutions for QbD Implementation
Successfully implementing AQbD requires more than just instrumentation; it demands a suite of conceptual and practical tools.
Table 3: Research Reagent Solutions for AQbD Implementation
| Tool / Solution Category | Specific Item / Concept | Function in AQbD |
|---|---|---|
| Risk Assessment Tools | Ishikawa (Fishbone) Diagram, Failure Mode & Effects Analysis (FMEA), Prior Knowledge. | To systematically identify and rank potential Critical Analytical Procedure Parameters (CAPPs) that could impact method quality. |
| Experimental Design Software | JMP, Minitab, Design-Expert, MODDE. | To generate statistically sound screening and optimization designs (DoE), randomize run orders, and model complex factor-response relationships. |
| Chromatographic Modeling Software | DryLab, ACD/LC Simulator. | To virtually model HPLC separations based on minimal initial experiments, predict performance within a design space, and accelerate MODR definition. |
| Data Analysis & Visualization | R (with DoE.base, rsm packages), Python (SciPy, statsmodels), MATLAB. |
To calculate factor effects, perform analysis of variance (ANOVA), create response surface plots, and conduct Monte Carlo simulations for MODR calculation. |
| Quality Standards & Guidelines | ICH Q2(R2), ICH Q14, ICH Q9, USP <1220>. | Provide the regulatory and scientific framework for defining ATP, performing validation, and managing the analytical procedure lifecycle. |
| System Suitability Test (SST) Reference Materials | Well-characterized reference standards, mixture standards for critical resolution. | To continuously verify that the method performance at the selected working point remains within the MODR's assured quality boundaries during routine use. |
Framed within a thesis on robustness testing for organic analytical procedures, the adoption of QbD principles represents a fundamental evolution from testing for robustness to designing for robustness. The comparative analysis demonstrates that AQbD delivers more resilient, well-understood, and flexible methods compared to traditional OFAT approaches across HPLC, NMR, and synthetic chemistry. The provision of a Method Operable Design Region (MODR) is a key differentiator, offering a scientifically defended space for robust operation [9] [79].
The primary challenge, especially for complex systems like medicinal plant analysis, lies in the initial resource investment for multivariate studies and the need for statistical expertise [78]. However, the long-term benefits—reduced out-of-specification results, fewer failed method transfers, and more agile lifecycle management—are compelling [77] [78]. Future research in this field should focus on making DoE and modeling tools more accessible and integrating AQbD principles seamlessly into the early stages of analytical method development for all organic compounds, thereby making robustness an inherent quality rather than a post-development check.
Analytical Quality by Design (AQbD) for Enhanced Robustness
The pharmaceutical industry is undergoing a significant paradigm shift, moving away from traditional, empirical analytical methods toward a systematic, science-based framework known as Analytical Quality by Design (AQbD) [9]. This transition is driven by the need for more robust, reliable analytical procedures that can ensure consistent product quality throughout their lifecycle. Traditional method development often relies on a trial-and-error approach (one-factor-at-a-time, OFAT), which can be time-consuming, inefficient, and may fail to adequately identify and control sources of variability [9]. Such methods are prone to performance issues during routine use, potentially leading to out-of-specification results and system suitability test failures, ultimately impacting cost and time [9].
In contrast, AQbD embodies a proactive, risk-based methodology that emphasizes building quality into the analytical method from the outset. Rooted in the ICH guidelines Q8-Q12, AQbD focuses on achieving a thorough understanding of how method variables impact performance and using this knowledge to define a controlled, robust operational region [83] [84]. The direct result of implementing AQbD is the generation of trustworthy, reportable data, which is crucial for making critical drug product decisions and ensuring patient safety [85]. This approach not only enhances method robustness but also supports regulatory flexibility and continuous improvement throughout the analytical procedure lifecycle.
Core Principles and Workflow of AQbD
The AQbD framework is built upon a systematic, science- and risk-based workflow. This workflow ensures the analytical procedure is fit-for-purpose and maintains its performance over time. The cornerstone of this process is the Analytical Target Profile (ATP), a prospective summary of the method's requirements that defines the intended purpose and needed performance characteristics [86] [85].
The following diagram illustrates the logical workflow and key stages of implementing AQbD, from defining objectives to establishing a control strategy.
The workflow begins with defining the ATP, which outlines the method's purpose and required performance criteria, such as precision, accuracy, and specificity [85]. Subsequently, a risk assessment is conducted using tools like Ishikawa diagrams or Failure Mode Effects Analysis (FMEA) to identify which Critical Method Parameters (CMPs) and Critical Method Attributes (CMAs) significantly impact the method's ability to meet the ATP [86]. This is followed by Design of Experiments (DoE), a multivariate approach used to systematically study the interaction effects of CMPs on CMAs, moving beyond the limitations of the OFAT approach [87] [84].
The knowledge gained from DoE is used to establish the Method Operable Design Region (MODR), a multidimensional combination of input variables that has been demonstrated to provide suitable method performance [59] [9]. The MODR, equivalent to the "Design Space" concept from ICH Q8, offers regulatory flexibility, as changes within this space do not typically require re-validation [9]. Finally, a control strategy is implemented to ensure the method remains in a state of control during routine use, supported by ongoing performance monitoring throughout its lifecycle [87] [85].
Comparative Analysis: AQbD vs. Traditional Approach
Robustness is a critical measure of an analytical method's capacity to remain unaffected by small, deliberate variations in procedure parameters [9]. The fundamental difference between AQbD and the traditional approach lies in how this robustness is achieved and assured.
Quantitative Comparison of Method Performance
The following table summarizes experimental data from case studies, directly comparing the robustness and performance of AQbD-guided methods versus traditional methods.
| Analytical Method & Analyte | Development Approach | Key Performance Indicators & Robustness Metrics | Reference |
|---|---|---|---|
| RP-HPLC for Favipiravir | AQbD (D-optimal design) | RSD for precision and robustness < 2%; Excellent Eco-Scale score (>75). MODR established for buffer pH and ratio. | [59] |
| LC-ICP-MS for Arsenic Speciation | AQbD (Central Composite Design) | Precision: 0.25–1.95% RSD; Recovery: 77.11–99.64%; MODR defined for acid strength and pH. | [88] |
| RP-HPLC for Dobutamine | AQbD (Central Composite Design) | Tailing factor: 1.0; Theoretical plates: >12,000; System precision RSD: 0.3%. | [89] |
| HPLC-UV for Meropenem | AQbD | Recovery rate: ~99%; Comprehensive green assessment showed reduced environmental impact. | [90] |
| Traditional HPLC Methods | One-Factor-at-a-Time (OFAT) | Higher incidence of OOS results and SST failures; Performance often susceptible to parameter variations; Requires redevelopment and revalidation. | [9] |
Inherent Advantages of the AQbD Workflow
The data demonstrates that AQbD-led methods consistently achieve high precision and reliability. The primary advantage is the proactive understanding of variability. While the traditional OFAT approach tests robustness only after validation, AQbD investigates it during the development phase using multivariate experiments [9]. This allows for the creation of a predictive MODR, which acts as a buffer against operational fluctuations, thereby enhancing method resilience [59] [9].
Furthermore, AQbD enables regulatory flexibility. Changes within the established MODR do not necessitate regulatory post-approval submissions, simplifying method improvements and scaling [9]. This leads to increased cost-effectiveness by reducing the resources spent on troubleshooting, redevelopment, and repeated validation cycles often associated with traditionally developed methods [85].
Experimental Protocols for AQbD Implementation
Protocol 1: Developing a Robust RP-HPLC Method Using AQbD
This protocol is adapted from the development of a method for quantifying Favipiravir [59].
- Step 1: Define the ATP – The ATP stated the need for a precise, accurate, and stability-indicating RP-HPLC method for the quantification of Favipiravir in pharmaceutical dosage forms, with specified limits for peak area, retention time, tailing factor, and theoretical plates.
- Step 2: Risk Assessment and Variable Selection – Initial risk assessment using an Ishikawa diagram identified the ratio of solvent (X1), pH of the buffer (X2), and column type (X3) as high-risk factors. These were selected as Critical Method Parameters.
- Step 3: Experimental Design (DoE) – A D-optimal experimental design was employed to study the impact of the three CMPs on the four Critical Method Attributes (Y1-Y4). This design is efficient for handling constraints on factor combinations.
- Step 4: Model Fitting and MODR Establishment – Statistical analysis of the DoE data was performed using MODDE 13 Pro software. A Monte Carlo simulation method was used to compute the MODR, identifying the robust set point: an Inertsil ODS-3 C18 column with a mobile phase of acetonitrile and 20 mM disodium hydrogen phosphate buffer (pH 3.1) in an 18:82 v/v ratio.
- Step 5: Validation and Verification – The method was validated per ICH guidelines within the MODR. System suitability parameters were all within USP limits, and the method demonstrated excellent linearity, precision (RSD < 2%), accuracy, and robustness.
Protocol 2: Implementing AQbD for Complex Analytical Procedures
This protocol, derived from an LC-ICP-MS method for arsenic speciation, highlights the application of AQbD to more complex separations [88].
- Step 1: ATP Definition – The ATP required the simultaneous separation and quantification of As(V), As(III), and DMA in biological cells (HEK-293) with acceptable resolution and sensitivity.
- Step 2: Risk Identification – Based on prior knowledge and risk assessment, formic acid concentration (X1), citric acid strength (X2), and mobile phase pH (X3) were identified as Critical Method Variables impacting resolution and retention time.
- Step 3: Multivariate Optimization – A Central Composite Design (CCD), a type of response surface methodology, was applied to study the quadratic effects and interactions of the three factors on the five method responses.
- Step 4: Analysis and MODR Definition – Analysis of Variance (ANOVA) indicated significant interaction effects and curvature. The MODR was defined as formic acid 0.1%, citric acid strength 20–30 mM, and pH 5.6–6.8. The final method was optimized at pH 5.6.
- Step 5: Control and Green Assessment – The method was validated, proving robust for method variables. Its environmental friendliness and user-friendliness were confirmed using multiple green and white analytical chemistry assessment tools (AGREE, GAPI, RGB).
The Scientist's Toolkit: Essential Research Reagents and Solutions
The successful application of AQbD relies on a combination of advanced software, instrumentation, and consumables. The following table details key solutions used in the featured experiments.
| Tool Category | Specific Examples | Function in AQbD Workflow |
|---|---|---|
| DoE & Statistical Analysis Software | MODDE Pro [59], Other platforms supporting CCD and D-optimal designs [88] | Facilitates the design of multivariate experiments, statistical analysis of data, model building, and graphical establishment of the MODR. |
| Chromatography Data System | Empower Software (Shimadzu) [89], LC Solution (Shimadzu) [90] | Used for data acquisition, processing, and management. Critical for collecting precise and accurate response data for DoE analysis. |
| HPLC/UHPLC Instrumentation | Shimadzu HPLC systems [89] [90], Agilent 1260 HPLC [88] | Provides the platform for method execution. Modern, reliable instruments are necessary to minimize system-induced variability. |
| Analytical Columns | Inertsil ODS-3 C18 [59], ZORBAX RRHD SB-Aq [88], Kinetex C18 [90] | The stationary phase is a critical method parameter. Different columns may need to be screened and controlled as part of the method development. |
| HQ Reagents & Solvents | HPLC-grade Acetonitrile/Methanol [89] [90], Buffer Salts (e.g., disodium hydrogen phosphate, ammonium acetate) [59] [90] | High-purity solvents and reagents are essential for achieving low noise, good peak shape, and reproducible results. |
The implementation of Analytical Quality by Design represents a fundamental evolution in the development of analytical procedures. By replacing the empirical OFAT approach with a systematic, science- and risk-based framework, AQbD delivers a proven pathway to enhanced robustness [59] [9]. The methodology's power lies in its ability to proactively identify and control sources of variation, resulting in methods that are inherently more resilient to operational parameter fluctuations [87].
The case studies and data presented provide compelling evidence that AQbD-led methods achieve superior performance, regulatory flexibility, and long-term cost savings compared to their traditional counterparts [59] [85]. As the pharmaceutical industry continues to advance, embracing AQbD principles is no longer merely an option but a critical strategy for ensuring the reliability of analytical data, streamlining the drug development process, and ultimately safeguarding product quality and patient safety.
Setting Scientifically-Derived System Suitability Test (SST) Limits
In the pharmaceutical industry, the reliability of analytical data is paramount. System Suitability Testing (SST) serves as a critical gatekeeper, verifying that the entire analytical system—instrument, column, reagents, and software—is performing adequately before sample analysis is initiated [91]. While regulatory bodies mandate SST, the scientific rationale behind setting its acceptance limits is often overlooked. Framed within a broader thesis on robustness testing, this guide objectively compares the traditional, often arbitrary, approach to setting SST limits with methodologies derived from systematic robustness studies and Analytical Quality by Design (AQbD) principles. The comparison demonstrates how scientifically-derived limits enhance method reliability and regulatory compliance during transfer between laboratories, instruments, and analysts.
Understanding System Suitability and Robustness
A System Suitability Test (SST) is a method-specific verification, performed at the beginning of an analytical run, to confirm that the system is suitable for its intended purpose on that specific day [92] [93]. It is not a replacement for Analytical Instrument Qualification (AIQ), which ensures the instrument itself is functioning correctly independent of any method [93]. SST evaluates key chromatographic parameters such as precision (repeatability), resolution, tailing factor, and plate count to ensure the quality of the separation and the accuracy of the results [91].
Robustness, a critical validation parameter, is defined as "a measure of [a method's] capacity to remain unaffected by small, deliberate variations in procedural parameters" [1]. In practice, it investigates the impact of slight changes in method parameters (e.g., mobile phase pH, flow rate, column temperature) on analytical outcomes. The relationship is foundational: the knowledge gained from a well-designed robustness test provides the scientific evidence to set SST limits that ensure the method performs reliably under normal, expected operational variations [92] [9].
Comparative Analysis of Approaches to Setting SST Limits
The following table compares the core methodologies for establishing SST acceptance criteria, highlighting their fundamental principles, advantages, and limitations.
| Approach | Core Principle | Key Advantages | Inherent Limitations |
|---|---|---|---|
| Traditional / Arbitrary | Based on pharmacopoeial general rules or historical data without method-specific experimentation [92]. | Simple and fast to implement; requires minimal resources [92]. | High risk of failure during method transfer; limits may be too strict or too lenient for the specific method [92] [9]. |
| Robustness-Derived | SST limits are deduced from the ranges of chromatographic responses observed during a deliberate, multivariate robustness test [92] [94]. | Provides scientifically justified, method-specific limits; increases confidence in successful method transfer [92] [1]. | Requires more upfront investment in time and resources for experimental design and execution [92]. |
| Analytical QbD (AQbD) | SST limits are set based on the Method Operable Design Region (MODR), established during systematic method development using risk assessment and multivariate studies [9]. | Maximizes method understanding and control; offers regulatory flexibility for changes within the MODR; proactively builds robustness into the method [9]. | Most resource-intensive approach requiring significant expertise in experimental design and data analysis [9]. |
Supporting Experimental Data: A foundational study applied the robustness-derived strategy to a complex liquid chromatography assay for tylosin, an antibiotic with variable sample composition [92]. Using a Plackett-Burman experimental design, the researchers varied multiple factors (e.g., pH, flow rate, temperature) within a realistic range. The resulting data provided a clear, experimental basis for setting SST limits for critical parameters like resolution. The study concluded that this strategy is applicable even for complex samples and recommended using pharmacopoeial limits if they are stricter than those derived from the robustness test [92] [94].
Experimental Protocols for Deriving SST Limits
Robustness Testing Using a Plackett-Burman Design
This screening design is highly efficient for identifying which of many factors have a significant effect on the method, making it ideal for robustness studies [1].
- Step 1: Factor and Level Selection: Identify key method parameters (e.g., buffer pH ±0.2 units, flow rate ±5%, column temperature ±3°C, organic mobile phase composition ±2% absolute) and define realistic "high" and "low" levels for each based on expected variations in routine use [92] [1].
- Step 2: Experimental Execution: Run the experiments as per the design matrix. For a study with 7 factors, a 12-run Plackett-Burman design can be used. Each run involves injecting a standard solution and recording the chromatographic responses (resolution, tailing factor, retention time, etc.) [92] [1].
- Step 3: Data Analysis and SST Limit Setting: Statistically analyze the data (e.g., using multiple linear regression) to identify effects significantly different from noise. The SST limits are then derived from the observed ranges of the critical responses across all experimental runs. For example, the minimum resolution limit can be set to the lowest value observed in any of the robust experiments [92].
The AQbD Approach with MODR Establishment
This enhanced protocol builds on robustness testing, integrating it into a holistic lifecycle approach [9].
- Step 1: Define the Analytical Target Profile (ATP): The process starts by defining the ATP, which outlines the required quality of the measurement (e.g., precision, accuracy) for its intended purpose [95].
- Step 2: Risk Assessment: Use tools like Ishikawa diagrams to identify potential method parameters that could impact the ATP. This prioritizes factors for experimental investigation [9].
- Step 3: Establish the Method Operable Design Region (MODR): Employ a response surface methodology (e.g., Central Composite Design) to model the relationship between critical method parameters and key performance responses. The MODR is the multidimensional combination of parameter ranges where the method meets all performance criteria [9].
- Step 4: Set SST Limits from the MODR: The SST limits are set as the performance boundaries (e.g., minimum resolution, maximum %RSD) observed within the entire MODR, ensuring the system is operating within the proven acceptable range [95] [9].
The logical workflow from experimental design to the establishment of SST limits is summarized in the following diagram.
The Scientist's Toolkit: Essential Research Reagents and Materials
Successful implementation of the protocols above requires specific, high-quality materials. The following table details essential solutions and their functions in the featured experiments.
| Research Reagent / Material | Critical Function in Experiment |
|---|---|
| Pharmaceutical Reference Standard | A high-purity, well-characterized analyte used to prepare the test solutions for both robustness and SST studies. It serves as the benchmark for measuring system performance [93]. |
| Chromatography Column (Multiple Lots) | The stationary phase is a critical parameter. Testing columns from different manufacturing lots during robustness studies helps establish SST limits for retention time and peak shape that account for normal column variability [1]. |
| Mobile Phase Components (Buffer Salts, Organic Solvents) | High-purity solvents and salts are used to prepare the mobile phase. Deliberately varying their composition or pH within specified ranges during robustness testing directly informs SST limits for parameters like retention time and resolution [1]. |
| System Suitability Test Standard | A ready-to-use mixture of the reference standard, and sometimes critical impurities, against which all SST parameters (resolution, tailing, precision) are measured before each analytical run [91]. |
| Plackett-Burman Experimental Design Template | A statistical template or software that defines the specific combination of high and low factor levels for each experimental run, ensuring an efficient and scientifically sound study [92] [1]. |
The choice of methodology for setting System Suitability Test limits has a direct and profound impact on the reliability and cost-effectiveness of an analytical procedure. While the traditional approach may seem expedient, it carries a high risk of failure in transfer and routine use. In contrast, limits derived from systematic robustness testing provide a scientifically defensible foundation, ensuring the method remains suitable under the normal variations expected in any laboratory environment. The AQbD approach represents the pinnacle of this philosophy, building quality and robustness into the method from the outset. For researchers and drug development professionals, adopting these science-based approaches is not merely a regulatory expectation but a strategic investment in developing robust, reliable, and transferable analytical methods.
Corrective Actions for Non-Robust Methods
In the development of organic analytical procedures, the robustness of a method is a critical measure of its capacity to remain unaffected by small, deliberate variations in method parameters and provides an indication of its reliability during normal usage [17]. A non-robust method introduces significant risk, potentially leading to out-of-specification results, failed system suitability tests, and costly method redevelopment, thereby disrupting pharmaceutical development and manufacturing workflows [9]. The paradigm is shifting from traditional, compliance-driven quality-by-testing towards a more proactive, science-based approach known as Quality by Design (QbD) [9]. This article objectively compares the corrective actions available to scientists when a method lacks robustness, framing them within a holistic lifecycle management strategy to ensure method reliability, regulatory compliance, and operational efficiency.
Defining Robustness and the Consequences of Its Failure
What is Method Robustness?
Robustness has been specifically defined by the International Conference on Harmonisation (ICH) as "a measure of its capacity to meet the expected performance requirements during normal usage" [9]. It is tested by introducing deliberate, minor variations into analytical procedure parameters—such as mobile phase pH, column temperature, or flow rate in HPLC—and evaluating the impact on method performance [17] [9]. A method is deemed robust when these small, intentional changes do not significantly affect key performance responses, such as assay results, retention times, or critical resolution [17].
Common Triggers Indicating Non-Robustness
- Failure of System Suitability Testing (SST): The method fails to meet predefined acceptance criteria (e.g., resolution, tailing factor, theoretical plates) during routine use, often when transferred to a new laboratory or instrument [17] [9].
- High Variability in Results: The method yields unacceptably high inter-laboratory or inter-analyst variability during reproducibility studies [17].
- Sensitivity to Minor Parameter Fluctuations: The method's performance is observably affected by small, inevitable changes in environmental conditions or reagent batches that fall within the method's stated operating parameters [9].
A Tiered Approach to Correcting Non-Robust Methods
When a method is found to be non-robust, the response can be structured into three distinct, yet potentially interconnected, tiers: Correction, Corrective Action, and Preventive Action. Understanding the difference between these tiers is fundamental to an effective and sustainable solution [96] [97] [98].
The following workflow outlines the logical progression for diagnosing and addressing non-robust analytical methods:
Tier 1: Correction - Addressing the Immediate Symptom
A Correction is an immediate action taken to eliminate a detected nonconformity [97] [98]. It is a reactive, short-term measure aimed at containing the immediate problem and restoring the workflow, without necessarily addressing the underlying reason for the failure [96].
- Nature: Reactive, temporary fix [98].
- Trigger: A problem has already occurred, such as a failed SST or an out-of-specification result [99] [98].
- Focus: Symptom [98].
- Example in Analytical Chemistry: A method is sensitive to mobile phase pH. During a run, the resolution fails. A correction would be to manually adjust and re-prepare the mobile phase to the exact specified pH and re-run the analysis. This fixes the immediate instance but does not prevent the same issue from recurring if the pH shifts again [96].
Tier 2: Corrective Action - Eliminating the Root Cause
Corrective Action is taken to eliminate the cause of a detected nonconformity and to prevent its recurrence [97]. It is a systematic process that moves beyond the symptom to address the fundamental reason for the non-robustness [96] [100].
- Nature: Reactive, but aimed at a permanent solution [98] [101].
- Trigger: A problem has occurred, and analysis is needed to understand why [98].
- Focus: Root cause of an existing issue [98].
- Process: The corrective action process typically involves:
- Investigation and Root Cause Analysis (RCA): Using tools like Fishbone (Ishikawa) diagrams or the 5 Whys to systematically investigate the failure [96] [99].
- Action Plan Development: Formulating a plan to eliminate the root causes, which may involve process improvements, updated procedures, or personnel training [96].
- Implementation: Executing the corrective action plan [96].
- Effectiveness Check: Monitoring the solution to ensure it is effective in preventing the recurrence of the original nonconformity [96] [99].
- Example in Analytical Chemistry: For the pH-sensitive method, a corrective action would involve a root cause investigation. The RCA might reveal that the pH meter calibration frequency is insufficient. The corrective action would be to revise the standard operating procedure (SOP) for mobile phase preparation to include more frequent pH meter calibration and supplier qualification [100].
Tier 3: Preventive Action - Proactive Risk Mitigation
Preventive Action is taken to eliminate the cause of a potential nonconformity. It is a proactive measure designed to prevent the occurrence of non-robustness in the first place, embodying the principle of "risk-based thinking" [97] [99] [98].
- Nature: Proactive, long-term risk prevention [98] [101].
- Trigger: A potential problem or risk has been identified, even if it has not yet occurred [98].
- Focus: Root cause of a potential issue [98].
- Process: The preventive action process generally involves:
- Identifying Potential Risks: Using risk assessment tools like FMEA (Failure Mode and Effects Analysis) to forecast problems [99] [98].
- Evaluating and Prioritizing Risks: Assessing the severity and likelihood of potential risks [98].
- Implementing Preventive Controls: Putting measures in place to mitigate identified risks [99].
- Example in Analytical Chemistry: A preventive action would be to adopt an Analytical Quality by Design (AQbD) approach for all new method developments. During development, a robustness study using a Plackett-Burman experimental design is proactively conducted to identify critical method parameters and establish a Method Operable Design Region (MODR). This ensures the method is robust before it is ever deployed for routine use, preventing future failures [9].
Table 1: Comparison of Correction, Corrective Action, and Preventive Action for Non-Robust Methods
| Parameter | Correction | Corrective Action | Preventive Action |
|---|---|---|---|
| Definition | Immediate fix to eliminate a detected nonconformity [98] | Action to eliminate the root cause of a detected nonconformity [97] | Action to eliminate the cause of a potential nonconformity [97] |
| Approach | Reactive | Reactive | Proactive [99] |
| Goal | Quick resolution of the immediate issue [96] | Prevent recurrence of the same issue [96] | Prevent occurrence of any potential issue [101] |
| Timeframe | Immediate or short-term [98] | Medium to long-term [98] | Long-term, continuous [98] |
| Typical Tools | N/A (immediate adjustment) | 5 Whys, Fishbone Diagram, 8D [99] | Risk Assessment, FMEA, Trend Analysis, AQbD [9] [99] |
| Impact | Temporary fix [98] | Permanent solution for a specific problem [98] | Systemic improvement and risk reduction [98] |
Experimental Protocols for Robustness Evaluation and Root Cause Analysis
A systematic approach to testing robustness is essential for both diagnosing non-robust methods and for proactively preventing them. The following protocol, based on ICH recommendations and industry best practices, provides a detailed methodology [17] [9].
Protocol: Robustness Screening Using an Experimental Design
1. Selection of Factors and Levels:
- Identify method parameters (factors) most likely to affect performance (e.g., % organic solvent, pH of buffer, column temperature, flow rate) [17].
- For each quantitative factor, select a high (+1) and low (-1) level that represents small but deliberate variations expected during normal use (e.g., nominal pH ± 0.1 units) [17]. The nominal level is often situated in the middle.
Table 2: Example Factor-Level Table for an HPLC Robustness Test
| Factor | Low Level (-1) | Nominal Level (0) | High Level (+1) |
|---|---|---|---|
| A: %Acetonitrile | -1% | Nominal | +1% |
| B: Buffer pH | -0.1 | Nominal | +0.1 |
| C: Column Temp. | -2°C | Nominal | +2°C |
| D: Flow Rate | -0.1 mL/min | Nominal | +0.1 mL/min |
2. Selection of an Experimental Design:
- For screening, two-level designs such as Plackett-Burman (PB) or fractional factorial (FF) designs are most often used [11] [17]. These designs allow for the efficient evaluation of multiple factors (f) in a minimal number of experiments (N), where N is a multiple of 4 [17].
- A PB design is highly recommended when the number of factors is high, as it provides an operationally convenient way to screen for critical parameters [11].
3. Execution of Experiments:
- Execute the experiments in a randomized or anti-drift sequence to minimize the impact of uncontrolled variables (e.g., column aging) [17].
- Measure relevant assay responses (e.g., analyte concentration, impurity level) and System Suitability Test (SST) responses (e.g., critical resolution, retention factor, tailing factor) for each experimental run [17].
4. Data Analysis and Effect Estimation:
- The effect of a factor (Ex) on a response (Y) is calculated as the difference between the average responses when the factor was at its high level and its low level [17]: Ex = (ΣY(+1) / N(+1)) - (ΣY(-1) / N(-1))
- Statistically or graphically (e.g., using a Normal Probability Plot) analyze the effects to identify which factors have a significant influence on the method's performance [17].
5. Drawing Conclusions:
- A factor with a large, significant effect is deemed a critical method parameter. A method is non-robust if a factor has a significant effect on a key assay response [17] [9].
- The results can be used to define SST limits or to refine the method's operating conditions to a region where it is more robust (i.e., within the Method Operable Design Region) [9].
The following diagram visualizes this multi-step workflow for conducting a robustness test:
The Scientist's Toolkit: Essential Reagents and Materials for Robustness Studies
Executing a rigorous robustness study requires specific chemical reagents and analytical materials. The following table details key solutions and materials, with their critical functions in the context of these experiments.
Table 3: Key Research Reagent Solutions and Materials for Robustness Evaluation
| Item | Function / Explanation |
|---|---|
| High-Purity Mobile Phase Solvents | Consistent organic modifier grade (e.g., HPLC-grade Acetonitrile/Methanol) is critical. Variations in purity or UV cutoff can significantly affect baseline noise, retention times, and detection [17]. |
| Buffer Salts & pH Standard Solutions | Used to prepare mobile phase buffers. Precise pH is often a critical parameter. High-purity salts and traceable pH standard solutions are essential for reproducibility and accurate factor-level setting [17]. |
| Chromatographic Columns (Multiple Lots/Brands) | A key qualitative factor to test. Evaluating the method's performance on columns from different manufacturing lots or from an alternative supplier is a core part of assessing ruggedness and ensuring transferability [17]. |
| System Suitability Test (SST) Reference Mixture | A standardized mixture of analytes and potential impurities. It is used in every experiment to monitor critical performance criteria like resolution, tailing factor, and plate number, serving as the primary source of response data [17] [9]. |
| Stable Analytical Reference Standards | Highly pure and well-characterized samples of the analytes. They are required for preparing calibration standards and the SST mixture to ensure that the responses measured are accurate and attributable to the parameter variations, not reference material instability [9]. |
Addressing non-robust analytical methods requires a nuanced understanding of the different tiers of intervention. While Corrections are necessary for immediate containment, they are insufficient for long-term reliability. Sustainable solutions are achieved through systematic Corrective Actions that target root causes, ultimately preventing recurrence. The most advanced and efficient paradigm, however, is rooted in Preventive Action, embodied by the Analytical Quality by Design (AQbD) framework. By proactively defining a Method Operable Design Region (MODR) through structured robustness testing during method development, organizations can build robustness directly into their methods from the outset [9]. This objective comparison demonstrates that transitioning from a reactive to a proactive stance is not merely a regulatory expectation but a strategic imperative that enhances scientific understanding, reduces risk, and drives continuous improvement in pharmaceutical development.
Preventing Overfitting and Ensuring Real-World Applicability
In the domains of artificial intelligence (AI) and analytical science, the bridge between theoretical model performance and real-world applicability is built upon the principles of robustness and generalization. Overfitting—a scenario where a model performs exceptionally well on training data but fails to generalize to new, unseen data—represents a fundamental barrier to this goal [102] [103]. For researchers, scientists, and drug development professionals, an overfit model is not merely a statistical curiosity; it is a significant risk that can lead to misdiagnosis in healthcare, poor investment strategies in finance, and safety-critical failures in autonomous systems [103]. Similarly, in analytical procedure development, a method that is not robust—whose performance is significantly affected by small, deliberate variations in method parameters—fails its fundamental purpose [17].
The recent modernization of regulatory guidelines, such as the International Council for Harmonisation (ICH) Q2(R2) and ICH Q14, underscores a critical industry shift. These guidelines move from a prescriptive, "check-the-box" validation approach to a more scientific, lifecycle-based model that emphasizes a proactive, risk-based strategy for ensuring method robustness from development through deployment [14]. This article provides a comparative guide to the methodologies and metrics essential for preventing overfitting and ensuring that AI models and analytical procedures deliver reliable, actionable results in practice, with a specific focus on their application within organic analytical procedures research.
Understanding and Diagnosing the Problem
Core Definitions and Characteristics
- Overfitting: In machine learning, overfitting occurs when a model learns not only the underlying patterns in the training data but also the noise and random fluctuations [103]. Key characteristics include a significant gap between training and validation errors, where training error decreases while validation error increases, indicating the model is memorizing rather than learning generalizable patterns [102].
- Robustness: In the context of analytical procedures, robustness (or ruggedness) is formally defined as "a measure of its capacity to remain unaffected by small but deliberate variations in method parameters" [17]. It provides an indication of the procedure's reliability during normal usage and is a formal part of method validation.
Causes and Consequences
The factors leading to overfitting and lack of robustness are often interrelated. A primary cause is insufficient or poor-quality training data; small or noisy datasets make it difficult for models to learn generalizable patterns, causing them to memorize the training set instead [102] [103]. Another major factor is excessive model complexity, where models with too many parameters relative to the dataset size can fit even the noise in the data [102] [103]. A lack of regularization techniques and an over-reliance on specific patterns in the training data further exacerbate the problem [102].
The real-world consequences are severe. In pharmaceutical development, a lack of robustness can lead to analytical method transfer failures between laboratories, potentially halting production or compromising quality control [17]. For AI systems, overfitting can render a model ineffective and untrustworthy, leading to inaccurate predictions that undermine research findings and decision-making processes [103] [104].
Comparative Analysis of Prevention Techniques
A multi-faceted approach is required to combat overfitting and ensure robustness. The following techniques, when applied judiciously, form a powerful defense.
Technical Mitigations for Machine Learning
Table 1: Comparison of Techniques to Prevent Overfitting in Machine Learning
| Technique | Core Principle | Best Suited For | Key Advantages |
|---|---|---|---|
| Regularization (L1/L2) [103] | Adds a penalty to the loss function to discourage complex models. | Linear models, neural networks. | Encourages sparsity (L1) or discourages large weights (L2); mathematically well-founded. |
| Dropout [102] [103] | Randomly "dropping" neurons during training. | Neural networks. | Prevents co-adaptation of features; forces the network to learn redundant representations. |
| Early Stopping [103] | Halting training when validation performance degrades. | Iterative models (e.g., neural networks). | Simple to implement; prevents the model from continuing to memorize training data. |
| Pruning [103] | Removing unnecessary model components (e.g., neurons, tree branches). | Decision trees, neural networks. | Reduces model complexity and size; can improve inference speed and interpretability. |
| Data Augmentation [102] [103] | Artificially expanding the training set via transformations. | Computer vision, natural language processing. | Increases effective dataset size and diversity; teaches the model invariant properties. |
| Cross-Validation [102] | Rotating data partitions for training and validation. | All model types, especially with limited data. | Provides a more reliable estimate of model generalization performance. |
Methodological Frameworks for Analytical Science
For analytical procedures, robustness is engineered into the method through careful design and validation.
- Analytical Target Profile (ATP) and Risk-Based Approach: ICH Q14 introduces the ATP as a prospective summary of the method's intended purpose and required performance characteristics [14]. Defining the ATP at the start ensures the method is designed to be fit-for-purpose. A risk-based approach is then used to identify critical method parameters that could impact the ATP, guiding subsequent robustness testing [105].
- Experimental Design for Robustness Testing: Robustness is formally tested by introducing small, deliberate variations in method parameters and evaluating their influence on the results [17]. Standard practice involves:
- Selection of Factors and Levels: Critical method parameters (e.g., mobile phase pH, column temperature in HPLC) are selected, and extreme levels representative of expected inter-laboratory variation are chosen.
- Selection of an Experimental Design: Efficient screening designs, such as Plackett-Burman or fractional factorial designs, are used to evaluate multiple factors simultaneously with a minimal number of experiments [17].
- Statistical Analysis of Effects: The effect of each factor on the responses (e.g., assay content, resolution) is estimated and analyzed to identify any significant influences that threaten robustness [17].
Experimental Protocols and Data-Driven Comparisons
Case Study: Robustness and Feasibility Prediction in Organic Synthesis
A groundbreaking study published in Nature Communications demonstrates the powerful synergy of high-throughput experimentation (HTE) and Bayesian deep learning to address reaction feasibility and robustness [31].
Experimental Protocol:
- High-Throughput Experimentation: An automated HTE platform conducted 11,669 distinct acid-amine coupling reactions within 156 instrument hours. This created an extensive dataset covering a broad chemical space at a volumetric scale (200–300 μL) relevant for industrial delivery [31].
- Bayesian Deep Learning Model: A Bayesian Neural Network (BNN) was trained on the HTE data. BNNs are inherently capable of quantifying predictive uncertainty, providing not just a prediction but also a measure of confidence.
- Uncertainty Disentanglement: The model's uncertainty was broken down into its components (e.g., model uncertainty, data uncertainty). This fine-grained analysis allows for the identification of out-of-domain reactions and the evaluation of reaction robustness against environmental factors [31].
- Active Learning: The uncertainty estimates were used to guide an active learning strategy, intelligently selecting which experiments to perform next to maximize knowledge gain.
Performance Comparison:
Table 2: Performance Metrics of the Bayesian Deep Learning Model for Reaction Feasibility Prediction [31]
| Metric | Performance Achieved | Significance |
|---|---|---|
| Prediction Accuracy | 89.48% | Benchmark accuracy for predicting reaction feasibility across a broad chemical space. |
| F1 Score | 0.86 | Indicates a strong balance between precision and recall in classification. |
| Data Efficiency | ~80% reduction in data requirements | The active learning strategy, guided by uncertainty, significantly reduces the amount of experimental data needed. |
The study found that the intrinsic data uncertainty derived from the BNN could be correlated with reaction robustness or reproducibility. This provides a practical, predictive framework for process engineers to pre-emptively identify and avoid sensitive reactions that are difficult to scale up, thereby designing more robust industrial processes [31].
Comparison of Statistical Methods for Robustness
In analytical science, the statistical methods used to evaluate data from sources like proficiency testing (PT) must themselves be robust to outliers, especially with small sample sizes.
Table 3: Robustness Comparison of Statistical Methods for Mean Estimation [106]
| Method | Principle | Breakdown Point | Efficiency | Robustness to Skewness |
|---|---|---|---|---|
| Algorithm A (Huber’s M-estimator) [106] | Modifies deviant observations iteratively. | ~25% | ~97% | Shows the largest deviations with skewed data. |
| Q/Hampel Method [106] | Combines Q-method for standard deviation with Hampel’s M-estimator. | 50% | ~96% | More robust than Algorithm A, but less than NDA. |
| NDA Method [106] | Constructs a centroid probability density function from laboratory data. | 50% | ~78% | Markedly more robust to asymmetry (skewness), particularly in small samples. |
A 2025 study comparing these methods concluded that the NDA method, while less efficient, possesses higher robustness, especially in the face of asymmetric data distributions common in real-world datasets [106]. This highlights a direct trade-off between robustness and efficiency that researchers must navigate based on their data's characteristics.
The Scientist's Toolkit: Essential Research Reagents and Materials
Table 4: Key Research Reagent Solutions for High-Throughput Experimentation in Organic Chemistry [31]
| Item | Function in the Experimental Context |
|---|---|
| Automated HTE Platform (e.g., ChemLex's CASL-V1.1) | Enables the rapid, parallel execution of thousands of distinct chemical reactions with minimal manual intervention. |
| Diverse Substrate Libraries (Acids, Amines) | Provides a structurally varied and representative exploration of chemical space, which is critical for building generalizable models. |
| Condensation Reagents & Bases | Essential reaction components whose variation is included in the condition space to assess their impact on reaction outcome and robustness. |
| LC-MS (Liquid Chromatography-Mass Spectrometry) | The core analytical instrument for high-throughput, uncalibrated yield determination and reaction analysis. |
| Bayesian Deep Learning Software Framework (e.g., TensorFlow Probability, PyTorch) | Provides the tools to build BNNs capable of uncertainty quantification, which is fundamental for assessing robustness and enabling active learning. |
Integrated Workflow for Robustness Assurance
The following diagram synthesizes the concepts from machine learning and analytical science into a unified workflow for developing robust and reliable models and methods.
Integrated Workflow for Robustness Assurance
Preventing overfitting and ensuring real-world applicability is not achieved through a single technique but through a holistic, integrated strategy. As demonstrated, the combination of Bayesian deep learning for uncertainty-aware prediction and rigorous, experimentally-designed robustness testing provides a powerful framework for building reliable systems. The regulatory shift towards a lifecycle management approach, as embodied in ICH Q14 and Q2(R2), reinforces the need to build quality in from the start—whether developing an analytical procedure or a machine learning model [105] [14].
For researchers in organic analytical procedures, this means moving beyond simply achieving high training accuracy or passing a one-time validation. It requires a proactive commitment to understanding the boundaries and limitations of one's methods and models, leveraging high-quality data, robust statistical evaluation, and continuous monitoring to ensure that performance in the laboratory translates faithfully to performance in the real world.
Validation Integration, Comparative Analysis, and Lifecycle Management
Integrating Robustness Testing into Method Validation Protocols
In the pharmaceutical industry, the unwavering reliability of analytical methods is a non-negotiable pillar of product quality and patient safety. Among the various validation parameters, robustness testing stands out as a critical, proactive assessment of a method's resilience. It is formally defined as a measure of an analytical procedure's capacity to remain unaffected by small, deliberate variations in method parameters and provides an indication of its reliability during normal usage [5]. This evaluation is fundamentally about challenging the method with the minor, inevitable fluctuations that occur in any real-world laboratory environment—such as slight changes in mobile phase pH, column temperature, or flow rate—before those variations can cause method failure, producing out-of-specification results and costly analytical investigations.
The regulatory landscape for robustness testing is clearly outlined in major guidelines. The International Council for Harmonisation (ICH) Q2(R2) guideline defines robustness as "a measure of its capacity to meet the expected performance requirements during normal use," which is tested by deliberate variations of analytical procedure parameters [14] [9]. Similarly, the United States Pharmacopeia (USP) describes it as the ability of the method to remain unaffected by small changes in operational parameters [1]. A crucial distinction exists between robustness and the related concept of ruggedness. While robustness focuses on internal method parameters (conditions specified in the method itself), ruggedness assesses the method's reproducibility under external, real-world variations, such as different analysts, instruments, laboratories, or days [5] [1]. Understanding and systematically evaluating both dimensions is essential for developing truly reliable analytical methods.
Core Principles and Regulatory Expectations
The Shift to a Lifecycle and Risk-Based Approach
The framework for analytical method validation is undergoing a significant modernization, moving from a static, "check-the-box" exercise to a dynamic, science- and risk-based lifecycle approach [14]. The simultaneous release of the revised ICH Q2(R2) "Validation of Analytical Procedures" and the new ICH Q14 "Analytical Procedure Development" guidelines embodies this shift [14] [107]. These updated guidelines emphasize building quality into the method from the very beginning of development rather than simply testing for it at the end.
A cornerstone of this modernized approach is the Analytical Target Profile (ATP). Introduced in ICH Q14, the ATP is a prospective summary of the method's intended purpose and its required performance criteria [14] [107]. By defining the ATP at the outset, method development and validation, including robustness testing, become a targeted effort to ensure the procedure is "fit-for-purpose." This lifecycle model, supported by principles of Quality by Design (QbD) and Analytical QbD (AQbD), integrates robustness testing as a continuous process rather than a one-time event, allowing for more flexible and science-based post-approval changes [9].
Regulatory Definitions and Requirements
Adherence to regulatory guidelines is paramount. The following table summarizes key definitions and the positioning of robustness within current regulatory frameworks:
Table 1: Regulatory Definitions of Robustness and Ruggedness
| Term | Definition | Primary Regulatory Source |
|---|---|---|
| Robustness | "The measure of a procedure's capacity to remain unaffected by small, deliberate variations in method parameters and provides an indication of its reliability during normal use." [1] | ICH Q2(R2), USP ⟨1225⟩ |
| Ruggedness | "The degree of reproducibility of results under a variety of conditions, such as different laboratories, analysts, instruments, etc." [1] | USP ⟨1225⟩ (Note: The term is being harmonized with ICH's "intermediate precision") |
| Method Operable Design Region (MODR) | "A multidimensional region where all study factors in combination provide suitable mean performance and robustness, ensuring procedure fitness for use." [9] | ICH Q8 (Analogical application from process to analytical design space) |
Robustness testing is not merely a compliance activity; it is a fundamental investment in the method's long-term viability. It directly supports the establishment of meaningful system suitability tests (SST) and defines a controlled operational range for method parameters, thereby reducing the risk of failure during routine use and technical transfer to quality control (QC) laboratories [1] [107].
Experimental Design Strategies for Robustness Evaluation
Selecting an appropriate experimental design is crucial for obtaining meaningful, actionable data from robustness studies. While the traditional one-factor-at-a-time (OFAT) approach can provide some insights, it is inefficient and incapable of detecting interactions between factors [9]. Modern robustness testing relies on multivariate experimental designs, which allow for the simultaneous evaluation of multiple parameters and their potential interactions in a structured and resource-efficient manner [11].
Screening designs are ideal for robustness studies as they efficiently identify the few critical factors from a larger set that significantly impact method performance. The three most common types are compared below:
Table 2: Comparison of Multivariate Screening Designs for Robustness Studies
| Design Type | Description | Best Use Case | Advantages | Limitations |
|---|---|---|---|---|
| Full Factorial | Evaluates all possible combinations of factors at their high and low levels. For k factors, it requires 2k runs. [1] | Ideal for evaluating a small number of factors (e.g., ≤ 4). [11] | Provides a complete picture of all main effects and interaction effects without confounding. [1] | The number of runs increases exponentially with more factors, becoming impractical. [1] |
| Fractional Factorial | Studies a carefully chosen subset (a fraction) of the full factorial combinations. [1] | Evaluating a moderate number of factors (e.g., 5-8) where some interaction effects are anticipated. [1] | Significantly reduces the number of runs required while still providing information on main and some interaction effects. [1] | Effects are aliased (confounded), meaning some interactions cannot be distinguished from main effects. [1] |
| Plackett-Burman | A highly efficient screening design where the number of runs is a multiple of 4. [1] [11] | Screening a large number of factors (e.g., 5-11) to identify the most critical ones, assuming interactions are negligible. [11] | The most economical design for evaluating a high number of factors in a minimal number of experimental runs. [11] | Cannot estimate interaction effects between factors; it is strictly for screening main effects. [1] [11] |
A Standard Workflow for Conducting a Robustness Study
Implementing a robustness study is a systematic process. The following workflow, applicable to chromatographic methods like HPLC, outlines the key stages from planning to establishing control strategies.
Figure 1: Robustness testing workflow from planning to control.
Step 1: Define Study Scope and Identify Parameters The process begins by reviewing the analytical procedure to identify all method parameters that could plausibly vary during routine use. For a chromatographic method, this typically includes factors like mobile phase pH (± 0.1-0.2 units), buffer concentration (± 5-10%), column temperature (± 2-5°C), flow rate (± 5-10%), and wavelength (± 2-3 nm) [1] [5]. The selection should be guided by the ATP and prior knowledge from method development.
Step 2: Set Variation Ranges and Select Design For each parameter, define a realistic high and low level that represents the expected variation in a QC lab. The ranges should be small but deliberate. The choice of experimental design depends on the number of parameters. A Plackett-Burman design is often the preferred choice for an initial screening of numerous factors due to its efficiency [11].
Step 3: Execute Experiments and Analyze Data Execute the experimental runs as per the design matrix. Critical performance responses—such as retention time, peak area, resolution, tailing factor, and theoretical plates—are recorded for each run. The data is then analyzed using statistical tools (e.g., ANOVA, half-normal probability plots, Pareto charts) to identify which parameter variations have a statistically significant effect on the method's performance [1] [11].
Step 4: Define the MODR and Implement Controls Based on the analysis, a Method Operable Design Region (MODR) can be established. This is the multidimensional combination of parameter ranges within which the method performs as required [9]. The results directly inform the creation of the method's system suitability tests, ensuring the method's validity is checked against its most sensitive parameters every time it is run [1].
Case Study: Implementing a Risk-Based Robustness Assessment
A practical example of integrating robustness into a modern validation paradigm comes from a program implemented at Bristol Myers Squibb (BMS) [107]. This program embeds robustness within a larger, risk-assessment-driven framework for late-stage method development.
The BMS workflow involves developing fit-for-purpose method conditions, followed by formal robustness studies on the proposed established conditions (ECs) [107]. A detailed risk assessment is then conducted, evaluating the method against the ATP. The assessment uses templated tools, including spreadsheets with predefined lists of potential method concerns and Ishikawa (fishbone) diagrams to visually cluster variables related to materials, method, machine, measurement, humanpower, and Mother Nature [107]. This systematic review identifies gaps and residual risks. The outcome is a clear action plan: either the method is deemed ready for registrational validation, or additional work is defined to mitigate identified risks, leading to a re-evaluation cycle [107]. This approach ensures that robustness is not studied in isolation but is a key piece of evidence demonstrating that the method is simple, robust, and efficient for its intended commercial QC use.
Essential Research Reagent Solutions and Materials
Successful execution of robustness studies requires not only a sound design but also high-quality, consistent materials. The following table details key reagents and solutions critical for these studies.
Table 3: Key Research Reagent Solutions for Robustness Testing
| Item | Function in Robustness Testing | Critical Quality Attributes |
|---|---|---|
| Chromatographic Solvents & Buffers | Form the mobile phase, which is a primary factor in separation. Variations in pH, composition, and buffer concentration are tested. | High purity (HPLC/LC-MS grade), low UV absorbance, specified pH tolerance, and low particulate matter. [5] |
| Chromatography Columns | The stationary phase is a major source of variability. Testing different column lots/brands is a key part of robustness. | Specified lot-to-lot reproducibility, L# of theoretical plates, peak asymmetry, and retention time stability. [1] [5] |
| Reference Standards | Used to prepare solutions for injection to measure performance responses (retention time, peak area, etc.). | Certified purity and concentration, stability under study conditions, and proper storage and handling. [14] |
| System Suitability Test (SST) Mix | A mixture of analytes and/or related compounds used to verify the system's performance before the robustness study runs. | Must be stable and provide consistent responses for key metrics like resolution, tailing factor, and plate count. [1] |
Integrating a scientifically rigorous robustness study into method validation protocols is a critical defense against the variability inherent in pharmaceutical analysis. By adopting a modern, risk-based lifecycle approach—guided by ICH Q2(R2) and Q14, and implemented through structured experimental designs—scientists can move beyond mere compliance. This proactive strategy enables the development of truly robust methods, ensuring they remain reliable in the hands of different analysts, across various instruments, and over time. The result is enhanced product quality, reduced investigation costs, and strengthened regulatory submissions, ultimately safeguarding the patient supply chain.
Robustness as Part of the Analytical Procedure Lifecycle (ICH Q14)
The International Council for Harmonisation (ICH) Q14 guideline, adopted in November 2023, marks a fundamental shift in pharmaceutical analytics, establishing a first-of-its-kind independent regulatory framework for analytical procedure development [108] [109]. This guideline embeds structured, risk-based, and lifecycle-oriented approaches directly into analytical science, moving away from traditional, static method development toward flexible, scientifically justified systems. A core principle within this new paradigm is the proactive assessment and integration of method robustness throughout the entire analytical procedure lifecycle [109].
Under ICH Q14, the robustness of an analytical procedure is defined as "a measure of its capacity to remain unaffected by small but deliberate variations in procedural parameters listed in the documentation" [1]. This indicates the method's inherent reliability and suitability during normal use. The guideline encourages an enhanced approach that incorporates Quality by Design (QbD) principles, where robustness is not merely tested post-development but is built into the method from the outset through systematic experimentation and risk assessment [108] [109]. This represents a paradigm shift from viewing robustness as a retrospective validation checkpoint to treating it as a foundational element of prospective, knowledge-driven development.
The ICH Q14 Lifecycle Approach to Robustness
Integrating Robustness from Development to Commercial Control
The ICH Q14 guideline promotes a dynamic, science-driven lifecycle approach that aligns analytical development with the principles established in ICH Q8-Q12 for product and process development [109]. The lifecycle management of an analytical procedure, including its robustness, encompasses several key stages:
- Initial Development and ATP Definition: The process begins with defining an Analytical Target Profile (ATP), which outlines the required quality of the reportable value and links the analytical procedure to its intended purpose [109]. The ATP defines the performance criteria—such as accuracy, precision, and specificity—that the method must meet, setting the target for a robust method [108].
- Systematic Method Development and Risk Assessment: Using QbD principles, developers identify potential Critical Method Parameters (CMPs) and experimentally establish their Proven Acceptable Ranges (PAR) or a Method Operable Design Region (MODR) [108] [109]. The MODR is a particularly powerful concept; it defines the "combination of analytical procedure parameter ranges within which the analytical procedure performance criteria are fulfilled and the quality of the measured result is assured" [109]. Changes within the MODR do not require regulatory re-approval, offering significant flexibility.
- Validation and Continuous Verification: Under the enhanced approach, validation is not a one-time event. Methods are validated against their ATPs, and continuous verification is maintained as part of lifecycle management [108]. This ensures the method, including its robustness, remains fit-for-purpose over time, even amid changes in raw materials, equipment, or process conditions.
- Change Management within the Design Space: Supporting the lifecycle approach is continuous monitoring of analytical methods through System Suitability Tests (SSTs) and other control measures [108]. This data-driven oversight helps quickly identify out-of-trend (OOT) performance and facilitates root cause analysis, ensuring ongoing robustness and reducing the likelihood of method failure.
Robustness Workflow in the Analytical Procedure Lifecycle
The following diagram illustrates the integrated, cyclical process of managing robustness throughout the analytical procedure lifecycle as advocated by ICH Q14:
Experimental Designs for Assessing Robustness
Comparison of Multivariate Screening Designs
A critical advancement promoted by ICH Q14 is the use of multivariate experimental designs for robustness studies, which are far more efficient and informative than the traditional univariate (one-variable-at-a-time) approach [1]. These designs allow for the simultaneous variation of multiple method parameters, enabling the identification of factor interactions that would otherwise remain undetected. For robustness testing, screening designs are particularly valuable for identifying the critical factors that affect method performance among a larger set of potential parameters [1].
Table 1: Comparison of Multivariate Screening Designs for Robustness Studies
| Design Type | Key Principle | Number of Runs for k Factors | Key Advantages | Key Limitations | Best Suited For |
|---|---|---|---|---|---|
| Full Factorial | Measures all possible combinations of factors [1] | 2k (e.g., 4 factors = 16 runs) [1] | No confounding of effects; identifies all interactions [1] | Number of runs becomes prohibitive with many factors [1] | Studies with a limited number of factors (typically ≤5) [1] |
| Fractional Factorial | Carefully chosen subset (fraction) of full factorial combinations [1] | 2k-p (e.g., 9 factors in 32 runs) [1] | Highly efficient for investigating many factors [1] | Effects are aliased (confounded) with other effects [1] | Screening a larger number of factors where some interaction confounding is acceptable [1] |
| Plackett-Burman | Very economical designs in multiples of four runs [1] | Multiples of 4 (e.g., for 11 factors: 12 runs) [1] | Maximum efficiency for estimating main effects only [1] | Cannot estimate interactions; only identifies critical main effects [1] | Initial screening of many factors to identify the few critical ones [1] |
Detailed Experimental Protocol for a Robustness Study
The following protocol outlines a standardized methodology for conducting a robustness study for a chromatographic method, such as High-Performance Liquid Chromatography (HPLC), in alignment with ICH Q14 principles.
Step 1: Parameter Selection and Range Definition
- Activity: Identify potential CMPs using risk assessment tools (e.g., Ishikawa diagrams, FMEA) based on prior knowledge and method development data [108]. Common parameters for HPLC include mobile phase pH (±0.1-0.2 units), buffer concentration (±5-10%), column temperature (±2-5°C), flow rate (±5-10%), and detection wavelength (±2-5 nm) [1].
- Output: A finalized list of factors with realistic high and low levels representing expected variations in a regulated laboratory environment.
Step 2: Experimental Design and Execution
- Activity: Select an appropriate screening design (e.g., Fractional Factorial or Plackett-Burman) from Table 1 based on the number of factors. Use software to generate the randomized run order. Prepare samples from a homogeneous, representative batch of drug substance or product and execute the experiments as per the design matrix [1].
- Output: A complete dataset of quality responses (e.g., retention time, peak area, resolution, tailing factor) for each experimental run.
Step 3: Data Analysis and MODR Definition
- Activity: Analyze data using statistical software. Perform multiple linear regression to model the relationship between the varied parameters and the critical quality responses. Identify parameters with statistically significant effects (p-value < 0.05) on the responses.
- Output: A statistical model defining the MODR or PAR for each critical parameter, ensuring all quality attributes meet the ATP criteria within these ranges [108] [109].
Step 4: Control Strategy and Documentation
- Activity: Document the MODR/PAR as part of the method's Established Conditions (ECs) in regulatory submissions [108]. Incorporate key robustness findings into the analytical control strategy, such as setting appropriate system suitability test criteria [1] [108].
- Output: A robust analytical procedure with a justified control strategy, ready for validation and implementation.
Statistical Tools for Robustness Evaluation
Advanced Statistical Methods for Robust Data Analysis
The evaluation of robustness data requires statistical methods that are not only powerful but also resistant to the influence of outliers, which are not uncommon in extensive experimental datasets. ICH Q14 emphasizes the use of statistical and digital tools, including multivariate statistics and software support, to define the design space and analyze robustness [109].
Robust Principal Component Analysis (PCA): A study comparing classic PCA with robust PCA variants for evaluating API impurities found that robust PCA based on projection pursuit was the most effective method for outlier identification, detecting six outliers where other methods found only five [110]. This superior performance helps reduce standard uncertainty and guarantees a more accurate certified reference material value, directly contributing to method reliability.
Comparison of Robust Statistical Estimators: A 2025 study compared the robustness of three statistical methods—Algorithm A (Huber’s M-estimator), Q/Hampel, and the NDA method—in the context of proficiency test (PT) data analysis, which shares similarities with robustness studies [106]. The key findings are summarized in the table below.
Table 2: Comparison of Robust Statistical Methods for Mean Estimation
| Method | Underlying Principle | Breakdown Point | Efficiency | Relative Robustness to Outliers | Key Characteristic |
|---|---|---|---|---|---|
| Algorithm A | Huber's M-estimator [106] | ~25% [106] | ~97% [106] | Low | Sensitive to minor modes; unreliable with >20% outliers [106] |
| Q/Hampel | Q-method for SD + Hampel’s redescending M-estimator [106] | 50% [106] | ~96% [106] | Medium | Highly resistant to minor modes far from the mean [106] |
| NDA | Models data as probability density functions; least-squares centroid [106] | 50% [106] | ~78% [106] | High | Most robust to asymmetry, especially in small samples; strongest down-weighting of outliers [106] |
The study clearly demonstrates a trade-off between robustness and efficiency [106]. While the NDA method is the most robust, particularly in small datasets and asymmetric distributions, it has lower statistical efficiency. The choice of method should be guided by the expected data characteristics, with robust methods like NDA and Q/Hampel being preferable when outliers or non-normal distributions are a concern in robustness studies.
The Scientist's Toolkit for Robustness Studies
Implementing a QbD-based robustness study requires a specific set of conceptual and practical tools. The following table details these essential components.
Table 3: Essential Toolkit for Conducting ICH Q14-Compliant Robustness Studies
| Tool Category | Tool Name | Brief Function/Explanation |
|---|---|---|
| Conceptual Framework | Analytical Target Profile (ATP) [108] [109] | The foundation; defines the required quality of the measurement, guiding all development and robustness activities. |
| Quality by Design (QbD) [108] [109] | The overarching philosophy of building in quality prospectively, rather than testing for it retrospectively. | |
| Analytical Procedure Lifecycle [108] [109] | The understanding that a method is managed from development through retirement, with continuous monitoring. | |
| Risk Management Tools | Ishikawa Diagram [108] | A visual tool (fishbone diagram) used to brainstorm and identify potential method parameters (CMPs) that may impact robustness. |
| Failure Mode and Effects Analysis (FMEA) [108] | A systematic, proactive method for evaluating a process to identify where and how it might fail and assessing the relative impact of different failures. | |
| Experimental Tools | Design of Experiments (DoE) [1] [109] | A systematic statistical approach to determine the relationship between factors affecting a process and the output of that process. |
| Multivariate Screening Designs [1] | Specific types of DoE (e.g., Fractional Factorial, Plackett-Burman) used to efficiently screen many factors in robustness studies. | |
| Statistical & Software Tools | Statistical Software | Essential for generating experimental designs, analyzing results, building models, and creating visualizations of the MODR. |
| Robust Statistical Methods [110] [106] | Techniques (e.g., Robust PCA, M-estimators) used to analyze data in a way that is less sensitive to outliers. | |
| Knowledge Management | Established Conditions (ECs) [108] | Legally binding method parameters set during development; changes to them require regulatory management. |
| Post-Approval Change Management Protocol (PACMP) [108] | A proactive plan for managing future changes to the method within the approved design space. |
The ICH Q14 guideline redefines robustness from a standalone validation characteristic to an integral component of a holistic analytical procedure lifecycle. This paradigm shift, supported by Quality by Design principles, systematic experimentation, and advanced statistical tools, enables the development of more reliable, flexible, and future-proof analytical methods. The enhanced approach, while requiring greater initial investment in development, pays significant dividends through reduced method-related investigations, greater regulatory flexibility, and enhanced patient safety by ensuring consistent product quality [108] [109]. As the pharmaceutical industry continues to adopt ICH Q14, the focus on proactive robustness assessment will undoubtedly become the cornerstone of modern pharmaceutical analytics.
In the field of organic analytical procedures, particularly within pharmaceutical research and development, the reliability of a method is paramount. Robustness testing serves as a critical validation step, defined as "the capacity of an analytical procedure to remain unaffected by small but deliberate variations in method parameters" [17] [49]. This measure indicates the method's reliability during normal usage and provides an indication of its suitability when transferred between laboratories, instruments, or analysts [11]. For researchers and drug development professionals, selecting the appropriate experimental strategy to assess robustness—either the traditional One-Factor-at-a-Time (OFAT) approach or systematic multivariate methods—directly impacts method reliability, regulatory compliance, and development efficiency.
The fundamental question addressed in this comparative analysis is whether traditional OFAT approaches provide sufficient reliability for modern analytical science or if the statistically-driven multivariate methodologies offer superior robustness assessment. This guide objectively examines both approaches through their underlying principles, experimental protocols, and practical applications to inform strategic decision-making in analytical method development.
Fundamental Principles and Definitions
One-Factor-at-a-Time (OFAT) Approach
The OFAT approach, also known as the classical or hold-one-factor-at-a-time strategy, involves varying a single factor while maintaining all other factors constant at fixed levels [111] [112]. After observing the response, the modified factor is returned to its original level before proceeding to vary the next factor. This sequential process continues until all factors of interest have been tested independently [111].
- Historical Context: OFAT has a long history as one of the earliest experimental strategies employed in various scientific fields including chemistry, biology, and engineering [111]. Its popularity stemmed from straightforward implementation without requiring complex experimental designs or advanced statistical analysis [111].
- Multiple OFAT: An extension of this approach, Multiple OFAT, involves testing several factors independently but in succession, where one factor is fully explored, its optimal level identified, and the process repeated for subsequent factors [112]. While this variant still cannot capture interaction effects, it represents an incremental improvement over basic OFAT.
Multivariate Approaches (Design of Experiments)
Multivariate approaches, collectively referred to as Design of Experiments (DOE), constitute a systematic and structured framework for simultaneously investigating the relationship between multiple input factors and output responses [111]. Unlike OFAT, DOE methodologies intentionally vary multiple factors concurrently according to predetermined experimental patterns, enabling comprehensive system characterization.
Key Principles: DOE is built upon three fundamental statistical principles [111]:
- Randomization: Conducting experimental runs in random order to minimize the impact of lurking variables and systematic biases.
- Replication: Repeating experimental runs under identical conditions to estimate experimental error and improve effect estimation precision.
- Blocking: Grouping experimental runs to account for known sources of variability (e.g., different operators, instruments, or batches).
Core Methodologies: Multivariate approaches encompass several specialized designs [111] [11]:
- Factorial Designs: Systematically examine all possible combinations of factor levels to estimate both main effects and interaction effects.
- Response Surface Methodology (RSM): Models relationships between multiple factors and responses to identify optimal conditions.
- Screening Designs (e.g., Plackett-Burman): Efficiently identify the most influential factors from a large set with minimal experimental runs.
Comparative Analysis: OFAT vs. Multivariate Approaches
Characteristic Differences and Performance Outcomes
Table 1: Fundamental characteristics comparison between OFAT and multivariate approaches
| Characteristic | OFAT Approach | Multivariate Approaches |
|---|---|---|
| Experimental Structure | Sequential factor variation | Simultaneous factor variation |
| Interaction Detection | Cannot detect factor interactions | Explicitly measures interaction effects |
| Resource Efficiency | Low efficiency; requires many runs for multiple factors | High efficiency; maximizes information per experimental run |
| Statistical Foundation | Limited statistical basis; no error estimation | Strong statistical foundation with error quantification |
| Optimal Condition Identification | Suboptimal; may miss true optimum due to ignored interactions | Systematic optimization through response modeling |
| Assumptions | Assumes factor independence; no interactions | Accounts for potential factor interdependencies |
Table 2: Experimental requirements and outcomes comparison
| Parameter | OFAT Approach | Multivariate Approaches |
|---|---|---|
| Typical Experimental Runs | Increases linearly with number of factors | Increases logarithmically with number of factors |
| Data Quality | Limited information depth; single-dimensional perspective | Comprehensive system characterization; multidimensional perspective |
| Risk of Misleading Conclusions | High (especially with interacting factors) | Low (explicitly models interactions) |
| Regulatory Alignment | Becoming less favored in regulated industries | Increasingly recommended (ICH QbD, AQbD) |
| Application Scope | Best for preliminary investigation of simple systems | Suitable for simple to highly complex systems |
Limitations of the OFAT Approach
The OFAT method exhibits several significant limitations that affect its reliability for robustness testing:
- Interaction Blindness: OFAT's most critical limitation is its inability to detect interaction effects between factors [111] [112]. In complex analytical systems, factors often exhibit interdependent effects on responses, where the impact of one factor depends on the level of another. OFAT completely misses these interactions, potentially leading to incorrect conclusions about factor significance [111].
- Inefficiency: OFAT experiments require a large number of experimental runs, especially when investigating multiple factors, resulting in inefficient resource utilization [111]. This inefficiency becomes particularly problematic when working with expensive reagents, limited sample availability, or time-consuming analyses.
- Suboptimal Conditions: By failing to capture the combined effects of factors, OFAT frequently identifies suboptimal operating conditions [111] [112]. The apparent "optimum" found through sequential testing may be substantially different from the true optimum achievable when factor interactions are considered.
- Limited System Understanding: OFAT provides only a fragmented view of system behavior, examining factors in isolation rather than as components of an integrated system [111]. This limited perspective hinders comprehensive method understanding, which is crucial for robust analytical procedures.
Advantages of Multivariate Approaches
Multivariate methodologies directly address OFAT's limitations while providing additional benefits:
- Interaction Detection: Multivariate approaches explicitly model and quantify interaction effects between factors [111]. This capability is crucial for understanding complex analytical systems where factors may have synergistic or antagonistic effects on method performance.
- Efficiency: Experimental designs such as fractional factorial and Plackett-Burman designs enable researchers to screen many factors simultaneously with minimal experimental runs [11] [17]. This efficiency is particularly valuable during early method development when identifying critical factors.
- Optimization Capability: Through response surface methodology, multivariate approaches enable systematic identification of true optimal conditions [111]. Techniques like central composite designs and Box-Behnken designs efficiently map the relationship between factors and responses to locate optima [111] [11].
- Error Quantification: Built-in replication and statistical analysis provide estimates of experimental error and effect significance [111] [17]. This statistical rigor allows researchers to distinguish meaningful effects from random variation, enhancing decision confidence.
- Design Space Definition: Multivariate approaches facilitate establishment of a Method Operable Design Region (MODR), defining the multidimensional combination of factor ranges where method performance remains satisfactory [9]. Operating within this space offers regulatory flexibility under Quality by Design (QbD) initiatives [9].
Experimental Protocols and Applications
OFAT Experimental Protocol
Protocol Objective: To investigate the individual effects of pH, organic modifier concentration, and flow rate on chromatographic resolution using OFAT methodology.
Step-by-Step Procedure:
- Establish Baseline Conditions:
- Set pH to 4.5, organic modifier to 65%, flow rate to 1.0 mL/min
- Perform chromatographic analysis and record resolution value
Vary pH While Holding Other Factors Constant:
- Test pH 4.3 and 4.7 while maintaining organic modifier at 65% and flow rate at 1.0 mL/min
- Return pH to 4.5 after testing
Vary Organic Modifier Concentration:
- Test 63% and 67% organic modifier while maintaining pH at 4.5 and flow rate at 1.0 mL/min
- Return organic modifier to 65% after testing
Vary Flow Rate:
- Test 0.8 mL/min and 1.2 mL/min while maintaining pH at 4.5 and organic modifier at 65%
Data Analysis:
- Compare resolution values at different levels of each factor independently
- Select optimal level for each factor based on individual performance
Limitations: This protocol cannot detect whether the effect of pH depends on the level of organic modifier, potentially missing important interaction effects that could impact method robustness [111] [112].
Multivariate Experimental Protocol for Robustness Testing
Protocol Objective: To evaluate the robustness of an analytical method by simultaneously investigating the effects of pH, organic modifier, flow rate, column temperature, and mobile phase buffer concentration using a Plackett-Burman design.
Step-by-Step Procedure:
- Factor and Level Selection [17] [49]:
- Select factors representing method parameters susceptible to normal variation
- Define extreme levels (high/+1 and low/-1) representing realistic variations expected during method transfer
- Example factors and levels:
- pH: 4.4 (-1) vs. 4.6 (+1)
- Organic modifier: 63% (-1) vs. 67% (+1)
- Flow rate: 0.9 mL/min (-1) vs. 1.1 mL/min (+1)
- Column temperature: 24°C (-1) vs. 26°C (+1)
- Buffer concentration: 24 mM (-1) vs. 26 mM (+1)
Experimental Design Selection [11] [17] [49]:
- For 5 factors, select a Plackett-Burman design with 12 experimental runs
- Include dummy factors (imaginary factors) for statistical effect interpretation
- Randomize run order to minimize bias (except when blocking required)
Execution and Response Measurement [17] [49]:
- Prepare test solutions from the same homogeneous sample batch
- Perform experiments according to design matrix
- Measure multiple responses (assay results, system suitability parameters)
- Incorporate randomization and blocking as appropriate
Effect Calculation and Statistical Analysis [17] [49]:
- Calculate factor effects using the equation:
EX = [ΣY(+) - ΣY(-)]/Nwhere EX is the effect of factor X, ΣY(+) and ΣY(-) are sums of responses at high and low levels, and N is number of experiments - Compare factor effects to critical effects derived from dummy factors or statistical algorithms
- Use normal probability plots or half-normal plots to identify statistically significant effects
- Calculate factor effects using the equation:
Interpretation and System Suitability Definition [17] [49]:
- Identify factors significantly affecting method responses
- Establish system suitability test limits based on effect magnitudes
- Implement controls for factors significantly impacting method performance
Figure 1: Multivariate robustness testing workflow
Application in Pharmaceutical Analysis and Regulatory Context
Robustness Testing in Analytical Method Validation
Robustness testing represents a critical component of analytical method validation, particularly in pharmaceutical analysis where regulatory compliance is mandatory [17] [49]. The International Conference on Harmonisation (ICH) defines robustness as "a measure of its capacity to remain unaffected by small but deliberate variations in method parameters" [17]. While not yet mandatory by ICH guidelines, robustness testing is increasingly expected by regulatory authorities and is considered best practice during method development [49].
The primary objectives of robustness testing include [17] [49]:
- Identifying factors that may cause variability in assay results during method transfer
- Establishing appropriate system suitability test parameters and limits
- Providing indication of method reliability during normal usage
- Defining critical method parameters requiring strict control
Quality by Design (QbD) and Analytical QbD (AQbD)
The pharmaceutical industry's shift toward Quality by Design (QbD) principles has further emphasized the importance of multivariate approaches [9]. QbD emphasizes thorough product and process understanding based on sound science and quality risk management. Within this framework, Analytical QbD (AQbD) applies similar principles to analytical method development [9].
Key aspects of AQbD include [9]:
- Systematic method development using risk assessment and multivariate experiments
- Establishment of a Method Operable Design Region (MODR) - the multidimensional combination of factor ranges where method performance remains satisfactory
- Enhanced method robustness by understanding relevant variability sources
- Regulatory flexibility through documented understanding of method capabilities
Figure 2: Evolution of experimental approaches
The Scientist's Toolkit: Essential Research Reagents and Materials
Table 3: Essential research reagents and solutions for robustness studies
| Reagent/Material | Function in Robustness Testing | Application Notes |
|---|---|---|
| Reference Standards | Quantification and method calibration | Use highly characterized materials from certified suppliers; ensure stability throughout study |
| Chromatographic Columns | Stationary phase for separation | Test multiple columns from different batches or manufacturers as a robustness factor [17] |
| HPLC-grade Solvents | Mobile phase components | Control purity and consistency; variations can significantly impact separation |
| Buffer Solutions | pH control and ionic strength adjustment | Prepare accurately with precise pH adjustment; include buffer concentration as a test factor [17] |
| System Suitability Test Mixtures | Verify chromatographic system performance | Contain analytes and critical pairs to monitor resolution, efficiency, and symmetry |
This comparative analysis demonstrates the clear superiority of multivariate approaches over OFAT for robustness testing of organic analytical procedures. While OFAT offers simplicity and intuitive appeal, its fundamental limitations in detecting factor interactions and identifying true optimal conditions render it inadequate for modern analytical science, particularly in regulated environments.
Multivariate methodologies, founded on sound statistical principles and efficient experimental designs, provide comprehensive system characterization, interaction detection, and meaningful robustness assessment. The pharmaceutical industry's increasing adoption of AQbD principles further reinforces the value of multivariate approaches for developing robust, reliable analytical methods fit for their intended purpose throughout the method lifecycle.
For researchers and drug development professionals, investing in multivariate experimentation capabilities represents not only a scientific best practice but also a strategic advantage in developing robust, transferable, and regulatory-compliant analytical procedures.
Linking Robustness to Intermediate Precision and Reproducibility
In the realm of analytical chemistry, particularly for organic analytical procedures in pharmaceutical research, ensuring the reliability of methods is paramount. The terms robustness, intermediate precision, and reproducibility are often used interchangeably, yet they represent distinct and critical validation parameters within a method's lifecycle [1]. Understanding their relationship is essential for developing reliable analytical procedures that remain unaffected by small, deliberate variations and can successfully transfer between laboratories, analysts, and instruments [1] [113]. This guide explores the linkages between these parameters, providing a structured comparison to aid researchers, scientists, and drug development professionals in strengthening their analytical control strategies.
Defining the Core Concepts
Robustness
The robustness of an analytical procedure is defined as a measure of its capacity to remain unaffected by small, deliberate variations in method parameters listed in the documentation [1]. It provides an indication of the method's suitability and reliability during normal use. Robustness is investigated during method development by intentionally varying internal method parameters [1]. In liquid chromatography, examples include:
- Mobile phase composition (pH, buffer concentration, percent organic)
- Flow rate and column temperature
- Detection wavelength and gradient conditions [1]
Intermediate Precision
Intermediate precision expresses within-laboratories variations, such as different days, different analysts, or different equipment [1]. It assesses the impact of external factors that are expected to change under normal operating conditions but are not written into the method protocol itself [1].
Reproducibility
Reproducibility refers to between-laboratory variations, as assessed through collaborative studies applied to the standardization of a method [1]. It represents the highest level of precision, demonstrating a method's reliability when performed across different laboratories.
Table 1: Comparative Overview of Validation Parameters
| Parameter | Definition | Scope of Variation | Typical Study Conditions |
|---|---|---|---|
| Robustness | Measure of method capacity to remain unaffected by small, deliberate variations | Internal method parameters | Different columns, mobile phase pH, flow rate, temperature, wavelength [1] |
| Intermediate Precision | Within-laboratory variations under normal operational changes | External factors not specified in method | Different days, different analysts, different instruments [1] |
| Reproducibility | Between-laboratory variations in collaborative studies | Inter-laboratory factors | Different laboratories, equipment, analysts, reagent lots [1] |
Experimental Protocols for Assessment
Methodologies for Robustness Testing
Robustness studies employ multivariate experimental designs to efficiently evaluate multiple parameters simultaneously. The most common screening designs include [1]:
- Full Factorial Designs: All possible combinations of factors at two levels (high and low) are measured. For k factors, this requires 2^k runs (e.g., 4 factors require 16 runs) [1].
- Fractional Factorial Designs: A carefully chosen subset of factor combinations reduces the number of runs while still providing valuable data on main effects. This is particularly useful for investigating more than five factors [1].
- Plackett-Burman Designs: Economical screening designs in multiples of four (rather than powers of two) that efficiently identify critical factors affecting robustness when only main effects are of interest [1].
These methodologies allow analysts to identify Critical Method Parameters (CMPs) and establish their Proven Acceptable Ranges (PAR) or Method Operable Design Regions (MODR) as part of the Analytical Procedure Development under ICH Q14 [108].
Assessing Intermediate Precision and Reproducibility
Intermediate precision is evaluated by analyzing the same samples under a variety of conditions normally expected within a single laboratory [1]. A well-designed study should incorporate variations in:
- Analysts with different skill levels and experience
- Instruments from different manufacturers or with different performance characteristics
- Reagent lots from different suppliers or production batches
- Environmental conditions (temperature, humidity) within specified ranges
- Analysis performed on different days [1]
Reproducibility studies extend these evaluations across multiple laboratories, typically through formal collaborative trials involving statistically sufficient numbers of participants to generate meaningful data on between-laboratory variance [1].
Comparative Analysis of Method Performance
Statistical Approaches for Robustness Evaluation
Recent research has compared the robustness of various statistical methods used in analytical chemistry. A 2025 study compared three statistical methods for Proficiency Tests (PTs) [106]:
- Algorithm A (from ISO 13528): An implementation of Huber's M-estimator with approximately 25% breakdown point and 97% efficiency. It becomes unreliable when outliers constitute more than 20% of the dataset [106].
- Q/Hampel Method (from ISO 13528): Combines the Q-method for standard deviation estimation with Hampel's three-part M-estimator, with a 50% breakdown point and approximately 96% efficiency [106].
- NDA Method: Used by WEPAL/Quasimeme PT schemes, employs a fundamentally different conceptual approach using probability density functions, with 50% breakdown point but lower efficiency (~78%) [106].
The study demonstrated that NDA exhibited higher robustness to asymmetry, particularly in smaller samples, while Algorithm A showed the largest deviations from true values in contaminated datasets [106].
Table 2: Comparison of Statistical Methods for Robustness Assessment
| Method | Breakdown Point | Efficiency | Robustness to Asymmetry | Best Use Case |
|---|---|---|---|---|
| Algorithm A | ~25% | ~97% | Low | Large datasets with low contamination [106] |
| Q/Hampel | 50% | ~96% | Moderate | Datasets with moderate outlier proportions [106] |
| NDA | 50% | ~78% | High | Small samples with potential asymmetry [106] |
Integrated Assessment Frameworks
The Red Analytical Performance Index (RAPI) has emerged as a novel tool for assessing analytical performance criteria, complementing existing green chemistry assessment metrics [114]. RAPI evaluates ten predefined analytical criteria, including repeatability, intermediate precision, and reproducibility, scoring them from 0-10 points [114]. This tool, along with its "sister" tool BAGI (Blue Applicability Grade Index), provides a comprehensive picture of method characteristics within the White Analytical Chemistry (WAC) framework [114].
The Scientist's Toolkit: Essential Research Reagents and Materials
Table 3: Essential Materials for Robustness and Precision Studies
| Item | Function in Experimental Protocols |
|---|---|
| HPLC/UPLC Systems | Separation and analysis of organic compounds; different systems used for intermediate precision testing [1] |
| Chromatographic Columns | Stationary phases for separation; different lots and brands tested in robustness studies [1] |
| Reference Standards | Certified materials for method calibration and accuracy determination across different laboratories [113] |
| Buffer Components | Mobile phase preparation with controlled pH; variations tested in robustness studies [1] |
| Organic Solvents | Mobile phase modifiers; different grades and suppliers tested for robustness [1] |
Workflow and Relationship Visualization
The following diagram illustrates the logical relationship between robustness, intermediate precision, and reproducibility within the analytical method validation framework, highlighting their distinct scopes and interconnections:
Analytical Method Validation Pathway
Understanding the distinct roles and relationships between robustness, intermediate precision, and reproducibility is fundamental for developing reliable analytical procedures in pharmaceutical research. Robustness serves as an internal assessment of method stability under varied parameters, while intermediate precision and reproducibility evaluate external factors affecting method performance within and between laboratories, respectively [1]. Implementing structured experimental designs during method development, such as full factorial or Plackett-Burman designs, allows for efficient robustness testing and establishes system suitability parameters [1]. The integration of these validation parameters within frameworks like ICH Q14's enhanced approach and assessment tools like RAPI provides a comprehensive strategy for ensuring method reliability throughout the analytical procedure lifecycle [114] [108]. This holistic understanding enables researchers to develop more robust methods, facilitate successful technology transfer, and ultimately ensure the quality, safety, and efficacy of pharmaceutical products.
Method Transfer Based on Robustness Study Results
The transfer of analytical methods is a systematic process essential for ensuring that analytical procedures produce equivalent and reliable results when moved from one laboratory to another, such as from research and development to a quality control lab [115]. In the pharmaceutical industry, this process is critical for maintaining product quality, consistency, and regulatory compliance across different manufacturing and testing sites [22] [115]. A successful method transfer verifies that the receiving laboratory can reproduce the method's performance within predefined acceptance criteria, thereby supporting commercial manufacturing and stability studies [22].
Within this framework, robustness testing serves as a foundational element that predicts a method's transferability. Defined as a measure of an analytical procedure's capacity to remain unaffected by small, deliberate variations in method parameters, robustness provides a crucial indication of its reliability during normal usage [1] [49]. A method that demonstrates high robustness is inherently less sensitive to the minor, inevitable differences in equipment, reagents, and environmental conditions found between laboratories. Consequently, investing in a thorough robustness study during method development de-risks the subsequent transfer process, reducing the likelihood of failure, costly rework, and delays in product development [1] [9].
Comparative Analysis of Method Transfer Approaches
The framework for analytical method transfer is well-described in regulatory and industry guidance. The United States Pharmacopeia (USP) Chapter 〈1224〉 outlines three primary transfer approaches, each with distinct applications and connections to method robustness [22].
Table 1: Comparison of Analytical Method Transfer Approaches
| Transfer Approach | Description | Usability Context | Dependency on Robustness |
|---|---|---|---|
| Comparative Transfer | Both transferring and receiving labs analyze identical samples using the validated method to demonstrate equivalent results [22]. | Used for methods already validated at the transferring laboratory [22]. | High. The success of this direct comparison is heavily dependent on the method's inherent robustness to withstand inter-laboratory variations. |
| Co-validation | The receiving laboratory participates as part of the validation team, generating data for the assessment of reproducibility during the initial validation [22]. | Suitable for transferring methods from a development unit to a receiving unit [22]. | Moderate to High. Robustness data guides which parameters require strict control during the collaborative validation. |
| Revalidation | The method is fully or partially revalidated at the receiving site [22]. | Employed when the sending lab is not involved or when original validation data needs supplementation [22] [116]. | Lowest. Revalidation itself characterizes the method's performance at the new site, though pre-existing robustness data can focus the revalidation effort. |
The choice of transfer strategy is heavily influenced by the quality of the method's robustness data. A method developed with poor robustness will likely struggle in a straightforward Comparative Transfer, potentially requiring a more intensive Co-validation or even Revalidation approach to succeed at the receiving site [22] [116]. The Global Bioanalytical Consortium further distinguishes between internal transfers (within the same organization with shared systems) and external transfers (to a different organization), with the latter requiring more extensive testing, effectively functioning as a full or partial validation [116].
Experimental Protocols for Robustness Testing
A robustness test is an experimental set-up that examines the impact of small, deliberate changes in method parameters on performance responses [49]. The following section details the standardized protocol for conducting these studies.
Key Steps in Robustness Testing
The process can be broken down into a logical sequence of steps, from planning to conclusion.
Figure 1: Robustness Testing Workflow
- Factor Identification: Select operational and environmental factors from the method description. For a chromatographic method, this typically includes factors like mobile phase pH, flow rate, column temperature, gradient slope, and detector wavelength [1] [49].
- Define Levels: For each factor, define a high (+) and low (-) level that represents a slight variation around the nominal (standard) value. The range should be slightly larger than the variation expected in routine use between different instruments and analysts [49]. For example, a nominal flow rate of 1.0 mL/min might be tested at 0.9 mL/min and 1.1 mL/min.
- Select Experimental Design: Multivariate screening designs are the most efficient way to study multiple factors simultaneously. The choice of design depends on the number of factors [1] [49]:
- Full Factorial Design: Examines all possible combinations of factors. Suitable for a small number of factors (e.g., ≤5), but the number of runs (2k) grows exponentially [1].
- Fractional Factorial or Plackett-Burman Designs: Highly efficient for screening a larger number of factors with a minimal number of experiments. These designs allow the identification of critical factors without testing every single combination [1] [49].
- Execution and Measurement: The experiments are performed in a randomized order, and key responses are measured. These responses include both quantitative results (e.g., assay content, impurity level) and system suitability parameters (e.g., resolution, tailing factor, peak area) [49].
- Effect Calculation and Analysis: The influence (effect) of each factor on the responses is calculated. Statistically significant effects are identified, often using graphical methods like normal or half-normal probability plots, or by estimating the experimental error and defining a threshold [49].
- Conclusion and Control Strategy: Factors with a significant effect on critical responses are identified as "critical parameters." These parameters must be tightly controlled in the method procedure. The results also provide an experimental basis for setting appropriate system suitability test (SST) limits [49].
Example Robustness Study Parameters
The table below illustrates typical factors and levels that might be investigated in a robustness study for an HPLC method.
Table 2: Example Factors and Levels for an HPLC Robustness Study
| Factor | Nominal Value | Low Level (-) | High Level (+) |
|---|---|---|---|
| Mobile Phase pH | 3.1 | 2.9 | 3.3 |
| Flow Rate (mL/min) | 1.0 | 0.9 | 1.1 |
| Column Temperature (°C) | 30 | 25 | 35 |
| % Organic in Gradient | 45% | 43% | 47% |
| Detection Wavelength (nm) | 254 | 252 | 256 |
| Buffer Concentration (mM) | 50 | 45 | 55 |
The Scientist's Toolkit: Essential Reagents and Materials
The successful execution of a robustness study and subsequent method transfer relies on several critical materials and solutions.
Table 3: Essential Research Reagent Solutions for Robustness and Transfer Studies
| Item | Function & Importance |
|---|---|
| Well-Characterized Reference Standard | A primary standard of known purity and identity is essential for generating accurate and precise data during both robustness testing and the final method transfer. It serves as the benchmark for all quantitative measurements [116]. |
| Critical Reagents (e.g., Antibodies, Enzymes) | For bioanalytical methods (e.g., ligand binding assays), the quality and lot-to-lot consistency of critical reagents are paramount. Variations here can severely impact method performance. It is recommended to use the same reagent lots during transfer where possible [116]. |
| Chromatographic Column(s) | The specific type, brand, and lot of the chromatographic column is often a critical parameter. Robustness studies should include testing with different column lots to establish acceptable variability [1] [49]. |
| Mobile Phase Components & Buffers | The quality and pH of buffers and organic modifiers are key factors in chromatographic methods. Robustness studies define the acceptable tolerances for their preparation [1]. |
| System Suitability Test (SST) Samples | A mixture of analytes designed to verify that the chromatographic system is operating correctly before analysis. Results from robustness studies provide a scientific basis for setting SST limits [49]. |
Data Interpretation and Establishing the Method Operable Design Region
The ultimate goal of robustness testing is to define a Method Operable Design Region (MODR), also referred to as the analytical design space [9]. The MODR is the multidimensional combination and interaction of input variables (e.g., mobile phase pH, temperature) and process parameters that have been demonstrated to provide assurance of suitable method performance.
A key output of the robustness study is the calculation of effects. The effect of a factor is the change in response caused by varying the factor from its low to high level. It is calculated as [49]: [ EX = \frac{\sum Y(+)}{N(+)} - \frac{\sum Y(-)}{N(-)} ] Where (EX) is the effect of factor X, (\sum Y(+)) and (\sum Y(-)) are the sums of the responses where factor X is at its high or low level, respectively, and (N(+)) and (N(-)) are the number of experiments at those levels.
Factors with negligible effects are considered non-critical. The method is robust for these factors within the studied range. Factors with significant effects are deemed critical parameters and must be explicitly controlled in the written method procedure. The knowledge gained allows scientists to define a control strategy. Parameters with large effects require narrow operating ranges, while those with small effects can have wider tolerances, providing flexibility during routine use and transfer [49] [9].
Method transfer is not an isolated event but a critical phase in the analytical procedure lifecycle. The success of this transfer is profoundly influenced by the foundational work conducted during method development, specifically, the thorough investigation of method robustness. A robustness study, executed via structured experimental designs, transforms method transfer from a high-risk verification into a predictable and successful exercise. By proactively identifying critical method parameters and establishing a scientifically sound Method Operable Design Region, researchers can ensure that their analytical methods are not only validated but are also inherently transferable, reliable, and resilient to the normal variations encountered in different laboratories. This approach, aligned with the modern principles of Analytical Quality by Design (AQbD), ultimately enhances regulatory compliance, reduces costs, and accelerates the delivery of safe and effective pharmaceuticals to the market.
Design Space Verification and Regulatory Submission Strategy
In the pharmaceutical industry, the concept of Design Space has revolutionized how manufacturers approach product and process development. According to ICH Q8(R2), Design Space is defined as "the multidimensional combination and interaction of input variables (e.g., material attributes) and process parameters that have been demonstrated to provide assurance of quality" [117]. This systematic approach represents a significant shift from traditional empirical methods toward science-based and risk-based frameworks that enhance product understanding and regulatory flexibility [118].
Within the context of organic analytical procedures, Design Space verification provides a structured framework for demonstrating that analytical methods remain robust and reliable across a defined operating region. The Method Operable Design Region (MODR), equivalent to the Design Space concept for analytical methods, represents a multidimensional region where all study factors in combination provide suitable mean performance and robustness, ensuring procedure fitness for use [9]. This approach is particularly valuable for chromatography-based analytical techniques, where multiple parameters can interact in complex ways to affect method performance.
Design Space Versus Traditional Method Verification: A Comparative Analysis
Fundamental Philosophical Differences
The establishment of a Design Space represents a paradigm shift from traditional method verification approaches. While traditional methods often rely on one-factor-at-a-time (OFAT) experimentation and fixed operating conditions, the Design Space approach embraces multivariate experimentation and recognizes the complex interactions between method parameters [9]. This fundamental difference in philosophy leads to significant variations in development strategy, regulatory implications, and operational flexibility.
Table 1: Comparison of Traditional Method Verification Versus Design Space Approach
| Aspect | Traditional Approach | Design Space Approach |
|---|---|---|
| Experimental Design | One-factor-at-a-time (OFAT) | Multivariate (DoE) |
| Parameter Understanding | Limited understanding of interactions | Comprehensive interaction mapping |
| Regulatory Flexibility | Fixed operating conditions | Movement within space not considered a change |
| Risk Management | Often retrospective | Integrated throughout development |
| Knowledge Management | Limited data structure | Comprehensive knowledge management |
| Lifecycle Management | Reactive changes | Continuous verification and improvement |
Performance Comparison Through Experimental Data
Experimental studies demonstrate the superior robustness and operational flexibility afforded by the Design Space approach. In a case study involving an HPLC assay for an active compound and two related compounds, a Plackett-Burman experimental design was employed to evaluate the effects of eight factors across 12 experiments [17]. The results demonstrated that the Design Space approach could identify critical parameter interactions that would remain undetected using OFAT methodology.
Table 2: Experimental Performance Comparison of Traditional vs. Design Space Approaches
| Performance Metric | Traditional OFAT | Design Space (DoE) |
|---|---|---|
| Time to Method Development | 6-8 weeks | 3-4 weeks |
| Number of Experiments | 25-30 | 12-16 |
| Parameter Interactions Identified | Limited (0-2) | Comprehensive (all significant) |
| Method Robustness Issues | 3-5 per year | 0-1 per year |
| Post-approval Changes | 2-3 annually | 0-1 annually |
| Operational Flexibility | Limited to narrow ranges | Flexible within proven acceptable ranges |
The experimental data consistently shows that while the initial investment in Design Space development may be higher, the long-term benefits include reduced method failures, fewer regulatory submissions for changes, and greater operational flexibility [117] [118].
Experimental Protocols for Design Space Verification
Systematic Approach to Design Space Development
The development of a robust Design Space follows a structured, systematic approach that integrates quality risk management and statistical experimental design. The process consists of five critical phases, each with specific deliverables and decision points [117] [118].
Figure 1: Design Space Development Workflow showing the systematic process from initial definition through lifecycle management.
Risk Assessment and Parameter Selection
The foundation of effective Design Space development begins with systematic risk assessment. Using tools such as Fishbone diagrams (Ishikawa cause-effect) and Failure Mode and Effects Analysis (FMEA), developers systematically identify, rank, and prioritize variables that may impact method performance and product quality [118]. This risk-based approach ensures that experimental resources are focused on parameters with the greatest potential impact on Critical Quality Attributes (CQAs).
The risk assessment process typically follows this protocol:
- Identify all potential parameters that could influence CQAs
- Assess severity, occurrence, and detectability for each parameter
- Calculate risk priority numbers (RPN) to prioritize factors
- Select high-risk parameters for inclusion in experimental designs
- Document rationale for parameter inclusion/exclusion
Design of Experiments (DoE) Protocol
The experimental backbone of Design Space development relies on structured Design of Experiments (DoE). The specific protocol varies based on the number of factors and desired model complexity [117] [17].
Table 3: Experimental Designs for Design Space Development
| Design Type | Factors | Runs | Model Information | Best Use Cases |
|---|---|---|---|---|
| Full Factorial | 2-5 | 2^k | Main effects + all interactions | Initial screening with few factors |
| Fractional Factorial | 4-8 | 2^(k-p) | Main effects + some interactions | Screening many factors efficiently |
| Plackett-Burman | 5-11 | Multiple of 4 | Main effects only | High-throughput screening |
| Central Composite | 2-6 | 2^k + 2k + center | Full quadratic model | Response surface optimization |
| Box-Behnken | 3-7 | k(k-1)1.5 + center | Full quadratic model | Efficient RSM without extreme points |
For a robustness test of an HPLC method with 8 factors, a 12-experiment Plackett-Burman design would be appropriate [17]. The experimental protocol would include:
- Preparation of standard solutions covering the analytical range
- Randomization of experimental run order to minimize bias
- Execution of all design experiments under controlled conditions
- Replication of center points to estimate pure error
- Analysis of responses including assay values and resolution
Data Analysis and Model Building
Following data collection, statistical analysis transforms experimental results into predictive models that define the Design Space [117]. The protocol includes:
- Model Selection: Choosing between linear, interaction, or quadratic models based on experimental design
- Statistical Significance Testing: Evaluating p-values to identify significant terms (α=0.05)
- Model Adequacy Checking: Assessing R², adjusted R², and prediction R²
- Residual Analysis: Verifying normality, independence, and constant variance assumptions
- Model Simplification: Removing non-significant terms to create parsimonious models
The resulting mathematical models describe the relationship between method parameters and quality attributes, enabling prediction of method performance across the operating region.
Visualization and Interpretation of Design Space
Graphical Representation of Multidimensional Space
The visualization of Design Space is critical for both interpretation and regulatory communication. While Design Spaces are inherently multidimensional, they are typically represented through two-dimensional slices or projections that illustrate the acceptable operating ranges for critical parameter pairs [117] [118].
Figure 2: Design Space Visualization Process showing the transformation of experimental data into operational ranges.
Establishing Normal Operating Ranges and Proven Acceptable Ranges
Within the defined Design Space, two critical operational ranges are established [117]:
- Normal Operating Ranges (NOR): Typically three sigma design windows representing everyday operational targets
- Proven Acceptable Ranges (PAR): Typically six sigma design windows representing the extreme boundaries where quality is still assured
The relationship between these ranges can be visualized through contour plots that show the probability of meeting quality standards across the operating region. Simulation techniques are employed to determine failure rates and process capability indices (CpK) at different set points, with CpK ≥ 1.33 generally considered acceptable [117].
Regulatory Strategy for Design Space Submissions
Regulatory Framework and Flexibility
The regulatory framework for Design Space submissions is established through ICH guidelines Q8(R2), Q9, Q10, and Q11 [118]. A key regulatory advantage of an approved Design Space is that movement within the characterized Design Space is not considered a change and does not require regulatory notification [117]. This provides manufacturers with significant operational flexibility while maintaining regulatory compliance.
The transition from traditional submission approaches to modern, science-based submissions mirrors the shift in analytical methodology [119]:
Table 4: Comparison of Traditional vs. Modern Regulatory Submission Approaches
| Submission Aspect | Traditional Submission | Modern eCTD Submission |
|---|---|---|
| Submission Format | Paper-based documents | Electronic Common Technical Document (eCTD) |
| Data Presentation | Limited data summaries | Comprehensive data sets with statistical analysis |
| Review Efficiency | Longer review times due to manual handling | Faster review through standardized format |
| Knowledge Management | Fragmented information | Integrated knowledge management |
| Post-approval Changes | Multiple submissions required | Reduced submissions due to Design Space flexibility |
Regulatory Communication Strategy
Effective regulatory submissions for Design Space require clear communication of both the experimental approach and the resulting operational ranges [118]. Key elements include:
- Scientific Rationale: Justification for selected factors, ranges, and experimental designs
- Statistical Analysis: Comprehensive presentation of model development and validation
- Visual Representations: Clear graphical depictions of the Design Space
- Control Strategy: Description of how the method will be controlled within the Design Space
- Lifecycle Management: Approach for ongoing verification and potential refinement
Regulatory agencies generally welcome discussion on Design Space, and applicants are encouraged to engage with agency working groups during development [117].
The Scientist's Toolkit: Essential Research Reagent Solutions
Successful Design Space verification requires specific reagents, materials, and analytical tools that ensure reliability and reproducibility throughout method development and validation.
Table 5: Essential Research Reagent Solutions for Design Space Verification
| Reagent/Material | Function | Critical Quality Attributes |
|---|---|---|
| Reference Standards | Quantification and method calibration | Purity, identity, stability, traceability |
| Chromatography Columns | Analytical separation | Efficiency (N), selectivity (α), retention (k) |
| Mobile Phase Components | Separation mechanism | pH, purity, composition, UV cutoff |
| System Suitability Standards | Performance verification | Resolution, precision, peak symmetry |
| Sample Preparation Reagents | Extraction and cleanup | Selectivity, recovery, reproducibility |
The implementation of Design Space verification represents a fundamental advancement in pharmaceutical analytical science. Through systematic experimentation, statistical modeling, and visual representation, this approach provides demonstrable robustness and regulatory flexibility that traditional method verification cannot match. The comparative experimental data shows clear advantages in method robustness, operational flexibility, and lifecycle management.
As the pharmaceutical industry continues to evolve, the integration of Advanced Analytics, Artificial Intelligence (AI), and Digital Twin technologies promises to further enhance Design Space development and verification [118]. These innovations will enable more dynamic and precise control strategies, ultimately leading to more robust analytical methods and higher quality pharmaceutical products.
The strategic integration of Design Space verification within regulatory submissions creates a framework for continuous improvement and innovation while maintaining compliance with global regulatory requirements. This approach benefits manufacturers through increased operational flexibility and benefits regulatory agencies through enhanced product understanding and science-based decision making.
In the field of pharmaceutical analysis, the development of robust and reliable analytical methods is paramount for ensuring drug quality, safety, and efficacy. Two fundamentally different philosophies guide this development: the traditional approach and the Quality by Design (QbD) paradigm. The traditional method, often referred to as Quality by Test (QbT), relies on a reactive model where quality is confirmed through end-product testing [87] [120]. In contrast, QbD is a systematic, proactive framework that builds quality into the method from the outset, emphasizing deep process understanding and control based on sound science and quality risk management [84] [121]. This case study objectively compares these two approaches, focusing on their application in developing analytical procedures for organic compounds, with a specific emphasis on robustness testing—a critical element for method reliability throughout its lifecycle.
Fundamental Principles and Comparative Framework
The Traditional Approach (Quality by Test)
The traditional approach to analytical method development is characterized by an empirical, one-factor-at-a-time (OFAT) methodology [9] [121]. Development typically involves varying a single parameter while holding all others constant, iterating until a set of conditions appears to produce acceptable results. The primary focus is on validating the final method to demonstrate that it meets predefined acceptance criteria at the fixed, nominal operating conditions [87]. This approach provides a minimal understanding of how variability in method parameters might affect performance during routine use. Its reactive nature means that robustness is often tested late in the development cycle, or sometimes only investigated when problems arise during routine application, potentially leading to out-of-specification results and method failure [9].
The QbD-Based Approach (Analytical Quality by Design)
Analytical Quality by Design (AQbD) is an extension of the QbD principles defined in ICH Q8(R2) to analytical method development [87] [84]. It is a systematic, science, and risk-based approach that begins with predefined objectives. The core principle is that quality should be designed into the analytical method, not just tested at the end. It ensures the method is fit for its intended purpose throughout its entire lifecycle, leading to a well-understood and purpose-driven procedure [87]. Key pillars of AQbD include:
- Quality Risk Management (QRM): Systematically identifying and assessing potential risks to method performance.
- Design of Experiments (DoE): Using multivariate experiments to efficiently understand parameter interactions and optimize method conditions.
- Lifecycle Management: Continuously monitoring and verifying method performance post-validation [87] [122].
Table 1: Core Conceptual Differences Between Traditional and QbD-Based Approaches
| Aspect | Traditional Approach (QbT) | QbD-Based Approach (AQbD) |
|---|---|---|
| Philosophy | Reactive, quality is tested | Proactive, quality is designed in |
| Development Method | One-Factor-at-a-Time (OFAT) | Design of Experiments (DoE) |
| Primary Focus | Final validation at fixed conditions | Method understanding and control strategy |
| Robustness | Often tested post-development or when problems occur | Built-in and understood from the start |
| Risk Management | Informal or not systematic | Formalized and integral to the process |
| Regulatory Flexibility | Fixed conditions; changes require revalidation | Defined Method Operable Design Region (MODR) allows flexibility |
| Lifecycle Perspective | Limited, focused on initial validation | Comprehensive, includes continuous verification |
Case Study: Method Development for Favipiravir Quantification
To illustrate the practical differences, we examine the development of a Reversed-Phase High-Performance Liquid Chromatography (RP-HPLC) method for quantifying favipiravir, an antiviral drug.
Traditional Method Development Protocol
A traditional protocol would likely follow an OFAT sequence [121]:
- Initial Scouting: A C18 column is typically selected. The mobile phase is chosen as a mixture of water or buffer and an organic solvent like acetonitrile or methanol.
- OFAT Optimization: The developer would first adjust the organic solvent ratio (e.g., 20%, 25%, 30%) to achieve a reasonable retention time. Then, while keeping the ratio fixed, the buffer pH might be adjusted (e.g., 2.5, 3.0, 3.5). Finally, other parameters like column temperature or flow rate might be fine-tuned sequentially.
- Final Method: A single set of "optimal" conditions is defined (e.g., 25% acetonitrile, pH 3.0, 30°C).
- Validation: The method is validated per ICH Q2(R1) guidelines at these fixed conditions. A robustness study might be conducted by varying parameters one at a time around the set point.
QbD-Based Method Development Protocol
The QbD-based development for the same method, as detailed in the research, followed a structured, scientific workflow [59]:
- Step 1: Define the Analytical Target Profile (ATP): The ATP was defined, outlining the method's purpose: to precisely identify and quantify favipiravir in its dosage form [59] [122].
- Step 2: Identify Critical Method Attributes (CMAs): The Critical Method Attributes (CMAs), which are the performance measures of the method, were selected: peak area (Y1, for quantification), retention time (Y2, for identification), tailing factor (Y3), and theoretical plate count (Y4) [59].
- Step 3: Risk Assessment and CMP Identification: A risk assessment was conducted, identifying factors with a potential high impact on the CMAs. Three high-risk factors were selected for further study: the ratio of solvent in the mobile phase (X1), the pH of the buffer (X2), and the column type (X3) [59].
- Step 4: Experimental Design (DoE) and MODR Definition: A d-optimal experimental design was employed to systematically study the impact of the three CMPs on the four CMAs. This multivariate approach allowed for the modeling of interaction effects between parameters, which OFAT cannot detect. The data was analyzed, and a Method Operable Design Region (MODR) was established using a Monte Carlo simulation. The MODR represents the multidimensional combination of CMPs within which the method provides suitable performance, ensuring robustness [59].
- Step 5: Control Strategy and Validation: A robust set point within the MODR was selected: an Inertsil ODS-3 C18 column with a mobile phase of acetonitrile and disodium hydrogen phosphate anhydrous buffer (pH 3.1, 20 mM) in an 18:82 v/v ratio. The method was validated and showed excellent precision, accuracy, and robustness with RSD < 2% [59].
Comparative Analysis and Discussion
Quantitative Comparison of Outcomes
The table below summarizes the experimental data and outcomes from the favipiravir case study, contrasting it with the expected outcomes from a traditional approach.
Table 2: Experimental Data Comparison for Favipiravir HPLC Method
| Parameter | Traditional Approach (Expected) | QbD-Based Approach (Reported) |
|---|---|---|
| Development Strategy | One-Factor-at-a-Time (OFAT) | d-optimal Experimental Design |
| Parameters Understood | Main effects only | Main effects and interaction effects |
| Robustness | Limited knowledge; verified post-hoc | Built-in via MODR; quantitatively defined |
| Validation Results | RSD < 2% (if robust) | RSD < 2% [59] |
| Method Understanding | Low. Knows what works, not why it fails. | High. Knows parameter interactions and failure boundaries. |
| Regulatory Posture | Fixed conditions. Changes may need revalidation. | Flexible within MODR without prior approval [87] [9]. |
| Environmental Impact | Not typically a primary focus | Excellent Analytical Eco-Scale score (>75) [59] |
Advantages and Challenges of Each Approach
Traditional Approach:
- Advantages: Simpler to plan and execute initially, requires less statistical expertise, and is familiar to most analysts.
- Challenges: Provides a narrow understanding, is inefficient and time-consuming, and leads to methods that are fragile and prone to failure when transferred or when equipment/supplies drift [87] [121]. It is a major reason for inconsistent method performance during routine use [9].
QbD-Based Approach:
- Advantages: Generates more robust methods with a higher degree of understanding [87]. It is more efficient in the long run, reduces the risk of failure post-approval, and offers regulatory flexibility [9]. It also facilitates method transfer and continuous improvement throughout the method lifecycle [87] [122].
- Challenges: Requires a comprehensive grasp of statistical analysis and experimental design, demands greater upfront investment in time and resources, and faces an absence of universally standardized directives, though ICH Q14 and USP ⟨1220⟩ are now providing clear frameworks [87] [122].
The Scientist's Toolkit: Essential Reagents and Solutions
The following table details key materials used in the featured QbD-based favipiravir experiment and their critical functions [59].
Table 3: Key Research Reagent Solutions for QbD-based HPLC Development
| Reagent/Material | Specification / Function |
|---|---|
| Favipiravir (API) | Reference Standard (Purity ≥98%). Serves as the analyte for quantification. |
| Acetonitrile (HPLC Grade) | Organic Modifier in Mobile Phase. Influences retention time and selectivity. |
| Disodium Hydrogen Phosphate | Buffer Salt (20 mM, pH 3.1). Controls mobile phase pH, critical for reproducibility and peak shape. |
| Orthophosphoric Acid | pH Adjustment. Used to precisely adjust buffer pH, a Critical Method Parameter. |
| Inertsil ODS-3 C18 Column | Stationary Phase (250 mm, 4.6 mm, 5 μm). Critical for separation; column type was a studied CMP. |
This comparative case study demonstrates a clear paradigm shift in analytical method development. The traditional OFAT approach, while familiar, often produces methods with a limited operational range and a poor understanding of parameter interactions, making them vulnerable to failure. In contrast, the QbD-based approach, through its systematic application of risk assessment, DoE, and MODR definition, builds robustness directly into the method. The featured case study on favipiravir quantification [59] provides tangible evidence that AQbD results in highly robust, well-understood, and regulatory-flexible methods. For industries where analytical reliability is non-negotiable, adopting AQbD is not merely an optimization but a fundamental requirement for ensuring product quality and patient safety throughout the analytical procedure lifecycle.
Continuous Monitoring and Lifecycle Management of Robust Methods
Continuous monitoring and lifecycle management represent a paradigm shift in analytical science, moving from static, periodic assessments to dynamic, real-time quality assurance. In the context of organic analytical procedures, this approach ensures methods remain fit-for-purpose throughout their entire lifespan, from initial development to routine use in quality control laboratories. The foundation of this modern approach lies in Analytical Procedure Lifecycle Management (APLM), which applies Quality by Design (QbD) principles to method development, validation, and continuous verification [55]. This framework is particularly crucial for pharmaceutical analysis, where method robustness directly impacts product quality, patient safety, and regulatory compliance.
The integration of continuous monitoring technologies within the method lifecycle enables real-time detection of analytical procedure drift, potential failures, or changes in sample matrices that could compromise results. For organic analysis, this might include continuous monitoring of critical method parameters, system suitability criteria, or environmental conditions that affect analytical performance. This proactive approach contrasts with traditional periodic assessments, which only provide snapshots of method performance and may miss critical deviations occurring between assessments [123] [55].
The Analytical Procedure Lifecycle Framework
The Analytical Procedure Lifecycle Management framework, as outlined in emerging regulatory guidance, consists of three interconnected stages that form a continuum of quality assurance.
Stage 1: Procedure Design and Development
The initial stage emphasizes building quality into the analytical method through science-based development. This begins with defining an Analytical Target Profile (ATP) - a predefined objective that articulates the method's requirements for accuracy, precision, selectivity, and measurement uncertainty [55]. The ATP serves as the foundation for all subsequent lifecycle activities and ensures the procedure remains aligned with its intended purpose.
Advanced technologies play a crucial role in modern method development. Automated method scouting systems enable rapid screening of multiple chromatographic parameters, including column chemistries, mobile phase pH, gradient profiles, and separation temperatures [25]. For instance, one documented approach tested 24 different chromatographic conditions in less than 20 hours with total data processing under one hour, significantly accelerating method development while ensuring robust parameter selection [25]. These automated systems employ sophisticated software that objectively selects optimal conditions based on pre-defined criteria, such as resolving critical peak pairs in complex organic mixtures [25].
Stage 2: Procedure Performance Qualification
This stage corresponds to traditional method validation but with enhanced rigor and scientific rationale. Rather than treating validation as a one-time exercise, the lifecycle approach views qualification as confirming the procedure performs as designed under actual conditions of use [55]. Validation activities are directly traceable to the ATP, with particular emphasis on establishing the method's robustness across anticipated operational ranges.
Modern liquid chromatography systems support this stage through automated validation workflows. Pre-configured templates based on International Council for Harmonisation (ICH) guidelines streamline the creation of injection sequences for accuracy, precision, linearity, and range determinations [124]. Advanced data management systems automatically generate validation reports, eliminating tedious manual steps and reducing transcription errors [25] [124]. This automation is particularly valuable for robustness testing, where multiple parameters (e.g., temperature, flow rate) must be varied simultaneously to establish method resilience [124].
Stage 3: Procedure Performance Verification
The final stage represents the most significant departure from traditional approaches, emphasizing ongoing monitoring of method performance during routine use. Continuous monitoring technologies are deployed to verify that the procedure continues to meet its ATP throughout its operational lifetime [55]. This involves continuous data collection from system suitability tests, quality control samples, and method performance indicators that provide real-time insight into analytical method health.
The feedback loops between stages ensure continual improvement. Data from routine monitoring may trigger method refinement or redevelopment when performance trends indicate emerging issues [55]. This closed-loop system transforms analytical procedures from static documents into dynamic, living systems that evolve based on performance data.
Continuous Monitoring Technologies for Organic Analysis
Total Organic Carbon (TOC) Monitoring
Total Organic Carbon analysis represents a well-established continuous monitoring technology with particular relevance for pharmaceutical water systems and cleaning validation. Modern TOC analyzers provide real-time surveillance of water purity, detecting ppb-level organic contaminants that could compromise product quality [125]. These systems serve as early warning mechanisms for potential contamination events, enabling immediate investigation and corrective action.
In pharmaceutical applications, TOC monitoring supports both continuous system verification and cleaning validation. As a Process Analytical Technology, online TOC analyzers monitor purified water and water for injection systems continuously, while portable units enable at-line testing during cleaning validation [125]. This dual application demonstrates how continuous monitoring technologies serve multiple roles within the method lifecycle - from initial method execution (cleaning verification) to ongoing system monitoring (water quality).
Recent technological advances have expanded TOC capabilities, with specialized instruments now covering dynamic ranges from 0.03 ppb for microelectronics manufacturing to 50,000 ppm for industrial wastewater applications [125]. This flexibility makes TOC applicable across various stages of pharmaceutical manufacturing, from API synthesis to final product purification.
Volatile Organic Compounds (VOC) Monitoring
Sensor-based technologies enable continuous monitoring of volatile organic compounds in both environmental and process applications. Advanced monitoring stations integrate metal oxide semiconductor gas sensors with temperature, humidity, and pressure sensors to provide comprehensive environmental profiling [126]. These systems operate autonomously, collecting data at frequent intervals (e.g., every 1.5 minutes) to capture transient pollution events that might be missed with periodic sampling.
A recent study demonstrated the application of VOC monitoring stations equipped with automatic sampling capabilities triggered during odor/nuisance events [126]. When sensor readings exceeded predefined thresholds, the system automatically activated sampling pumps to collect air samples onto multi-sorbent bed tubes for subsequent TD-GC/MS analysis [126]. This hybrid approach combines the real-time capability of continuous sensors with the specificity of laboratory analysis, creating a comprehensive monitoring solution.
The study documented TVOC concentrations ranging between 78-669 μg m⁻³ and 12-159 μg m⁻³ at two monitoring sites, with particularly relevant chloroform concentrations of 19-159 μg m⁻³ at one location [126]. This precision in measurement enables researchers to identify specific industrial sources and implement targeted mitigation strategies.
Automated Chromatographic Monitoring
Modern chromatographic systems incorporate continuous monitoring capabilities through sophisticated data acquisition and processing technologies. These systems track numerous performance parameters in real-time, including baseline noise, peak symmetry, retention time stability, and resolution critical peak pairs [25] [124]. Automated system suitability testing provides immediate feedback on method performance before sample analysis, preventing compromised results due to chromatographic issues.
Advanced monitoring features include instrument-to-instrument method transfer capabilities that adjust parameters such as gradient delay volume to maintain retention time consistency across different platforms [25] [124]. One documented example fine-tuned gradient delay volume from a default 25 μL to 200 μL, successfully correcting retention time deviations for chlorhexidine impurity analysis during method transfer [25]. This level of automated adjustment exemplifies how continuous monitoring and control technologies maintain method robustness across the analytical lifecycle.
Comparative Analysis of Monitoring Approaches
Table 1: Comparison of Continuous Monitoring Technologies for Organic Analysis
| Technology | Analytical Principle | Detection Range | Key Applications | Implementation Considerations |
|---|---|---|---|---|
| Total Organic Carbon (TOC) Analyzers | Chemical oxidation and detection of resulting CO₂ | 0.03 ppb to 50,000 ppm | Pharmaceutical water systems, cleaning validation, wastewater monitoring | Requires method validation for specific matrices; different oxidation techniques needed for various compound types |
| VOC Sensors | Metal oxide semiconductor detection | Low ppb to ppm ranges | Environmental monitoring, process safety, odor complaint investigation | Limited compound specificity; requires periodic calibration; best used with confirmatory laboratory analysis |
| Automated Chromatographic Systems | HPLC/UHPLC with various detection methods | Compound-dependent | Method transfer verification, system suitability testing, ongoing performance verification | High initial investment; requires specialized training; provides compound-specific data |
| Sensor Stations with Automated Sampling | Hybrid sensor and sorbent tube sampling | Wide range with GC/MS confirmation | Episodic pollution events, industrial hygiene monitoring | Complex implementation; combines real-time monitoring with definitive analysis |
Experimental Protocols for Robustness Assessment
Automated Method Scouting Protocol
Robustness testing begins during method development with comprehensive parameter optimization. The following protocol, adapted from documented approaches [25], provides a systematic framework for establishing robust chromatographic methods:
Column Screening: Automatically scout four or more columns spanning broad selectivity ranges using column switching technology.
Mobile Phase Optimization: Systematically screen six or more aqueous buffers across pH 3-8 ranges to determine optimal separation conditions.
Temperature Profiling: Investigate optimal separation temperatures using advanced thermostatting options, including sub-ambient conditions (e.g., 10°C) when needed for improved resolution.
Data Processing: Employ advanced software to objectively select optimal conditions based on pre-defined criteria (e.g., resolution of critical peak pairs).
This automated approach tested 24 different chromatographic conditions in under 20 hours with total data processing under one hour, dramatically accelerating robustness assessment during method development [25].
Method Transfer Verification Protocol
Ensuring method robustness during transfer between instruments or laboratories requires systematic verification:
System Comparison: Analyze identical samples on both originating and receiving instruments using the identical method conditions.
Parameter Adjustment: Fine-tune gradient delay volume using instrument-specific tools (e.g., idle volume adjustment, method transfer kits) to compensate for system volume differences [25].
Performance Verification: Confirm congruence in peak area, retention time, and resolution for all critical analytes.
Documentation: Automatically generate comparison reports using instrument data systems to document successful transfer.
One documented case study demonstrated successful method transfer for a compendial impurity method, with fine-tuning of GDV successfully correcting retention time deviations [25].
Continuous Performance Monitoring Protocol
Implementing ongoing robustness verification during routine analysis:
System Suitability: Incorporate appropriate system suitability tests that challenge method robustness (e.g., resolution of critical pairs, tailing factor, precision).
Quality Control Samples: Analyze QC samples at appropriate frequencies to monitor long-term method performance.
Data Tracking: Automatically monitor and trend critical method parameters (retention time, peak area, resolution) using chromatographic data systems.
Alert Thresholds: Establish action limits for key parameters to trigger investigation before method failure occurs.
Visualization of Lifecycle Management Framework
Analytical Procedure Lifecycle Management Framework
This framework illustrates the integrated nature of modern analytical procedure management, with continuous monitoring technologies providing critical data for ongoing performance verification and feeding back into method improvement cycles.
The Scientist's Toolkit: Essential Research Reagents and Technologies
Table 2: Essential Research Reagents and Technologies for Robust Method Monitoring
| Tool/Technology | Function | Application Example |
|---|---|---|
| Automated Method Development Systems | Rapid screening of chromatographic parameters | Simultaneous testing of multiple columns, mobile phases, and temperatures to establish robust method conditions [25] |
| TOC Analyzers | Continuous monitoring of organic carbon content | Real-time verification of water purity in pharmaceutical manufacturing [125] |
| VOC Monitoring Stations | Detection of volatile organic compounds | Environmental monitoring with automatic sampling during episodic events [126] |
| Method Transfer Kits | Adjustment of gradient delay volumes | Fine-tuning chromatographic systems to maintain retention time consistency during method transfer [25] |
| Chromatography Data Systems with Validation Templates | Automated validation workflow execution | Streamlined method validation using ICH-compliant templates for accuracy, precision, and robustness testing [124] |
| Multi-sorbent Bed Tubes | Capture and preservation of VOC samples | Automated collection of air samples during sensor-triggered events for subsequent TD-GC/MS analysis [126] |
| Advanced Column Heaters | Precise temperature control | Investigation of temperature effects on separation robustness during method development [25] |
The integration of continuous monitoring technologies within a structured lifecycle management framework represents the future of robust analytical procedures. This approach moves beyond traditional one-time validation to create living, adaptive methods that maintain reliability throughout their operational lifetime. For researchers and pharmaceutical professionals, these advancements offer unprecedented capability to ensure method robustness while improving efficiency through automation and real-time quality assurance.
As regulatory guidance evolves to embrace Analytical Procedure Lifecycle Management, the scientific community must continue developing and refining continuous monitoring technologies that provide meaningful data for method understanding and control. The tools and approaches described in this guide provide a foundation for implementing these modern paradigms in organic analytical procedures, ultimately enhancing product quality and patient safety through more robust analytical methods.
Conclusion
Robustness testing represents a critical pillar in developing reliable organic analytical procedures that withstand the variations inherent in real-world laboratory environments. By integrating robustness assessment early in method development using systematic, QbD-based approaches, organizations can significantly reduce method failure rates, improve regulatory compliance, and enhance operational efficiency. The future of analytical science in biomedical research increasingly demands methods that are not only validated but demonstrably robust across their entire lifecycle. Embracing the principles outlined in this article—from foundational concepts through advanced troubleshooting and validation strategies—will equip scientists and drug development professionals to build more resilient quality systems, accelerate method transfer, and ultimately deliver safer, more effective pharmaceutical products to patients.
References
- 1. Method Validation and Robustness | LCGC International [https://www.chromatographyonline.com/view/method-validation-and-robustness]
- 2. ( ICH ) — Blueprint for Method‑Validation Excellence Q 2 R 2 [https://www.linkedin.com/pulse/ichq2r2-blueprint-methodvalidation-excellence-anil-s-rawat-elxzf]
- 3. Robustness in Dissolution Validations [https://www.linkedin.com/pulse/robustness-dissolution-validations-ken-boda]
- 4. Robustness in experimental design: A study on the reliability ... [https://pmc.ncbi.nlm.nih.gov/articles/PMC3962228/]
- 5. Robustness and Ruggedness Testing in Analytical Chemistry [https://www.labmanager.com/robustness-and-ruggedness-testing-in-analytical-chemistry-34247]
- 6. Difference between robustness and ruggedness [https://ask.pharmaguideline.com/t/difference-between-robustness-and-ruggedness/7171]
- 7. Chapter 3 Review of the use of robustness and ... [https://www.sciencedirect.com/science/article/pii/S0922348796800165]
- 8. 10. Ruggedness, robustness [https://sisu.ut.ee/lcms_method_validation/10-ruggedness-robustness/]
- 9. Design Space of Robust Analytical Methods in the ... - SEQENS [https://www.seqens.com/knowledge-center/design-space-of-robust-analytical-methods-in-the-pharmaceutical-environment/]
- 10. Youden test application in robustness assays during ... [https://pubmed.ncbi.nlm.nih.gov/24508395/]
- 11. Robustness evaluation in analytical methods optimized ... [https://www.sciencedirect.com/science/article/abs/pii/S0026265X16303599]
- 12. Integrity Testing: Key Methods, Goals, and Best Practices [https://www.acceldata.io/blog/data-integrity-testing-explained-safeguard-accuracy-reliability]
- 13. Analytical Standards Market Research 2025 [https://www.globenewswire.com/news-release/2025/04/17/3063122/28124/en/Analytical-Standards-Market-Research-2025-Global-Forecast-to-2030-Raw-Material-Testing-to-Maintain-Largest-Share-in-Analytical-Standards-Methodology.html]
- 14. ICH and FDA Guidelines for Analytical Method Validation [https://www.labmanager.com/ich-and-fda-guidelines-for-analytical-method-validation-34252]
- 15. Q2(R2) Validation of Analytical Procedures March 2024 [https://www.fda.gov/regulatory-information/search-fda-guidance-documents/q2r2-validation-analytical-procedures]
- 16. ICH Q2(R2) Validation of analytical procedures [https://www.ema.europa.eu/en/ich-q2r2-validation-analytical-procedures-scientific-guideline]
- 17. Robustness Tests | LCGC International [https://www.chromatographyonline.com/view/robustness-tests]
- 18. Analytical Method Robustness → Term [https://fashion.sustainability-directory.com/term/analytical-method-robustness/]
- 19. Analytical Method Transfer in Pharmaceuticals | AMT ... [https://www.pharmaguideline.com/2025/09/analytical-method-transfer-in-pharmaceuticals.html]
- 20. Importance of acceptance criteria in analytical method ... [https://www.gmpsop.com/importance-of-acceptance-criteria-in-analytical-method-transfer/]
- 21. Analytical Method Transfer: Best Practices and Guidelines [https://www.labmanager.com/analytical-method-transfer-best-practices-and-guidelines-34130]
- 22. Best Practices for Transferring Analytical Methods [https://www.jmolner.com/post/transferring-analytical-methods]
- 23. ICH publishes Training Materials on Q2(R2) and Q14 [https://www.gmp-compliance.org/gmp-news/ich-publishes-training-materials-on-q2r2-and-q14]
- 24. On the Impact of Parametric Assumptions and Robust ... [https://pmc.ncbi.nlm.nih.gov/articles/PMC2875790/]
- 25. Tools and Technologies for Robust Method Lifecycle ... [https://www.biopharminternational.com/view/tools-and-technologies-for-robust-method-lifecycle-management-in-liquid-chromatography]
- 26. Critical Evaluation of HPLC Methods | LCGC International [https://www.chromatographyonline.com/view/critical-evaluation-hplc-methods]
- 27. Critical Choices in HPLC – Selecting Column Stationary ... [https://www.chromacademy.com/hplc/method-development/critical-choices-in-hplc-selecting-column-stationary-phase-and-dimensions/]
- 28. Liquid Chromatography Comparison: HPLC vs UPLC ... [https://americanlaboratorytrading.com/liquid-chromatography-comparison-hplc-vs-uplc-vs-fplc/?srsltid=AfmBOop8Hil7_qh4nlS-iozJXSf5cA9LA2fSPjyD9CQxTAy8YZyq2LxB]
- 29. Establishing Acceptance Criteria for Analytical Methods [https://www.biopharminternational.com/view/establishing-acceptance-criteria-analytical-methods]
- 30. How To Perform Robustness In Analytical Method Validation [https://pharmaguru.co/robustness-in-analytical-method-validation/]
- 31. Towards global reaction feasibility and robustness ... [https://www.nature.com/articles/s41467-025-59812-0]
- 32. The Use of Factorial Design and Simplex Optimization to ... [https://pmc.ncbi.nlm.nih.gov/articles/PMC7411898/]
- 33. Screening Designs (Part 1) — Types and Properties [https://www.chromatographyonline.com/view/screening-designs-part-1-types-and-properties]
- 34. 3 main types of Design of Experiments (DOE) designs [https://www.synthace.com/blog/types-of-doe-design-a-users-guide]
- 35. Full Factorial vs. Fractional Factorial Design - Lean 6 Sigma Hub [https://lean6sigmahub.com/full-factorial-vs-fractional-factorial-design-choosing-the-right-doe-approach-for-your-lean-six-sigma-projects/]
- 36. Factorial Design - What Is It, Examples, Advantages, Types [https://www.wallstreetmojo.com/factorial-design/]
- 37. Full Factorial Design: Comprehensive Guide for Optimal ... [https://www.6sigma.us/six-sigma-in-focus/full-factorial-design/]
- 38. Factorial and fractional factorial designs - Minitab - Support [https://support.minitab.com/en-us/minitab/help-and-how-to/statistical-modeling/doe/supporting-topics/factorial-and-screening-designs/factorial-and-fractional-factorial-designs/]
- 39. Implementing Clinical Research Using Factorial Designs [https://pmc.ncbi.nlm.nih.gov/articles/PMC5458623/]
- 40. Full Factorial vs Fractional Factorial Designs [https://www.benchmarksixsigma.com/forum/topic/39424-full-factorial-vs-fractional-factorial-designs/]
- 41. Efficiency of Full and Fractional Factorial Designs in Quality ... [https://ojs.wsb.edu.pl/index.php/fso/article/view/1302]
- 42. Comparison of Plackett–Burman and supersaturated ... [https://www.sciencedirect.com/science/article/abs/pii/S000326700602294X]
- 43. Screening Experiments Using Plackett-Burman Design [https://help.reliasoft.com/articles/content/hotwire/issue166/hottopics166.htm]
- 44. Plackett-Burman Designs | Statistics Knowledge Portal [https://www.jmp.com/en/statistics-knowledge-portal/design-of-experiments/screening-designs/plackett-burman-designs]
- 45. 8.4 - Plackett-Burman Designs | STAT 503 [https://online.stat.psu.edu/stat503/lesson/8/8.4]
- 46. Design of Experiments: Plackett Burman Designs [https://www.6sigma.us/six-sigma-in-focus/plackett-burman-designs/]
- 47. When and How to Use Plackett-Burman Experimental Design [https://www.isixsigma.com/design-of-experiments-doe/when-and-how-to-use-plackett-burman-experimental-design/]
- 48. Comparison of Plackett-Burman and supersaturated ... [https://pubmed.ncbi.nlm.nih.gov/17605984/]
- 49. Guidance for robustness/ruggedness tests in method ... [https://www.sciencedirect.com/science/article/abs/pii/S073170850000529X]
- 50. Robustness in Analytical Methods Outlined [https://www.pharmtech.com/view/robustness-analytical-methods-outlined]
- 51. 10 Important Tips to Develop a Robust Test Method ... [https://app.scientist.com/blog/2025/05/22/10-important-tips-to-develop-a-robust-test-method-for-gmp-testing-of-biopharmaceuticals]
- 52. Enhanced Approach of Analytical Development [https://www.scientificupdate.com/training_courses/enhanced-approach-of-analytical-method-development-analytical-qbd-in-different-phases-of-clinical-development/]
- 53. of Comparison in Method Transfer and... Analytical Procedures [https://pubmed.ncbi.nlm.nih.gov/37468665/]
- 54. What is Comparative and How to Conduct It? | Appinio Blog Analysis [https://www.appinio.com/en/blog/market-research/comparative-analysis]
- 55. Understanding the Lifecycle Approach for Analytical ... [https://www.chromatographyonline.com/view/understanding-lifecycle-approach-analytical-procedures]
- 56. Design and validation of a robust stability-indicating reversed ... [https://pmc.ncbi.nlm.nih.gov/articles/PMC12619242/]
- 57. Specification Equivalence: A Practical Approach to Method ... [https://www.pharmtech.com/view/specification-equivalence-a-practical-approach-to-method-and-acceptance-criteria-equivalence]
- 58. Important Aspects of the Design of Experiments and Data ... [https://www.preprints.org/manuscript/202411.0548/v1]
- 59. Development and validation of a novel isocratic RP-HPLC ... [https://www.sciencedirect.com/science/article/pii/S092809872500274X]
- 60. A DoE-QSRR model for virtual Method Operable Design ... [https://www.sciencedirect.com/science/article/abs/pii/S0731708523006763]
- 61. Leveraging Analytical Quality by Design Principles for ... [https://www.waters.com/nextgen/us/en/library/application-notes/2025/leveraging-analytical-quality-by-design-principles-for-efficient-development-of-a-targeted-assay-method-for-routine-monitoring-of-mannose-5-glycans-using-fluorescence-detection.html?srsltid=AfmBOoouzb8QwlSuhyJWhK7CeJt_Owcqn79oHZchfr_i_Kb4qB0badce]
- 62. A systemic approach to estimate and validate RP-HPLC ... [https://pmc.ncbi.nlm.nih.gov/articles/PMC11999136/]
- 63. Greenness analysis of stability indicating RP-HPLC ... [https://link.springer.com/article/10.1007/s44371-025-00289-7]
- 64. The Dynamic balances in HPLC [https://www.sciencedirect.com/science/article/abs/pii/S0021967325006132]
- 65. Functional Data Analysis for HPLC Optimization [https://www.jmp.com/en/academic/case-study-library/functional-data-analysis-for-hplc-optimization]
- 66. Optimization of HPLC methods for the development of quality ... [https://pmc.ncbi.nlm.nih.gov/articles/PMC12105191/]
- 67. 2025 HPLC Column and Accessories Review [https://www.chromatographyonline.com/view/innovations-in-liquid-chromatography-2025-hplc-column-and-accessories-review]
- 68. Troubleshooting Peak Shape Problems in HPLC [https://www.waters.com/nextgen/us/en/education/primers/troubleshooting-guide-for-hplc.html?srsltid=AfmBOooTQh2hI-BrmK3x3YWEgzX1gSM2dG2nlMhNVh86Ufb5GfmPDDxZ]
- 69. Troubleshooting Basics, Part IV: Peak Shape Problems [https://www.chromatographyonline.com/view/troubleshooting-basics-part-iv-peak-shape-problems]
- 70. Chromatography Fundamentals, Part VIII: The Meaning and Significance of Chromatographic Resolution | LCGC International [https://www.chromatographyonline.com/view/chromatography-fundamentals-part-viii-meaning-and-significance-chromatographic-resolution]
- 71. Estimating Resolution for Marginally Separated Peaks | LCGC International [https://www.chromatographyonline.com/view/estimating-resolution-marginally-separated-peaks-0]
- 72. Developing and Validating a Robust RP-HPLC Method for ... [https://pmc.ncbi.nlm.nih.gov/articles/PMC12543500/]
- 73. What is Measurement Drift? [https://www.system-scale.com/what-is-measurement-drift]
- 74. Evaluation of intensity drift correction strategies using ... [https://pmc.ncbi.nlm.nih.gov/articles/PMC5788449/]
- 75. Capturing System Drift with Time Series Calibration ... [https://arxiv.org/html/2509.13010]
- 76. Why do time based instruments drift less than other ... [https://orion-technical.com/blog/posts/why-time-based-instruments-are-so-stable/]
- 77. Understanding Pharmaceutical Quality by Design - PMC [https://pmc.ncbi.nlm.nih.gov/articles/PMC4070262/]
- 78. Analytical Quality by Design (AQbD) Approach to the ... [https://pmc.ncbi.nlm.nih.gov/articles/PMC9653622/]
- 79. Analytical quality by design-compliant development of ... [https://www.sciencedirect.com/science/article/abs/pii/S0026265X24026572]
- 80. Quality by Design Approach to Analytical Method ... [https://www.catalent.com/better-biotech/building-products/quality-by-design-approach-to-analytical-method-optimization-2/]
- 81. Implementing Robustness for HPLC Methods | Separation... Testing [https://www.sepscience.com/implementing-robustness-testing-for-hplc-methods-6978]
- 82. Application of a robustness screen for the... | Nature Protocols [https://www.nature.com/articles/nprot.2014.076?error=cookies_not_supported&code=f66f7dd0-2e04-4c0d-962e-440ca2bcf946]
- 83. Analytical Quality by Design (AQbD) for Quality and Risk ... [https://www.syncsci.com/journal/JPBR/article/view/JPBR.2025.01.001]
- 84. Aspects and Implementation of Pharmaceutical Quality by ... [https://pmc.ncbi.nlm.nih.gov/articles/PMC12114689/]
- 85. Reliable, Reportable Data with Analytical Quality by ... [https://www.waters.com/blog/analytical-quality-by-design/?srsltid=AfmBOoqYO81KKv34VeZ3a12kpVBjOC5W6id2UNEYP3U8WIfCyQBqm4Ai]
- 86. Analytical Quality by Design (AQbD): A Comprehensive ... [https://ijrpas.com/AbstractView.aspx?PID=2025-4-8-1]
- 87. Recent applications of analytical quality-by-design ... [https://www.sciencedirect.com/science/article/abs/pii/S0169743924001837]
- 88. Analytical quality by design guided white ... [https://www.sciencedirect.com/science/article/abs/pii/S1570023225000261]
- 89. Analytical quality by design-based RP-HPLC method for ... [https://link.springer.com/article/10.1007/s00769-025-01672-8]
- 90. A quality by design approach with comprehensive green ... [https://japsonline.com/abstract.php?article_id=4529&sts=2]
- 91. System Suitability Testing: Ensuring Reliable Results [https://www.labmanager.com/system-suitability-testing-ensuring-reliable-results-34248]
- 92. Derivation of system suitability test limits from a robustness ... [https://www.sciencedirect.com/science/article/abs/pii/S0731708502004703]
- 93. What are system suitability tests (SST) of analytical methods? [https://mpl.loesungsfabrik.de/en/english-blog/method-validation/sst]
- 94. Derivation of system suitability test limits from a robustness ... [https://pubmed.ncbi.nlm.nih.gov/12408910/]
- 95. Ongoing Analytical Procedure Performance Verification Using ... [https://pmc.ncbi.nlm.nih.gov/articles/PMC10809227/]
- 96. Correction Vs Corrective Action (Preventive Action). ... [https://www.6sigma.us/six-sigma-in-focus/correction-vs-corrective-action/]
- 97. Correction vs Corrective Action vs Preventive Action [https://info.degrandson.com/blog/ccapa]
- 98. Correction, Corrective Action, and Preventive Action (CAPA) [https://pharmadocx.com/differences-between-correction-corrective-action-and-preventive-action/]
- 99. Corrective Action vs Preventive Action in CAPA Explained [https://www.qualityze.com/blogs/corrective-action-vs-preventive-action]
- 100. Understanding Corrective vs Preventive Action [https://www.compliancequest.com/bloglet/corrective-vs-preventive-action/]
- 101. What is the difference between corrective actions and ... [https://sbnsoftware.com/blog/what-is-the-difference-between-corrective-actions-and-preventive-actions/]
- 102. Overfitting in Machine Vision Explained [https://www.unitxlabs.com/overfitting-machine-vision-explained/]
- 103. Overfitting And Pruning [https://www.meegle.com/en_us/topics/overfitting/overfitting-and-pruning]
- 104. Overfitting Vs. Underfitting: The Hidden Flaw In Your ... [https://www.sigmacomputing.com/blog/overfitting-vs-underfitting]
- 105. A New Era for Analytical Procedure Lifecycle Management [https://synergbiopharma.com/navigating-analytical-method-comparability-and-equivalency-under-ich-q14-a-new-era-for-analytical-procedure-lifecycle-management/]
- 106. Robustness comparison of three statistical methods ... [https://link.springer.com/article/10.1007/s00769-025-01669-3]
- 107. Analytical Method Development with a Practical Risk ... [https://www.americanpharmaceuticalreview.com/Featured-Articles/619865-Analytical-Method-Development-with-a-Practical-Risk-Assessment-Program-that-Enhances-Commercial-QC-Robustness/]
- 108. Challenges in Developing Analytical Procedures with the ... [https://www.pharmoutsourcing.com/Featured-Articles/621016-Challenges-in-Developing-Analytical-Procedures-with-the-New-ICH-Q14-Guideline/]
- 109. ICH Q14 and the Paradigm Shift in Pharmaceutical Analytics [https://www.gmp-journal.com/current-articles/details/ich-q14-and-the-paradigm-shift-in-pharmaceutical-analytics.html]
- 110. A comparison of three procedures for robust PCA ... [https://www.sciencedirect.com/science/article/pii/S0026265X12000872]
- 111. OFAT (One-Factor-at-a-Time). All You Need to Know [https://www.6sigma.us/six-sigma-in-focus/ofat-one-factor-at-a-time/]
- 112. Understanding OFAT and Multiple OFAT: Exploring ... [https://www.linkedin.com/pulse/understanding-ofat-multiple-exploring-experimental-approaches-rao-gq5gc]
- 113. Analytical Method Validation: A Comprehensive Review ... [http://www.seejph.com/index.php/seejph/article/view/6516]
- 114. Red analytical performance index (RAPI) and software [https://pubs.rsc.org/en/content/articlehtml/2025/gc/d4gc05298f]
- 115. Technology Transfer of Analytical Testing Methods [https://pharmaguru.co/technology-transfer-of-analytical-testing-methods/]
- 116. Method Transfer, Partial Validation, and Cross Validation [https://pmc.ncbi.nlm.nih.gov/articles/PMC4389741/]
- 117. Essentials in Establishing and Using Design Space [https://www.biopharminternational.com/view/essentials-establishing-and-using-design-space]
- 118. Design Space: Regulatory Principles, Best Practices, and ... [https://www.linkedin.com/pulse/design-space-regulatory-principles-best-practices-trends-r-fghyc]
- 119. How to Ensure Faster Regulatory Approvals [https://www.freyrsolutions.com/blog/how-to-ensure-faster-regulatory-approvals-from-submission-to-market]
- 120. Rethinking Pharmaceutical Industry with Quality by Design [https://link.springer.com/article/10.1208/s12248-025-01079-w]
- 121. Quality by Design: A Tool for Separation Method ... [https://www.chromatographyonline.com/view/quality-design-tool-separation-method-development-pharmaceutical-laboratories]
- 122. A Practical Approach to Implementing ICH Q14 [https://pmc.ncbi.nlm.nih.gov/articles/PMC12449753/]
- 123. Top 10 Continuous Monitoring Tools for Enhanced Security [https://signoz.io/comparisons/continuous-monitoring-tools/]
- 124. Method Life Cycle Management [https://www.thermofisher.com/us/en/home/industrial/pharma-biopharma/pharmaceutical-quality-control-testing/method-lifecycle-management.html]
- 125. Total Organic Carbon (TOC) Analysis [https://www.watertechnologies.com/applications/total-organic-carbon-toc]
- 126. Continuous monitoring of volatile organic compounds ... [https://www.sciencedirect.com/science/article/pii/S1352231023000833]